Cities with the Highest Percentage of Population Employed in Office & Administration in New Hampshire
RELATED REPORTS & OPTIONS
Office & Administration
New Hampshire
Compare Cities
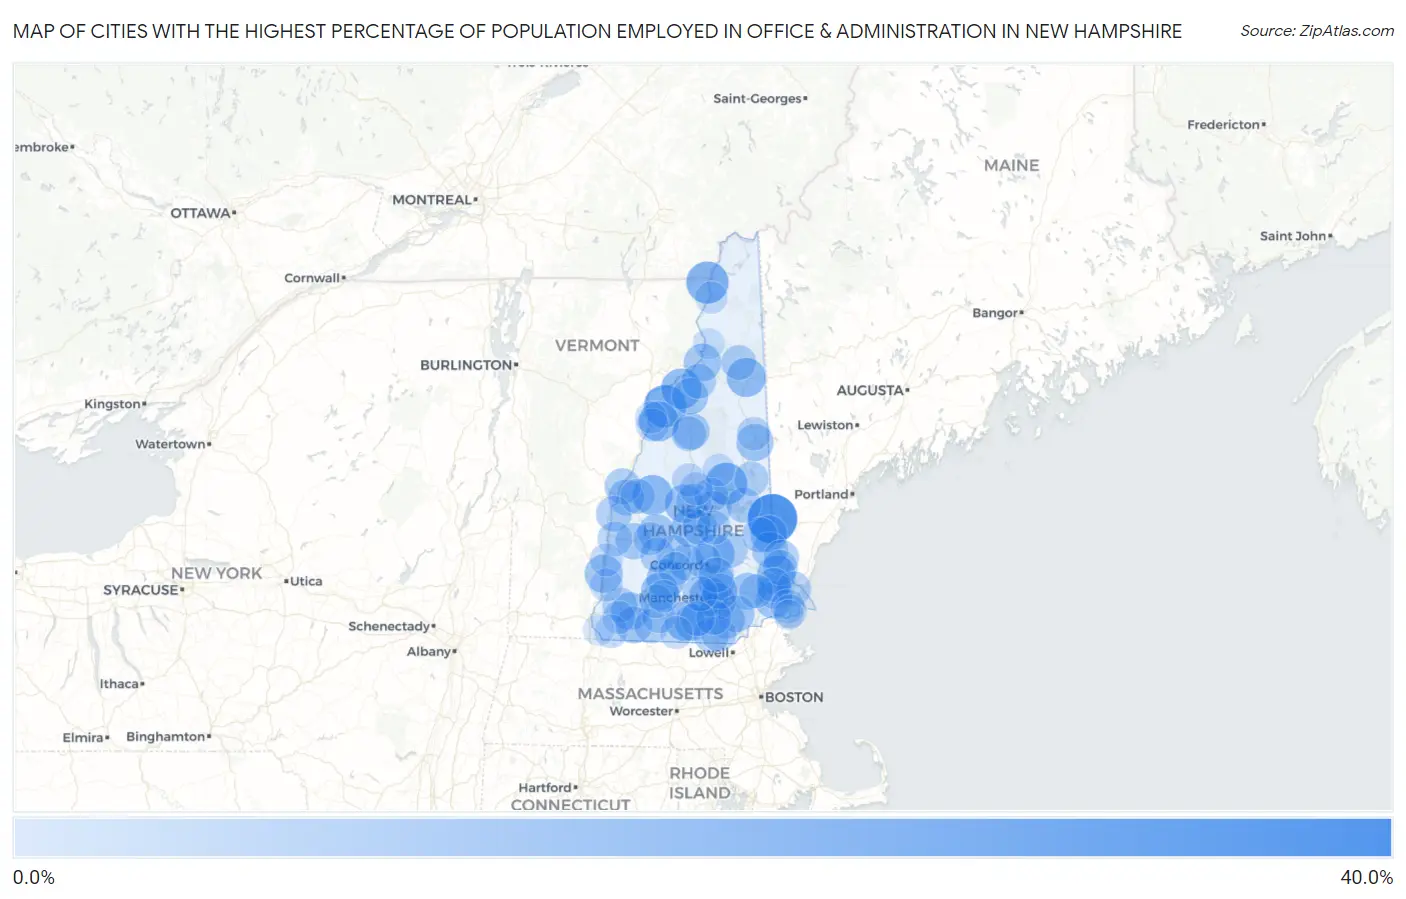
Map of Cities with the Highest Percentage of Population Employed in Office & Administration in New Hampshire
0.0%
40.0%
Cities with the Highest Percentage of Population Employed in Office & Administration in New Hampshire
| City | % Employed | vs State | vs National | |
| 1. | Milton Mills | 38.7% | 10.3%(+28.4)#1 | 10.9%(+27.9)#451 |
| 2. | Lisbon | 23.9% | 10.3%(+13.6)#2 | 10.9%(+13.0)#1,478 |
| 3. | West Stewartstown | 23.7% | 10.3%(+13.4)#3 | 10.9%(+12.9)#1,502 |
| 4. | Suissevale | 23.5% | 10.3%(+13.2)#4 | 10.9%(+12.6)#1,558 |
| 5. | Littleton | 20.2% | 10.3%(+9.92)#5 | 10.9%(+9.38)#2,326 |
| 6. | Canaan | 19.5% | 10.3%(+9.18)#6 | 10.9%(+8.64)#2,617 |
| 7. | Mountain Lakes | 19.3% | 10.3%(+8.95)#7 | 10.9%(+8.40)#2,694 |
| 8. | Wilton | 18.6% | 10.3%(+8.29)#8 | 10.9%(+7.74)#3,027 |
| 9. | Franklin | 17.8% | 10.3%(+7.51)#9 | 10.9%(+6.96)#3,445 |
| 10. | Gorham | 17.4% | 10.3%(+7.13)#10 | 10.9%(+6.58)#3,678 |
| 11. | Loudon | 17.4% | 10.3%(+7.12)#11 | 10.9%(+6.57)#3,686 |
| 12. | Hillsborough | 17.4% | 10.3%(+7.04)#12 | 10.9%(+6.50)#3,737 |
| 13. | Pinardville | 17.0% | 10.3%(+6.71)#13 | 10.9%(+6.16)#3,967 |
| 14. | Durham | 16.8% | 10.3%(+6.54)#14 | 10.9%(+5.99)#4,075 |
| 15. | Bristol | 15.8% | 10.3%(+5.48)#15 | 10.9%(+4.93)#4,978 |
| 16. | North Walpole | 15.8% | 10.3%(+5.48)#16 | 10.9%(+4.93)#4,982 |
| 17. | Antrim | 15.4% | 10.3%(+5.05)#17 | 10.9%(+4.51)#5,473 |
| 18. | Marlborough | 14.6% | 10.3%(+4.30)#18 | 10.9%(+3.75)#6,368 |
| 19. | Lancaster | 14.6% | 10.3%(+4.26)#19 | 10.9%(+3.71)#6,420 |
| 20. | Francestown | 14.5% | 10.3%(+4.24)#20 | 10.9%(+3.69)#6,451 |
| 21. | Conway | 14.0% | 10.3%(+3.70)#21 | 10.9%(+3.15)#7,199 |
| 22. | Milton | 13.5% | 10.3%(+3.23)#22 | 10.9%(+2.68)#7,953 |
| 23. | Exeter | 13.5% | 10.3%(+3.21)#23 | 10.9%(+2.66)#7,980 |
| 24. | Londonderry | 13.5% | 10.3%(+3.17)#24 | 10.9%(+2.62)#8,057 |
| 25. | Raymond | 13.2% | 10.3%(+2.92)#25 | 10.9%(+2.37)#8,511 |
| 26. | Hooksett | 13.1% | 10.3%(+2.77)#26 | 10.9%(+2.22)#8,775 |
| 27. | Milford | 13.0% | 10.3%(+2.68)#27 | 10.9%(+2.13)#8,959 |
| 28. | New London | 12.9% | 10.3%(+2.55)#28 | 10.9%(+2.00)#9,178 |
| 29. | Troy | 12.8% | 10.3%(+2.50)#29 | 10.9%(+1.95)#9,271 |
| 30. | Manchester | 12.7% | 10.3%(+2.38)#30 | 10.9%(+1.83)#9,503 |
| 31. | Derry | 12.6% | 10.3%(+2.33)#31 | 10.9%(+1.78)#9,618 |
| 32. | Lincoln | 12.5% | 10.3%(+2.14)#32 | 10.9%(+1.60)#10,041 |
| 33. | Bethlehem | 12.3% | 10.3%(+2.02)#33 | 10.9%(+1.47)#10,291 |
| 34. | Newport | 12.1% | 10.3%(+1.77)#34 | 10.9%(+1.22)#10,819 |
| 35. | Rochester | 11.8% | 10.3%(+1.49)#35 | 10.9%(+0.945)#11,369 |
| 36. | Contoocook | 11.6% | 10.3%(+1.33)#36 | 10.9%(+0.783)#11,739 |
| 37. | Lebanon | 11.3% | 10.3%(+1.03)#37 | 10.9%(+0.481)#12,400 |
| 38. | Hanover | 11.2% | 10.3%(+0.893)#38 | 10.9%(+0.345)#12,715 |
| 39. | Plainfield | 10.7% | 10.3%(+0.372)#39 | 10.9%(-0.177)#13,960 |
| 40. | Newfields | 10.5% | 10.3%(+0.218)#40 | 10.9%(-0.330)#14,277 |
| 41. | Laconia | 10.5% | 10.3%(+0.153)#41 | 10.9%(-0.396)#14,444 |
| 42. | South Hooksett | 10.4% | 10.3%(+0.066)#42 | 10.9%(-0.482)#14,677 |
| 43. | Tilton Northfield | 10.3% | 10.3%(+0.000)#43 | 10.9%(-0.548)#14,869 |
| 44. | Farmington | 10.3% | 10.3%(-0.034)#44 | 10.9%(-0.582)#14,932 |
| 45. | Nashua | 10.2% | 10.3%(-0.089)#45 | 10.9%(-0.637)#15,074 |
| 46. | Pittsfield | 10.2% | 10.3%(-0.093)#46 | 10.9%(-0.641)#15,079 |
| 47. | Somersworth | 10.0% | 10.3%(-0.261)#47 | 10.9%(-0.809)#15,453 |
| 48. | Concord | 10.0% | 10.3%(-0.268)#48 | 10.9%(-0.817)#15,470 |
| 49. | New Hampton | 9.9% | 10.3%(-0.374)#49 | 10.9%(-0.923)#15,742 |
| 50. | Wolfeboro | 9.9% | 10.3%(-0.428)#50 | 10.9%(-0.976)#15,858 |
| 51. | Dover | 9.8% | 10.3%(-0.523)#51 | 10.9%(-1.07)#16,095 |
| 52. | Keene | 9.7% | 10.3%(-0.621)#52 | 10.9%(-1.17)#16,325 |
| 53. | Suncook | 9.6% | 10.3%(-0.753)#53 | 10.9%(-1.30)#16,636 |
| 54. | Hudson | 9.5% | 10.3%(-0.795)#54 | 10.9%(-1.34)#16,751 |
| 55. | Warner | 9.4% | 10.3%(-0.896)#55 | 10.9%(-1.44)#16,982 |
| 56. | Bradford | 9.4% | 10.3%(-0.946)#56 | 10.9%(-1.49)#17,095 |
| 57. | East Merrimack | 9.3% | 10.3%(-0.998)#57 | 10.9%(-1.55)#17,203 |
| 58. | North Woodstock | 9.2% | 10.3%(-1.09)#58 | 10.9%(-1.64)#17,434 |
| 59. | Whitefield | 9.2% | 10.3%(-1.13)#59 | 10.9%(-1.68)#17,545 |
| 60. | Portsmouth | 9.1% | 10.3%(-1.16)#60 | 10.9%(-1.71)#17,597 |
| 61. | Goffstown | 9.1% | 10.3%(-1.19)#61 | 10.9%(-1.74)#17,652 |
| 62. | Enfield | 9.1% | 10.3%(-1.20)#62 | 10.9%(-1.75)#17,677 |
| 63. | Berlin | 9.1% | 10.3%(-1.21)#63 | 10.9%(-1.76)#17,705 |
| 64. | Amherst | 9.0% | 10.3%(-1.30)#64 | 10.9%(-1.85)#17,920 |
| 65. | Claremont | 8.8% | 10.3%(-1.55)#65 | 10.9%(-2.09)#18,485 |
| 66. | Center Ossipee | 8.6% | 10.3%(-1.70)#66 | 10.9%(-2.25)#18,810 |
| 67. | Newmarket | 8.3% | 10.3%(-2.00)#67 | 10.9%(-2.55)#19,491 |
| 68. | Meredith | 7.9% | 10.3%(-2.36)#68 | 10.9%(-2.91)#20,193 |
| 69. | Jaffrey | 7.8% | 10.3%(-2.46)#69 | 10.9%(-3.01)#20,424 |
| 70. | Hampton | 7.8% | 10.3%(-2.55)#70 | 10.9%(-3.10)#20,606 |
| 71. | Belmont | 7.6% | 10.3%(-2.71)#71 | 10.9%(-3.26)#20,903 |
| 72. | Epping | 7.5% | 10.3%(-2.80)#72 | 10.9%(-3.34)#21,062 |
| 73. | Henniker | 7.1% | 10.3%(-3.23)#73 | 10.9%(-3.78)#21,844 |
| 74. | Peterborough | 6.9% | 10.3%(-3.40)#74 | 10.9%(-3.95)#22,126 |
| 75. | Hancock | 6.9% | 10.3%(-3.45)#75 | 10.9%(-3.99)#22,215 |
| 76. | North Conway | 6.7% | 10.3%(-3.59)#76 | 10.9%(-4.14)#22,448 |
| 77. | Blodgett Landing | 6.7% | 10.3%(-3.64)#77 | 10.9%(-4.19)#22,565 |
| 78. | Hampton Beach | 6.5% | 10.3%(-3.82)#78 | 10.9%(-4.36)#22,873 |
| 79. | Plymouth | 6.3% | 10.3%(-3.98)#79 | 10.9%(-4.53)#23,112 |
| 80. | Winchester | 6.2% | 10.3%(-4.14)#80 | 10.9%(-4.69)#23,336 |
| 81. | Ashland | 6.0% | 10.3%(-4.32)#81 | 10.9%(-4.86)#23,602 |
| 82. | Walpole | 5.8% | 10.3%(-4.49)#82 | 10.9%(-5.04)#23,844 |
| 83. | Charlestown | 5.8% | 10.3%(-4.55)#83 | 10.9%(-5.10)#23,946 |
| 84. | North Haverhill | 5.6% | 10.3%(-4.70)#84 | 10.9%(-5.25)#24,152 |
| 85. | West Swanzey | 5.5% | 10.3%(-4.76)#85 | 10.9%(-5.31)#24,257 |
| 86. | Greenville | 4.9% | 10.3%(-5.37)#86 | 10.9%(-5.92)#25,018 |
| 87. | Bennington | 4.9% | 10.3%(-5.39)#87 | 10.9%(-5.94)#25,030 |
| 88. | Center Sandwich | 4.5% | 10.3%(-5.76)#88 | 10.9%(-6.31)#25,432 |
| 89. | Colebrook | 4.3% | 10.3%(-6.02)#89 | 10.9%(-6.57)#25,671 |
| 90. | Woodsville | 3.7% | 10.3%(-6.60)#90 | 10.9%(-7.15)#26,225 |
| 91. | Hinsdale | 2.7% | 10.3%(-7.62)#91 | 10.9%(-8.16)#26,955 |
| 92. | Groveton | 2.3% | 10.3%(-8.03)#92 | 10.9%(-8.58)#27,193 |
| 93. | Seabrook Beach | 0.49% | 10.3%(-9.82)#93 | 10.9%(-10.4)#27,771 |
1
Common Questions
What are the Top 10 Cities with the Highest Percentage of Population Employed in Office & Administration in New Hampshire?
Top 10 Cities with the Highest Percentage of Population Employed in Office & Administration in New Hampshire are:
#1
38.7%
#2
23.9%
#3
23.7%
#4
23.5%
#5
20.2%
#6
19.5%
#7
19.3%
#8
18.6%
#9
17.8%
#10
17.4%
What city has the Highest Percentage of Population Employed in Office & Administration in New Hampshire?
Milton Mills has the Highest Percentage of Population Employed in Office & Administration in New Hampshire with 38.7%.
What is the Percentage of Population Employed in Office & Administration in the State of New Hampshire?
Percentage of Population Employed in Office & Administration in New Hampshire is 10.3%.
What is the Percentage of Population Employed in Office & Administration in the United States?
Percentage of Population Employed in Office & Administration in the United States is 10.9%.