Cities with the Highest Percentage of Population Employed in Office & Administration in Mississippi
RELATED REPORTS & OPTIONS
Office & Administration
Mississippi
Compare Cities
Map of Cities with the Highest Percentage of Population Employed in Office & Administration in Mississippi
0.0%
80.0%
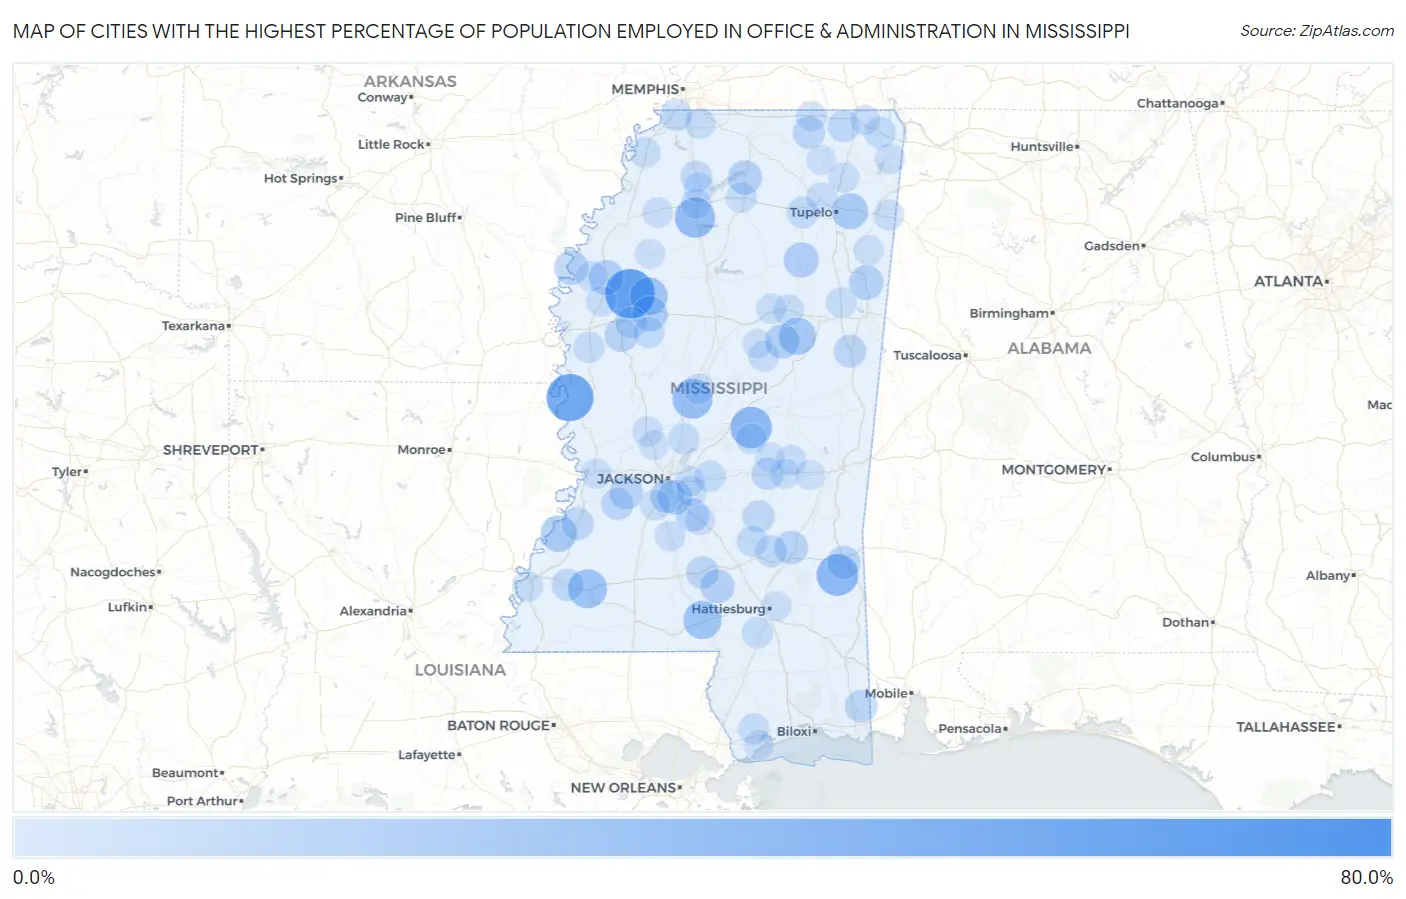
Cities with the Highest Percentage of Population Employed in Office & Administration in Mississippi
| City | % Employed | vs State | vs National | |
| 1. | Valley Park | 75.0% | 10.8% (+64.2)#1 | 10.9% (+64.1)#72 |
| 2. | Doddsville | 63.6% | 10.8% (+52.9)#2 | 10.9% (+52.8)#112 |
| 3. | Mayersville | 57.1% | 10.8% (+46.4)#3 | 10.9% (+46.3)#141 |
| 4. | Redwood | 50.0% | 10.8% (+39.2)#4 | 10.9% (+39.1)#209 |
| 5. | Scott | 50.0% | 10.8% (+39.2)#5 | 10.9% (+39.1)#218 |
| 6. | Tula | 44.2% | 10.8% (+33.4)#6 | 10.9% (+33.3)#308 |
| 7. | Clara | 43.4% | 10.8% (+32.7)#7 | 10.9% (+32.6)#326 |
| 8. | Standing Pine | 42.4% | 10.8% (+31.7)#8 | 10.9% (+31.6)#348 |
| 9. | Mount Pleasant | 40.1% | 10.8% (+29.4)#9 | 10.9% (+29.3)#409 |
| 10. | Pope | 39.4% | 10.8% (+28.6)#10 | 10.9% (+28.5)#434 |
| 11. | Pickens | 38.9% | 10.8% (+28.1)#11 | 10.9% (+28.0)#448 |
| 12. | De Soto | 36.7% | 10.8% (+25.9)#12 | 10.9% (+25.8)#503 |
| 13. | Meadville | 36.4% | 10.8% (+25.7)#13 | 10.9% (+25.6)#520 |
| 14. | Foxworth | 34.6% | 10.8% (+23.9)#14 | 10.9% (+23.8)#590 |
| 15. | Schlater | 33.3% | 10.8% (+22.6)#15 | 10.9% (+22.5)#645 |
| 16. | Sturgis | 31.5% | 10.8% (+20.8)#16 | 10.9% (+20.7)#764 |
| 17. | Alcorn State University | 29.3% | 10.8% (+18.5)#17 | 10.9% (+18.4)#894 |
| 18. | Mooreville | 29.3% | 10.8% (+18.5)#18 | 10.9% (+18.4)#895 |
| 19. | Mississippi Valley State University | 27.6% | 10.8% (+16.8)#19 | 10.9% (+16.7)#1,052 |
| 20. | Houston | 26.5% | 10.8% (+15.8)#20 | 10.9% (+15.7)#1,148 |
| 21. | Renova | 26.5% | 10.8% (+15.8)#21 | 10.9% (+15.7)#1,152 |
| 22. | New Hamilton | 25.2% | 10.8% (+14.4)#22 | 10.9% (+14.3)#1,286 |
| 23. | Ackerman | 25.1% | 10.8% (+14.4)#23 | 10.9% (+14.3)#1,288 |
| 24. | Florence | 24.8% | 10.8% (+14.1)#24 | 10.9% (+14.0)#1,346 |
| 25. | Rosedale | 24.8% | 10.8% (+14.0)#25 | 10.9% (+13.9)#1,348 |
| 26. | Abbeville | 24.3% | 10.8% (+13.6)#26 | 10.9% (+13.5)#1,415 |
| 27. | Cleary | 24.1% | 10.8% (+13.3)#27 | 10.9% (+13.2)#1,446 |
| 28. | Bassfield | 23.9% | 10.8% (+13.2)#28 | 10.9% (+13.1)#1,474 |
| 29. | Inverness | 23.6% | 10.8% (+12.9)#29 | 10.9% (+12.8)#1,526 |
| 30. | Sharon | 22.6% | 10.8% (+11.9)#30 | 10.9% (+11.8)#1,703 |
| 31. | Waynesboro | 22.4% | 10.8% (+11.7)#31 | 10.9% (+11.6)#1,763 |
| 32. | Learned | 22.2% | 10.8% (+11.5)#32 | 10.9% (+11.4)#1,806 |
| 33. | Braxton | 21.9% | 10.8% (+11.2)#33 | 10.9% (+11.1)#1,862 |
| 34. | Rena Lara | 21.6% | 10.8% (+10.9)#34 | 10.9% (+10.8)#1,926 |
| 35. | Prentiss | 20.7% | 10.8% (+9.94)#35 | 10.9% (+9.83)#2,187 |
| 36. | Brooksville | 20.6% | 10.8% (+9.82)#36 | 10.9% (+9.72)#2,231 |
| 37. | Big Point | 20.5% | 10.8% (+9.73)#37 | 10.9% (+9.62)#2,256 |
| 38. | Falkner | 20.1% | 10.8% (+9.33)#38 | 10.9% (+9.23)#2,380 |
| 39. | Biggersville | 20.0% | 10.8% (+9.25)#39 | 10.9% (+9.14)#2,423 |
| 40. | Port Gibson | 19.9% | 10.8% (+9.19)#40 | 10.9% (+9.09)#2,453 |
| 41. | Lake | 19.9% | 10.8% (+9.16)#41 | 10.9% (+9.05)#2,463 |
| 42. | Utica | 19.9% | 10.8% (+9.13)#42 | 10.9% (+9.02)#2,471 |
| 43. | Bovina | 19.6% | 10.8% (+8.87)#43 | 10.9% (+8.77)#2,559 |
| 44. | Soso | 19.4% | 10.8% (+8.62)#44 | 10.9% (+8.51)#2,650 |
| 45. | Kossuth | 19.4% | 10.8% (+8.60)#45 | 10.9% (+8.50)#2,661 |
| 46. | Sylvarena | 19.2% | 10.8% (+8.48)#46 | 10.9% (+8.37)#2,712 |
| 47. | Roxie | 19.0% | 10.8% (+8.20)#47 | 10.9% (+8.10)#2,822 |
| 48. | Lynchburg | 18.8% | 10.8% (+8.07)#48 | 10.9% (+7.96)#2,902 |
| 49. | Pontotoc | 18.8% | 10.8% (+8.03)#49 | 10.9% (+7.93)#2,919 |
| 50. | Moorhead | 18.4% | 10.8% (+7.67)#50 | 10.9% (+7.57)#3,119 |
| 51. | Burnsville | 18.0% | 10.8% (+7.23)#51 | 10.9% (+7.12)#3,353 |
| 52. | Como | 17.9% | 10.8% (+7.10)#52 | 10.9% (+7.00)#3,421 |
| 53. | Taylorsville | 17.4% | 10.8% (+6.64)#53 | 10.9% (+6.54)#3,705 |
| 54. | Pelahatchie | 17.4% | 10.8% (+6.61)#54 | 10.9% (+6.51)#3,729 |
| 55. | Canton | 17.3% | 10.8% (+6.53)#55 | 10.9% (+6.43)#3,778 |
| 56. | Purvis | 17.3% | 10.8% (+6.51)#56 | 10.9% (+6.41)#3,795 |
| 57. | Arcola | 17.1% | 10.8% (+6.32)#57 | 10.9% (+6.22)#3,925 |
| 58. | Morgan City | 16.9% | 10.8% (+6.17)#58 | 10.9% (+6.07)#4,033 |
| 59. | Eudora | 16.9% | 10.8% (+6.14)#59 | 10.9% (+6.04)#4,048 |
| 60. | Tunica | 16.8% | 10.8% (+6.02)#60 | 10.9% (+5.92)#4,123 |
| 61. | Mathiston | 16.8% | 10.8% (+6.01)#61 | 10.9% (+5.91)#4,128 |
| 62. | Robinhood | 16.7% | 10.8% (+5.91)#62 | 10.9% (+5.81)#4,178 |
| 63. | Mccool | 16.7% | 10.8% (+5.91)#63 | 10.9% (+5.81)#4,228 |
| 64. | University | 16.6% | 10.8% (+5.86)#64 | 10.9% (+5.75)#4,260 |
| 65. | Kiln | 16.6% | 10.8% (+5.82)#65 | 10.9% (+5.71)#4,288 |
| 66. | Tremont | 16.5% | 10.8% (+5.77)#66 | 10.9% (+5.67)#4,330 |
| 67. | West Point | 16.5% | 10.8% (+5.73)#67 | 10.9% (+5.63)#4,350 |
| 68. | Cloverdale | 16.5% | 10.8% (+5.73)#68 | 10.9% (+5.62)#4,352 |
| 69. | Bridgetown | 16.4% | 10.8% (+5.60)#69 | 10.9% (+5.49)#4,461 |
| 70. | Baldwyn | 16.2% | 10.8% (+5.42)#70 | 10.9% (+5.32)#4,621 |
| 71. | Walnut Grove | 16.0% | 10.8% (+5.30)#71 | 10.9% (+5.19)#4,732 |
| 72. | Walnut | 15.9% | 10.8% (+5.16)#72 | 10.9% (+5.05)#4,869 |
| 73. | Goodman | 15.9% | 10.8% (+5.10)#73 | 10.9% (+5.00)#4,933 |
| 74. | Terry | 15.7% | 10.8% (+4.94)#74 | 10.9% (+4.83)#5,094 |
| 75. | Sardis | 15.6% | 10.8% (+4.88)#75 | 10.9% (+4.77)#5,154 |
| 76. | Batesville | 15.5% | 10.8% (+4.78)#76 | 10.9% (+4.68)#5,255 |
| 77. | Shaw | 15.5% | 10.8% (+4.72)#77 | 10.9% (+4.62)#5,331 |
| 78. | Sherman | 15.5% | 10.8% (+4.71)#78 | 10.9% (+4.60)#5,349 |
| 79. | Pace | 15.4% | 10.8% (+4.63)#79 | 10.9% (+4.53)#5,436 |
| 80. | Tishomingo | 15.3% | 10.8% (+4.56)#80 | 10.9% (+4.46)#5,522 |
| 81. | Marks | 15.3% | 10.8% (+4.51)#81 | 10.9% (+4.40)#5,587 |
| 82. | Decatur | 15.1% | 10.8% (+4.36)#82 | 10.9% (+4.25)#5,736 |
| 83. | Beechwood | 15.1% | 10.8% (+4.35)#83 | 10.9% (+4.25)#5,740 |
| 84. | Bentonia | 15.0% | 10.8% (+4.29)#84 | 10.9% (+4.19)#5,818 |
| 85. | Georgetown | 15.0% | 10.8% (+4.25)#85 | 10.9% (+4.14)#5,873 |
| 86. | Farmington | 14.9% | 10.8% (+4.18)#86 | 10.9% (+4.08)#5,944 |
| 87. | New Site | 14.9% | 10.8% (+4.17)#87 | 10.9% (+4.07)#5,951 |
| 88. | D Lo | 14.9% | 10.8% (+4.13)#88 | 10.9% (+4.02)#6,005 |
| 89. | Eupora | 14.8% | 10.8% (+4.04)#89 | 10.9% (+3.94)#6,114 |
| 90. | Flora | 14.7% | 10.8% (+3.92)#90 | 10.9% (+3.82)#6,265 |
| 91. | Hatley | 14.6% | 10.8% (+3.88)#91 | 10.9% (+3.78)#6,324 |
| 92. | Petal | 14.6% | 10.8% (+3.87)#92 | 10.9% (+3.77)#6,345 |
| 93. | Newton | 14.6% | 10.8% (+3.81)#93 | 10.9% (+3.71)#6,421 |
| 94. | French Camp | 14.4% | 10.8% (+3.69)#94 | 10.9% (+3.59)#6,594 |
| 95. | Waveland | 14.4% | 10.8% (+3.66)#95 | 10.9% (+3.56)#6,627 |
| 96. | Brandon | 14.3% | 10.8% (+3.56)#96 | 10.9% (+3.46)#6,740 |
| 97. | Webb | 14.3% | 10.8% (+3.53)#97 | 10.9% (+3.43)#6,778 |
| 98. | Dumas | 14.3% | 10.8% (+3.53)#98 | 10.9% (+3.43)#6,786 |
| 99. | Chunky | 14.3% | 10.8% (+3.53)#99 | 10.9% (+3.43)#6,791 |
| 100. | Conehatta | 14.2% | 10.8% (+3.49)#100 | 10.9% (+3.39)#6,881 |
Common Questions
What are the Top 10 Cities with the Highest Percentage of Population Employed in Office & Administration in Mississippi?
Top 10 Cities with the Highest Percentage of Population Employed in Office & Administration in Mississippi are:
#1
63.6%
#2
57.1%
#3
43.4%
#4
42.4%
#5
39.4%
#6
38.9%
#7
36.4%
#8
34.6%
#9
33.3%
#10
31.5%
What city has the Highest Percentage of Population Employed in Office & Administration in Mississippi?
Doddsville has the Highest Percentage of Population Employed in Office & Administration in Mississippi with 63.6%.
What is the Percentage of Population Employed in Office & Administration in the State of Mississippi?
Percentage of Population Employed in Office & Administration in Mississippi is 10.8%.
What is the Percentage of Population Employed in Office & Administration in the United States?
Percentage of Population Employed in Office & Administration in the United States is 10.9%.