Cities with the Highest Percentage of Population Employed in Office & Administration in Virginia
RELATED REPORTS & OPTIONS
Office & Administration
Virginia
Compare Cities
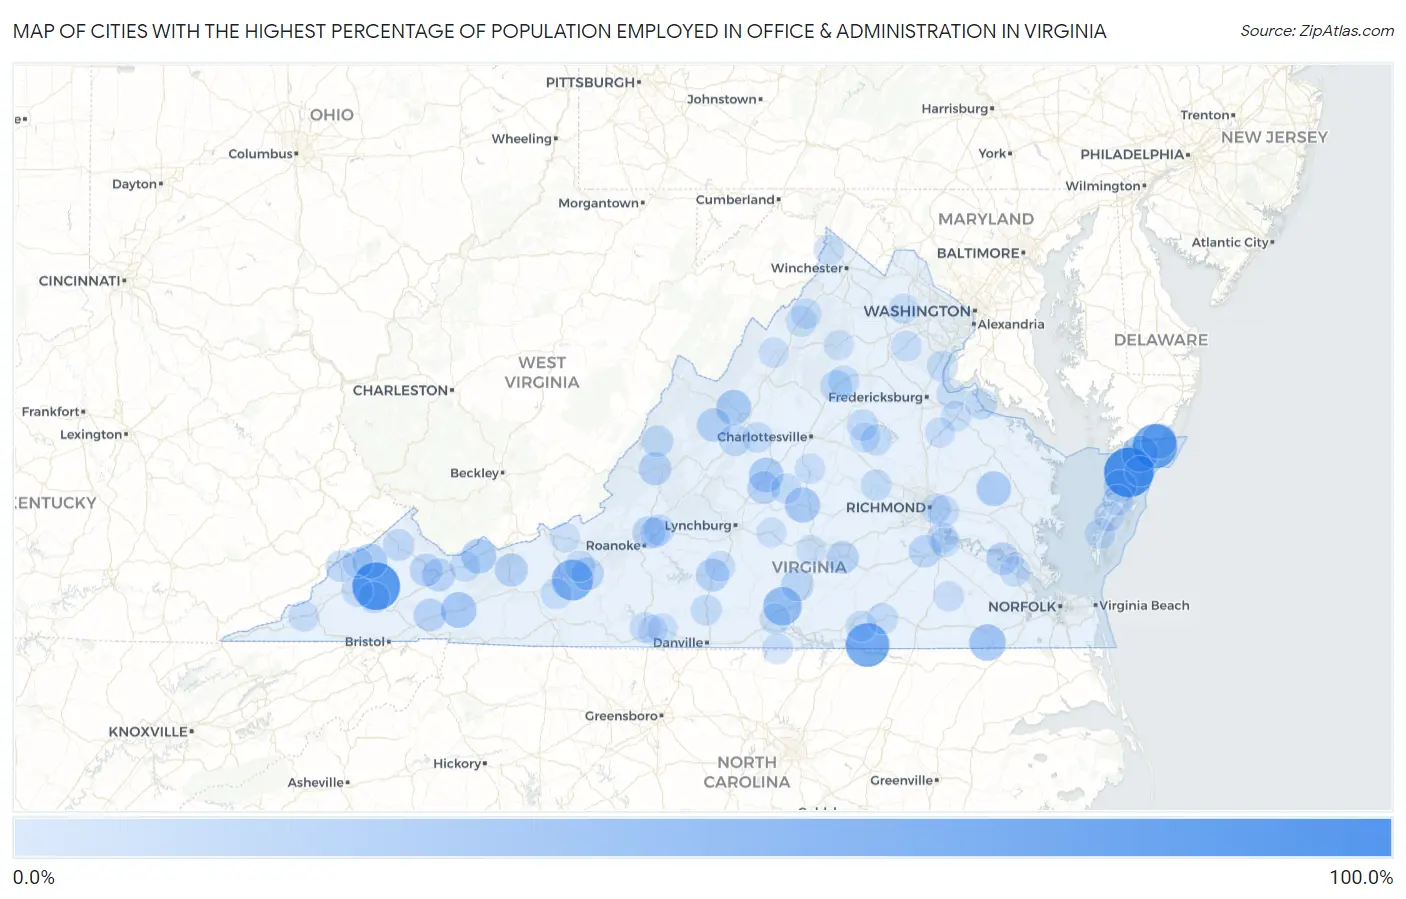
Map of Cities with the Highest Percentage of Population Employed in Office & Administration in Virginia
0.0%
100.0%
Cities with the Highest Percentage of Population Employed in Office & Administration in Virginia
| City | % Employed | vs State | vs National | |
| 1. | Lee Mont | 100.0% | 10.0%(+90.0)#1 | 10.9%(+89.1)#9 |
| 2. | Gore | 100.0% | 10.0%(+90.0)#2 | 10.9%(+89.1)#28 |
| 3. | Dante | 91.7% | 10.0%(+81.7)#3 | 10.9%(+80.8)#57 |
| 4. | Horntown | 78.2% | 10.0%(+68.2)#4 | 10.9%(+67.3)#65 |
| 5. | Ebony | 74.1% | 10.0%(+64.1)#5 | 10.9%(+63.2)#75 |
| 6. | Brandy Station | 72.0% | 10.0%(+62.0)#6 | 10.9%(+61.1)#79 |
| 7. | Snowville | 63.0% | 10.0%(+53.0)#7 | 10.9%(+52.1)#113 |
| 8. | Clover | 51.7% | 10.0%(+41.7)#8 | 10.9%(+40.8)#193 |
| 9. | Southampton Meadows | 42.6% | 10.0%(+32.6)#9 | 10.9%(+31.7)#344 |
| 10. | Makemie Park | 42.4% | 10.0%(+32.4)#10 | 10.9%(+31.5)#351 |
| 11. | Mcmullin | 39.2% | 10.0%(+29.2)#11 | 10.9%(+28.3)#439 |
| 12. | Captains Cove | 38.2% | 10.0%(+28.2)#12 | 10.9%(+27.3)#466 |
| 13. | Dinwiddie | 38.0% | 10.0%(+28.0)#13 | 10.9%(+27.2)#472 |
| 14. | Buckingham Courthouse | 37.6% | 10.0%(+27.6)#14 | 10.9%(+26.7)#478 |
| 15. | Churchville | 37.5% | 10.0%(+27.5)#15 | 10.9%(+26.6)#484 |
| 16. | Clinchco | 36.2% | 10.0%(+26.2)#16 | 10.9%(+25.3)#532 |
| 17. | Springville | 35.8% | 10.0%(+25.8)#17 | 10.9%(+24.9)#543 |
| 18. | Lovingston | 35.3% | 10.0%(+25.3)#18 | 10.9%(+24.4)#558 |
| 19. | King And Queen Court House | 35.3% | 10.0%(+25.3)#19 | 10.9%(+24.4)#564 |
| 20. | Upperville | 34.1% | 10.0%(+24.2)#20 | 10.9%(+23.3)#611 |
| 21. | Jewell Ridge | 33.3% | 10.0%(+23.3)#21 | 10.9%(+22.5)#666 |
| 22. | Augusta Springs | 30.4% | 10.0%(+20.4)#22 | 10.9%(+19.5)#824 |
| 23. | Bland | 28.8% | 10.0%(+18.8)#23 | 10.9%(+17.9)#936 |
| 24. | Motley | 28.7% | 10.0%(+18.8)#24 | 10.9%(+17.9)#942 |
| 25. | Selma | 28.2% | 10.0%(+18.2)#25 | 10.9%(+17.3)#986 |
| 26. | Claypool Hill | 28.0% | 10.0%(+18.1)#26 | 10.9%(+17.2)#998 |
| 27. | Emory | 27.8% | 10.0%(+17.8)#27 | 10.9%(+16.9)#1,025 |
| 28. | Arrington | 27.7% | 10.0%(+17.7)#28 | 10.9%(+16.9)#1,033 |
| 29. | Raven | 27.6% | 10.0%(+17.6)#29 | 10.9%(+16.7)#1,045 |
| 30. | Riner | 27.4% | 10.0%(+17.4)#30 | 10.9%(+16.6)#1,068 |
| 31. | Savageville | 27.3% | 10.0%(+17.3)#31 | 10.9%(+16.5)#1,074 |
| 32. | Burkeville | 27.1% | 10.0%(+17.1)#32 | 10.9%(+16.3)#1,093 |
| 33. | Scotland | 27.1% | 10.0%(+17.1)#33 | 10.9%(+16.2)#1,096 |
| 34. | Cloverdale | 26.3% | 10.0%(+16.4)#34 | 10.9%(+15.5)#1,167 |
| 35. | Matoaca | 26.3% | 10.0%(+16.3)#35 | 10.9%(+15.5)#1,168 |
| 36. | Drakes Branch | 26.3% | 10.0%(+16.3)#36 | 10.9%(+15.5)#1,169 |
| 37. | Falls Mills | 25.7% | 10.0%(+15.7)#37 | 10.9%(+14.9)#1,224 |
| 38. | Hilltown | 25.5% | 10.0%(+15.5)#38 | 10.9%(+14.7)#1,251 |
| 39. | Port Republic | 24.4% | 10.0%(+14.4)#39 | 10.9%(+13.5)#1,402 |
| 40. | Madison | 23.7% | 10.0%(+13.7)#40 | 10.9%(+12.9)#1,503 |
| 41. | Greenville | 23.6% | 10.0%(+13.6)#41 | 10.9%(+12.7)#1,534 |
| 42. | Pound | 23.0% | 10.0%(+13.0)#42 | 10.9%(+12.1)#1,641 |
| 43. | Grundy | 22.9% | 10.0%(+12.9)#43 | 10.9%(+12.0)#1,653 |
| 44. | St Paul | 22.9% | 10.0%(+12.9)#44 | 10.9%(+12.0)#1,659 |
| 45. | Hot Springs | 22.6% | 10.0%(+12.6)#45 | 10.9%(+11.8)#1,704 |
| 46. | Stewartsville | 22.6% | 10.0%(+12.6)#46 | 10.9%(+11.7)#1,724 |
| 47. | Brightwood | 22.0% | 10.0%(+12.0)#47 | 10.9%(+11.2)#1,843 |
| 48. | Colonial Beach | 21.3% | 10.0%(+11.3)#48 | 10.9%(+10.4)#2,022 |
| 49. | Blue Ridge Shores | 21.2% | 10.0%(+11.2)#49 | 10.9%(+10.4)#2,033 |
| 50. | Sandston | 21.1% | 10.0%(+11.1)#50 | 10.9%(+10.3)#2,066 |
| 51. | Quantico Base | 21.0% | 10.0%(+11.1)#51 | 10.9%(+10.2)#2,095 |
| 52. | Goochland | 20.9% | 10.0%(+11.0)#52 | 10.9%(+10.1)#2,116 |
| 53. | Plum Creek | 20.9% | 10.0%(+10.9)#53 | 10.9%(+10.1)#2,122 |
| 54. | Meadowview | 20.8% | 10.0%(+10.8)#54 | 10.9%(+9.97)#2,151 |
| 55. | Mineral | 20.7% | 10.0%(+10.7)#55 | 10.9%(+9.88)#2,178 |
| 56. | Lawrenceville | 20.5% | 10.0%(+10.5)#56 | 10.9%(+9.65)#2,253 |
| 57. | Blue Ridge | 20.3% | 10.0%(+10.4)#57 | 10.9%(+9.48)#2,298 |
| 58. | Brodnax | 20.1% | 10.0%(+10.1)#58 | 10.9%(+9.24)#2,373 |
| 59. | Coeburn | 20.1% | 10.0%(+10.1)#59 | 10.9%(+9.22)#2,381 |
| 60. | Allisonia | 20.0% | 10.0%(+10.0)#60 | 10.9%(+9.14)#2,434 |
| 61. | Chatham | 20.0% | 10.0%(+9.98)#61 | 10.9%(+9.11)#2,449 |
| 62. | Tazewell | 19.7% | 10.0%(+9.72)#62 | 10.9%(+8.85)#2,532 |
| 63. | Fieldale | 19.5% | 10.0%(+9.51)#63 | 10.9%(+8.64)#2,612 |
| 64. | Edinburg | 19.3% | 10.0%(+9.33)#64 | 10.9%(+8.46)#2,675 |
| 65. | Lyndhurst | 19.1% | 10.0%(+9.12)#65 | 10.9%(+8.25)#2,761 |
| 66. | Altavista | 19.0% | 10.0%(+9.00)#66 | 10.9%(+8.13)#2,809 |
| 67. | Scottsburg | 19.0% | 10.0%(+8.98)#67 | 10.9%(+8.11)#2,818 |
| 68. | Catlett | 19.0% | 10.0%(+8.97)#68 | 10.9%(+8.10)#2,823 |
| 69. | Clintwood | 18.9% | 10.0%(+8.95)#69 | 10.9%(+8.08)#2,832 |
| 70. | Virgilina | 18.8% | 10.0%(+8.86)#70 | 10.9%(+7.98)#2,890 |
| 71. | Dryden | 18.8% | 10.0%(+8.76)#71 | 10.9%(+7.89)#2,931 |
| 72. | Woodstock | 18.6% | 10.0%(+8.66)#72 | 10.9%(+7.79)#2,995 |
| 73. | Gargatha | 18.5% | 10.0%(+8.53)#73 | 10.9%(+7.66)#3,065 |
| 74. | Hiltons | 18.5% | 10.0%(+8.53)#74 | 10.9%(+7.66)#3,066 |
| 75. | Yogaville | 18.5% | 10.0%(+8.48)#75 | 10.9%(+7.61)#3,105 |
| 76. | Eastville | 18.5% | 10.0%(+8.47)#76 | 10.9%(+7.60)#3,111 |
| 77. | Rushmere | 18.4% | 10.0%(+8.45)#77 | 10.9%(+7.58)#3,116 |
| 78. | Enon | 18.4% | 10.0%(+8.45)#78 | 10.9%(+7.58)#3,117 |
| 79. | Painter | 18.3% | 10.0%(+8.29)#79 | 10.9%(+7.42)#3,191 |
| 80. | Montrose | 18.1% | 10.0%(+8.08)#80 | 10.9%(+7.21)#3,304 |
| 81. | Broadway | 17.9% | 10.0%(+7.93)#81 | 10.9%(+7.06)#3,392 |
| 82. | Laymantown | 17.9% | 10.0%(+7.88)#82 | 10.9%(+7.01)#3,418 |
| 83. | Scottsville | 17.9% | 10.0%(+7.87)#83 | 10.9%(+7.00)#3,422 |
| 84. | Singers Glen | 17.6% | 10.0%(+7.66)#84 | 10.9%(+6.79)#3,539 |
| 85. | Sussex | 17.6% | 10.0%(+7.61)#85 | 10.9%(+6.74)#3,579 |
| 86. | Eggleston | 17.5% | 10.0%(+7.51)#86 | 10.9%(+6.64)#3,638 |
| 87. | Laurel Park | 17.3% | 10.0%(+7.35)#87 | 10.9%(+6.48)#3,743 |
| 88. | Lake Holiday | 17.3% | 10.0%(+7.32)#88 | 10.9%(+6.45)#3,757 |
| 89. | Fairview Beach | 17.3% | 10.0%(+7.28)#89 | 10.9%(+6.41)#3,793 |
| 90. | Port Royal | 17.2% | 10.0%(+7.26)#90 | 10.9%(+6.38)#3,812 |
| 91. | Nassawadox | 17.1% | 10.0%(+7.13)#91 | 10.9%(+6.26)#3,894 |
| 92. | Bowling Green | 17.0% | 10.0%(+7.06)#92 | 10.9%(+6.19)#3,943 |
| 93. | Bull Run Mountain Estates | 17.0% | 10.0%(+7.01)#93 | 10.9%(+6.14)#3,978 |
| 94. | Hampden Sydney | 17.0% | 10.0%(+6.99)#94 | 10.9%(+6.11)#3,993 |
| 95. | Louisa | 17.0% | 10.0%(+6.98)#95 | 10.9%(+6.11)#3,996 |
| 96. | Sperryville | 16.9% | 10.0%(+6.94)#96 | 10.9%(+6.07)#4,032 |
| 97. | Pembroke | 16.5% | 10.0%(+6.56)#97 | 10.9%(+5.69)#4,310 |
| 98. | Appomattox | 16.5% | 10.0%(+6.54)#98 | 10.9%(+5.67)#4,328 |
| 99. | Martinsville | 16.5% | 10.0%(+6.47)#99 | 10.9%(+5.60)#4,368 |
| 100. | Hopewell | 16.3% | 10.0%(+6.31)#100 | 10.9%(+5.44)#4,511 |
Common Questions
What are the Top 10 Cities with the Highest Percentage of Population Employed in Office & Administration in Virginia?
Top 10 Cities with the Highest Percentage of Population Employed in Office & Administration in Virginia are:
#1
100.0%
#2
91.7%
#3
78.2%
#4
74.1%
#5
63.0%
#6
51.7%
#7
42.6%
#8
42.4%
#9
39.2%
#10
38.2%
What city has the Highest Percentage of Population Employed in Office & Administration in Virginia?
Lee Mont has the Highest Percentage of Population Employed in Office & Administration in Virginia with 100.0%.
What is the Percentage of Population Employed in Office & Administration in the State of Virginia?
Percentage of Population Employed in Office & Administration in Virginia is 10.0%.
What is the Percentage of Population Employed in Office & Administration in the United States?
Percentage of Population Employed in Office & Administration in the United States is 10.9%.