Zip Codes with the Highest Percentage of Population Employed in Office & Administration in San Jacinto, CA
RELATED REPORTS & OPTIONS
Office & Administration
San Jacinto
Compare Zip Codes
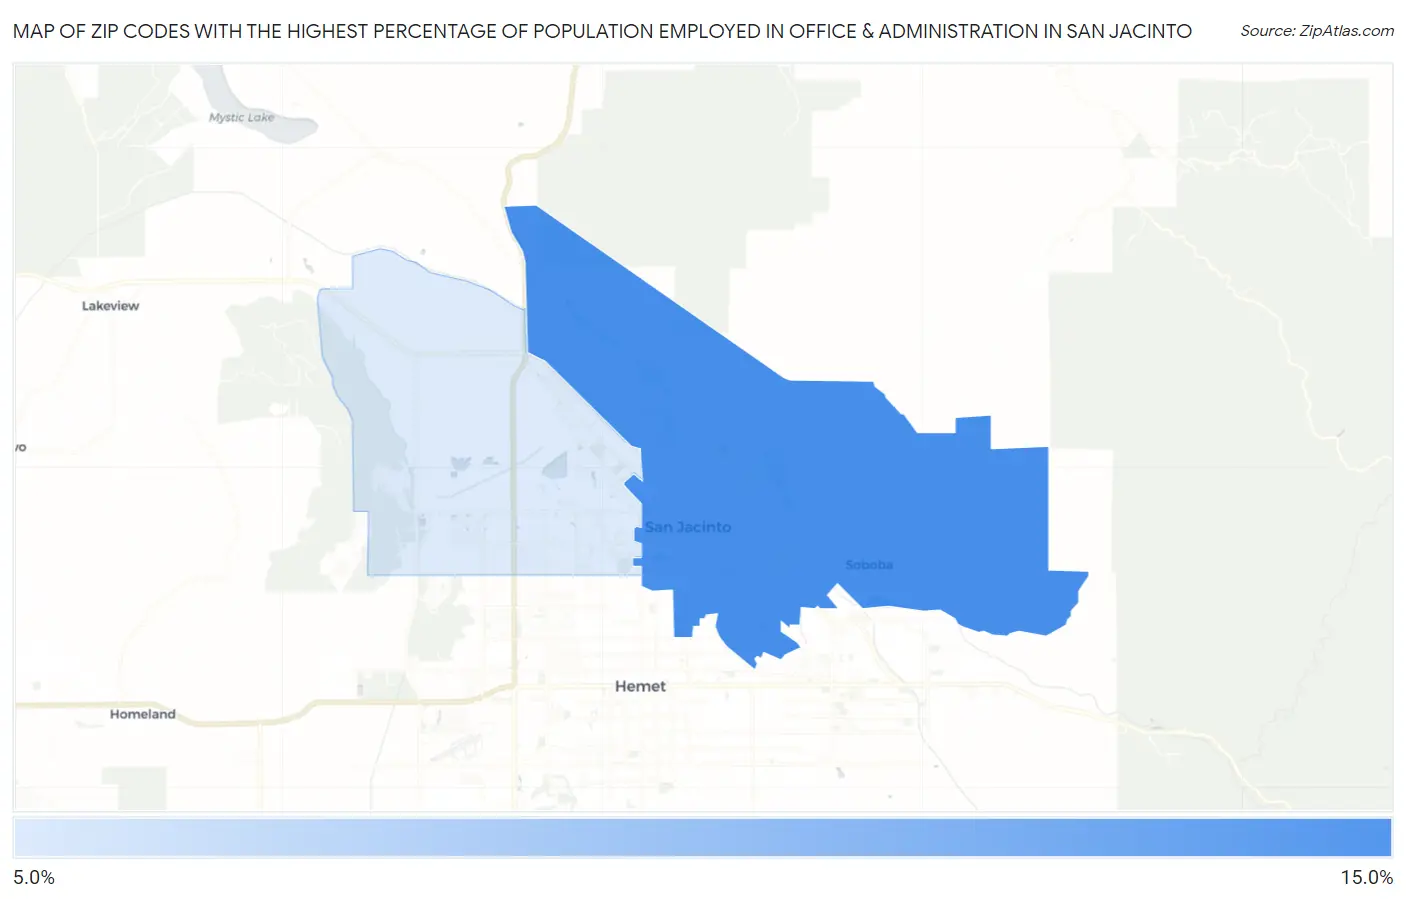
Map of Zip Codes with the Highest Percentage of Population Employed in Office & Administration in San Jacinto
7.2%
11.4%
Zip Codes with the Highest Percentage of Population Employed in Office & Administration in San Jacinto, CA
| Zip Code | % Employed | vs State | vs National | |
| 1. | 92583 | 11.4% | 10.5%(+0.857)#584 | 10.9%(+0.504)#12,686 |
| 2. | 92582 | 7.2% | 10.5%(-3.34)#1,267 | 10.9%(-3.69)#24,895 |
1
Common Questions
What are the Top Zip Codes with the Highest Percentage of Population Employed in Office & Administration in San Jacinto, CA?
Top Zip Codes with the Highest Percentage of Population Employed in Office & Administration in San Jacinto, CA are:
What zip code has the Highest Percentage of Population Employed in Office & Administration in San Jacinto, CA?
92583 has the Highest Percentage of Population Employed in Office & Administration in San Jacinto, CA with 11.4%.
What is the Percentage of Population Employed in Office & Administration in San Jacinto, CA?
Percentage of Population Employed in Office & Administration in San Jacinto is 9.2%.
What is the Percentage of Population Employed in Office & Administration in California?
Percentage of Population Employed in Office & Administration in California is 10.5%.
What is the Percentage of Population Employed in Office & Administration in the United States?
Percentage of Population Employed in Office & Administration in the United States is 10.9%.