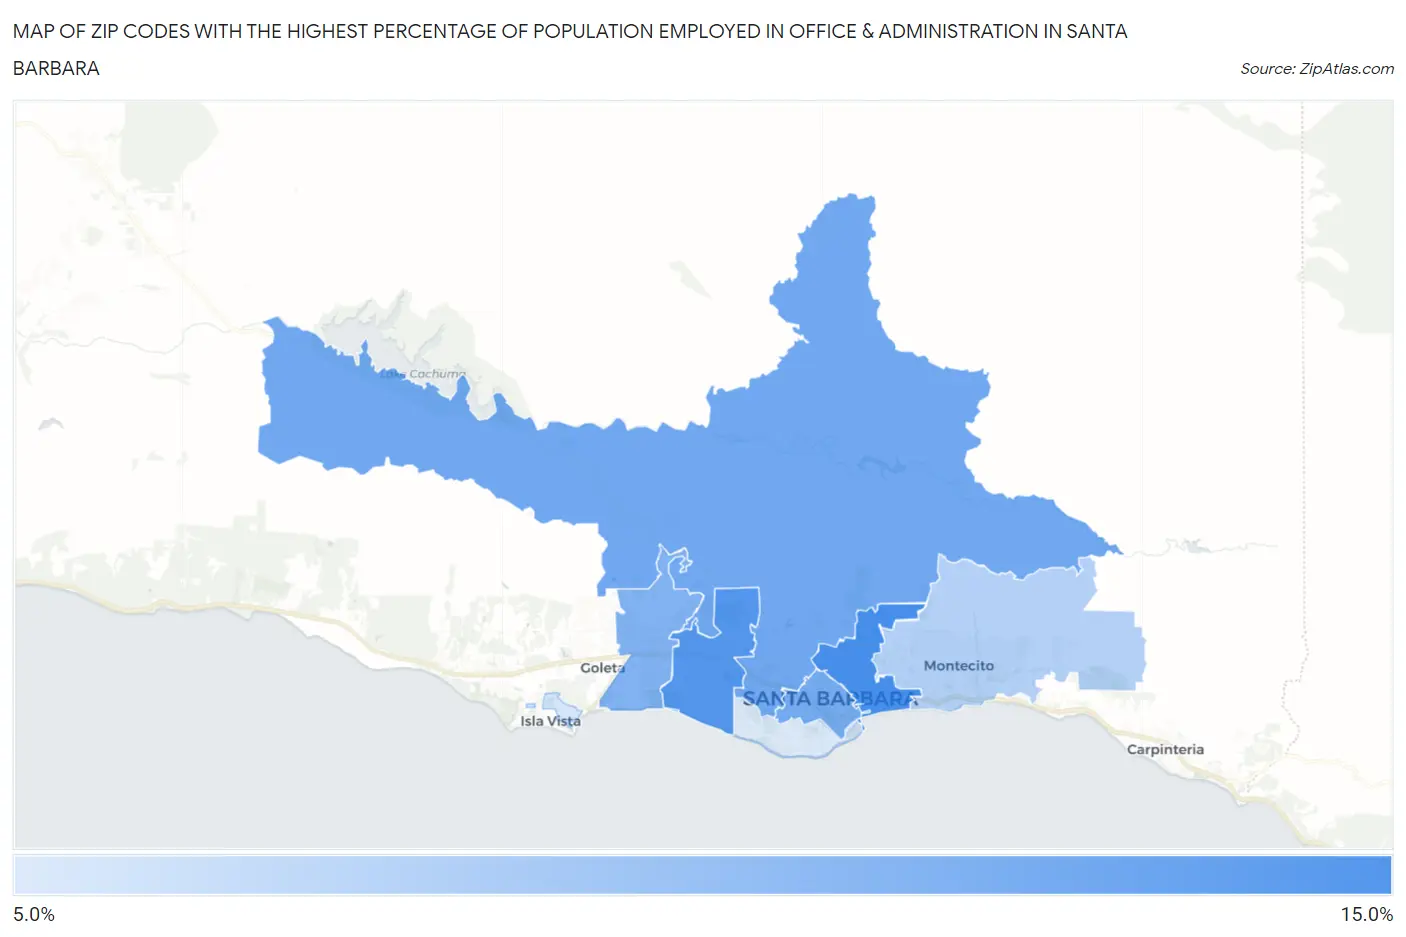
Zip Codes with the Highest Percentage of Population Employed in Office & Administration in Santa Barbara, CA
RELATED REPORTS & OPTIONS
Office & Administration
Santa Barbara
Compare Zip Codes
Map of Zip Codes with the Highest Percentage of Population Employed in Office & Administration in Santa Barbara
5.9%
11.5%

Zip Codes with the Highest Percentage of Population Employed in Office & Administration in Santa Barbara, CA
| Zip Code | % Employed | vs State | vs National | |
| 1. | 93103 | 11.5% | 10.5%(+0.971)#567 | 10.9%(+0.618)#12,309 |
| 2. | 93110 | 11.0% | 10.5%(+0.457)#661 | 10.9%(+0.104)#13,959 |
| 3. | 93105 | 9.9% | 10.5%(-0.590)#873 | 10.9%(-0.942)#17,403 |
| 4. | 93101 | 9.7% | 10.5%(-0.791)#903 | 10.9%(-1.14)#18,022 |
| 5. | 93111 | 9.3% | 10.5%(-1.18)#972 | 10.9%(-1.54)#19,320 |
| 6. | 93108 | 7.4% | 10.5%(-3.07)#1,238 | 10.9%(-3.42)#24,318 |
| 7. | 93106 | 6.1% | 10.5%(-4.39)#1,361 | 10.9%(-4.74)#26,676 |
| 8. | 93109 | 5.9% | 10.5%(-4.60)#1,385 | 10.9%(-4.95)#26,982 |
1
Common Questions
What are the Top 5 Zip Codes with the Highest Percentage of Population Employed in Office & Administration in Santa Barbara, CA?
Top 5 Zip Codes with the Highest Percentage of Population Employed in Office & Administration in Santa Barbara, CA are:
What zip code has the Highest Percentage of Population Employed in Office & Administration in Santa Barbara, CA?
93103 has the Highest Percentage of Population Employed in Office & Administration in Santa Barbara, CA with 11.5%.
What is the Percentage of Population Employed in Office & Administration in Santa Barbara, CA?
Percentage of Population Employed in Office & Administration in Santa Barbara is 9.6%.
What is the Percentage of Population Employed in Office & Administration in California?
Percentage of Population Employed in Office & Administration in California is 10.5%.
What is the Percentage of Population Employed in Office & Administration in the United States?
Percentage of Population Employed in Office & Administration in the United States is 10.9%.