Cities with the Highest Percentage of Population Employed in Office & Administration in Indiana
RELATED REPORTS & OPTIONS
Office & Administration
Indiana
Compare Cities
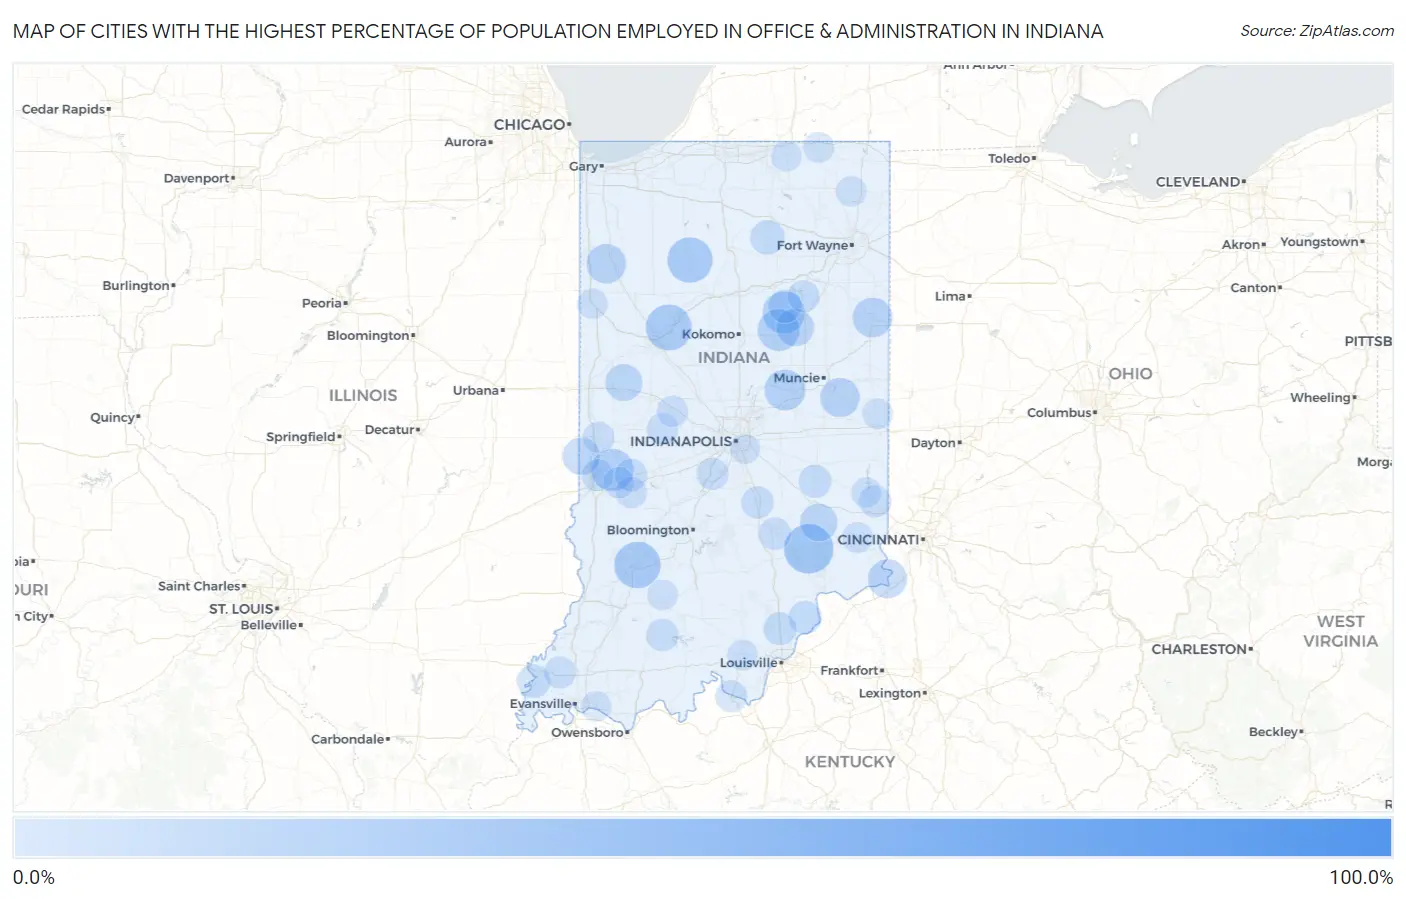
Map of Cities with the Highest Percentage of Population Employed in Office & Administration in Indiana
0.0%
100.0%
Cities with the Highest Percentage of Population Employed in Office & Administration in Indiana
| City | % Employed | vs State | vs National | |
| 1. | Jerome | 100.0% | 11.0%(+89.0)#1 | 10.9%(+89.1)#31 |
| 2. | Saline | 100.0% | 11.0%(+89.0)#2 | 10.9%(+89.1)#50 |
| 3. | Taswell | 75.0% | 11.0%(+64.0)#3 | 10.9%(+64.1)#73 |
| 4. | Lamb | 71.2% | 11.0%(+60.2)#4 | 10.9%(+60.3)#83 |
| 5. | Vicksburg | 69.0% | 11.0%(+58.0)#5 | 10.9%(+58.1)#94 |
| 6. | Hobbs | 60.4% | 11.0%(+49.4)#6 | 10.9%(+49.6)#125 |
| 7. | Buckskin | 57.1% | 11.0%(+46.2)#7 | 10.9%(+46.3)#143 |
| 8. | Brownsville | 55.6% | 11.0%(+44.6)#8 | 10.9%(+44.7)#156 |
| 9. | London | 50.0% | 11.0%(+39.0)#9 | 10.9%(+39.1)#212 |
| 10. | Grayford | 46.7% | 11.0%(+35.7)#10 | 10.9%(+35.8)#264 |
| 11. | Hashtown | 45.0% | 11.0%(+34.0)#11 | 10.9%(+34.1)#295 |
| 12. | Butlerville | 44.4% | 11.0%(+33.5)#12 | 10.9%(+33.6)#301 |
| 13. | Ora | 42.5% | 11.0%(+31.5)#13 | 10.9%(+31.6)#347 |
| 14. | Solsberry | 41.5% | 11.0%(+30.5)#14 | 10.9%(+30.6)#374 |
| 15. | Newberry | 40.4% | 11.0%(+29.4)#15 | 10.9%(+29.6)#402 |
| 16. | Scircleville | 40.3% | 11.0%(+29.3)#16 | 10.9%(+29.4)#407 |
| 17. | Cree Lake | 39.7% | 11.0%(+28.8)#17 | 10.9%(+28.9)#427 |
| 18. | Americus | 39.7% | 11.0%(+28.7)#18 | 10.9%(+28.8)#429 |
| 19. | Star City | 38.9% | 11.0%(+27.9)#19 | 10.9%(+28.0)#444 |
| 20. | Brimfield | 37.3% | 11.0%(+26.4)#20 | 10.9%(+26.5)#488 |
| 21. | Fontanet | 35.1% | 11.0%(+24.1)#21 | 10.9%(+24.2)#573 |
| 22. | Jalapa | 35.0% | 11.0%(+24.0)#22 | 10.9%(+24.1)#580 |
| 23. | Young America | 34.8% | 11.0%(+23.8)#23 | 10.9%(+23.9)#584 |
| 24. | Herbst | 34.6% | 11.0%(+23.6)#24 | 10.9%(+23.8)#589 |
| 25. | Bridgeton | 34.3% | 11.0%(+23.3)#25 | 10.9%(+23.4)#605 |
| 26. | Walesboro | 34.2% | 11.0%(+23.2)#26 | 10.9%(+23.4)#606 |
| 27. | Spencerville | 34.0% | 11.0%(+23.0)#27 | 10.9%(+23.1)#619 |
| 28. | River Forest | 33.3% | 11.0%(+22.3)#28 | 10.9%(+22.5)#679 |
| 29. | Geneva | 31.8% | 11.0%(+20.8)#29 | 10.9%(+20.9)#745 |
| 30. | Mount Ayr | 31.4% | 11.0%(+20.4)#30 | 10.9%(+20.6)#768 |
| 31. | Blountsville | 31.2% | 11.0%(+20.3)#31 | 10.9%(+20.4)#775 |
| 32. | Pulaski | 31.2% | 11.0%(+20.3)#32 | 10.9%(+20.4)#778 |
| 33. | Carrollton | 30.8% | 11.0%(+19.8)#33 | 10.9%(+19.9)#793 |
| 34. | Patriot | 30.7% | 11.0%(+19.7)#34 | 10.9%(+19.8)#804 |
| 35. | Perkinsville | 30.3% | 11.0%(+19.3)#35 | 10.9%(+19.4)#829 |
| 36. | Marion | 29.2% | 11.0%(+18.2)#36 | 10.9%(+18.3)#897 |
| 37. | Millhousen | 29.0% | 11.0%(+18.0)#37 | 10.9%(+18.2)#915 |
| 38. | Twelve Mile | 28.6% | 11.0%(+17.6)#38 | 10.9%(+17.7)#946 |
| 39. | Blanford | 28.6% | 11.0%(+17.6)#39 | 10.9%(+17.7)#949 |
| 40. | Mellott | 28.1% | 11.0%(+17.1)#40 | 10.9%(+17.3)#993 |
| 41. | Mongo | 28.0% | 11.0%(+17.0)#41 | 10.9%(+17.1)#1,011 |
| 42. | Fishersburg | 27.6% | 11.0%(+16.6)#42 | 10.9%(+16.7)#1,054 |
| 43. | Shipshewana Lake | 27.3% | 11.0%(+16.3)#43 | 10.9%(+16.4)#1,077 |
| 44. | Cowan | 27.0% | 11.0%(+16.0)#44 | 10.9%(+16.2)#1,103 |
| 45. | South Center | 26.9% | 11.0%(+15.9)#45 | 10.9%(+16.1)#1,112 |
| 46. | Helmsburg | 26.8% | 11.0%(+15.8)#46 | 10.9%(+15.9)#1,125 |
| 47. | Marshfield | 25.7% | 11.0%(+14.7)#47 | 10.9%(+14.9)#1,225 |
| 48. | Martinsburg | 25.6% | 11.0%(+14.6)#48 | 10.9%(+14.7)#1,245 |
| 49. | Claypool | 24.9% | 11.0%(+13.9)#49 | 10.9%(+14.0)#1,345 |
| 50. | Adams Lake | 24.7% | 11.0%(+13.8)#50 | 10.9%(+13.9)#1,356 |
| 51. | Prairie Creek | 24.6% | 11.0%(+13.6)#51 | 10.9%(+13.8)#1,371 |
| 52. | Glezen | 24.2% | 11.0%(+13.3)#52 | 10.9%(+13.4)#1,428 |
| 53. | Pittsburg | 23.9% | 11.0%(+13.0)#53 | 10.9%(+13.1)#1,467 |
| 54. | Antioch | 23.6% | 11.0%(+12.6)#54 | 10.9%(+12.8)#1,531 |
| 55. | La Fontaine | 23.5% | 11.0%(+12.6)#55 | 10.9%(+12.7)#1,543 |
| 56. | New Harmony | 23.5% | 11.0%(+12.5)#56 | 10.9%(+12.7)#1,554 |
| 57. | New Washington | 23.2% | 11.0%(+12.2)#57 | 10.9%(+12.3)#1,604 |
| 58. | Milroy | 22.9% | 11.0%(+11.9)#58 | 10.9%(+12.1)#1,643 |
| 59. | Nineveh | 22.9% | 11.0%(+11.9)#59 | 10.9%(+12.1)#1,646 |
| 60. | Blairsville | 22.9% | 11.0%(+11.9)#60 | 10.9%(+12.0)#1,661 |
| 61. | Memphis | 22.8% | 11.0%(+11.8)#61 | 10.9%(+11.9)#1,673 |
| 62. | Willow Branch | 22.5% | 11.0%(+11.5)#62 | 10.9%(+11.6)#1,742 |
| 63. | Dubois | 22.5% | 11.0%(+11.5)#63 | 10.9%(+11.6)#1,752 |
| 64. | Harmony | 22.5% | 11.0%(+11.5)#64 | 10.9%(+11.6)#1,753 |
| 65. | Elizabethtown | 22.4% | 11.0%(+11.4)#65 | 10.9%(+11.6)#1,761 |
| 66. | Waynesville | 22.4% | 11.0%(+11.4)#66 | 10.9%(+11.5)#1,768 |
| 67. | Cedar Grove | 22.2% | 11.0%(+11.2)#67 | 10.9%(+11.4)#1,791 |
| 68. | Edinburgh | 22.1% | 11.0%(+11.1)#68 | 10.9%(+11.2)#1,828 |
| 69. | Prospect | 22.1% | 11.0%(+11.1)#69 | 10.9%(+11.2)#1,833 |
| 70. | Andersonville | 22.0% | 11.0%(+11.0)#70 | 10.9%(+11.1)#1,847 |
| 71. | Mount Etna | 21.7% | 11.0%(+10.7)#71 | 10.9%(+10.8)#1,921 |
| 72. | Brooklyn | 21.7% | 11.0%(+10.7)#72 | 10.9%(+10.8)#1,925 |
| 73. | North Terre Haute | 21.5% | 11.0%(+10.6)#73 | 10.9%(+10.7)#1,955 |
| 74. | Cynthiana | 21.5% | 11.0%(+10.5)#74 | 10.9%(+10.7)#1,958 |
| 75. | Grantsburg | 21.4% | 11.0%(+10.4)#75 | 10.9%(+10.6)#1,984 |
| 76. | Mauckport | 21.4% | 11.0%(+10.4)#76 | 10.9%(+10.6)#1,989 |
| 77. | Blue Ridge | 21.3% | 11.0%(+10.3)#77 | 10.9%(+10.5)#2,014 |
| 78. | Roachdale | 21.2% | 11.0%(+10.2)#78 | 10.9%(+10.4)#2,035 |
| 79. | Montezuma | 21.2% | 11.0%(+10.2)#79 | 10.9%(+10.3)#2,047 |
| 80. | Merriam | 21.2% | 11.0%(+10.2)#80 | 10.9%(+10.3)#2,056 |
| 81. | Oswego | 21.1% | 11.0%(+10.1)#81 | 10.9%(+10.2)#2,076 |
| 82. | Liberty Center | 21.0% | 11.0%(+10.00)#82 | 10.9%(+10.1)#2,105 |
| 83. | New Ross | 20.9% | 11.0%(+9.90)#83 | 10.9%(+10.0)#2,130 |
| 84. | Center Point | 20.8% | 11.0%(+9.82)#84 | 10.9%(+9.95)#2,157 |
| 85. | Staunton | 20.6% | 11.0%(+9.60)#85 | 10.9%(+9.73)#2,227 |
| 86. | Moores Hill | 20.0% | 11.0%(+9.01)#86 | 10.9%(+9.14)#2,396 |
| 87. | Jefferson | 20.0% | 11.0%(+9.01)#87 | 10.9%(+9.14)#2,419 |
| 88. | Howe | 19.9% | 11.0%(+8.91)#88 | 10.9%(+9.05)#2,466 |
| 89. | Earl Park | 19.9% | 11.0%(+8.91)#89 | 10.9%(+9.04)#2,467 |
| 90. | Fountain City | 19.8% | 11.0%(+8.86)#90 | 10.9%(+8.99)#2,484 |
| 91. | New Salisbury | 19.8% | 11.0%(+8.85)#91 | 10.9%(+8.98)#2,485 |
| 92. | Corunna | 19.8% | 11.0%(+8.79)#92 | 10.9%(+8.92)#2,506 |
| 93. | Middlebury | 19.8% | 11.0%(+8.78)#93 | 10.9%(+8.92)#2,509 |
| 94. | Mineral Springs | 19.7% | 11.0%(+8.70)#94 | 10.9%(+8.83)#2,538 |
| 95. | Newburgh | 19.6% | 11.0%(+8.57)#95 | 10.9%(+8.70)#2,592 |
| 96. | Dover Hill | 19.5% | 11.0%(+8.52)#96 | 10.9%(+8.66)#2,610 |
| 97. | Petersville | 19.4% | 11.0%(+8.37)#97 | 10.9%(+8.50)#2,660 |
| 98. | Brookville | 19.3% | 11.0%(+8.35)#98 | 10.9%(+8.48)#2,667 |
| 99. | Deer Creek | 19.3% | 11.0%(+8.31)#99 | 10.9%(+8.44)#2,682 |
| 100. | Beech Grove | 19.3% | 11.0%(+8.28)#100 | 10.9%(+8.42)#2,689 |
Common Questions
What are the Top 10 Cities with the Highest Percentage of Population Employed in Office & Administration in Indiana?
Top 10 Cities with the Highest Percentage of Population Employed in Office & Administration in Indiana are:
#1
44.4%
#2
40.4%
#3
39.7%
#4
38.9%
#5
35.1%
#6
35.0%
#7
34.6%
#8
33.3%
#9
31.8%
#10
31.4%
What city has the Highest Percentage of Population Employed in Office & Administration in Indiana?
Butlerville has the Highest Percentage of Population Employed in Office & Administration in Indiana with 44.4%.
What is the Percentage of Population Employed in Office & Administration in the State of Indiana?
Percentage of Population Employed in Office & Administration in Indiana is 11.0%.
What is the Percentage of Population Employed in Office & Administration in the United States?
Percentage of Population Employed in Office & Administration in the United States is 10.9%.