Burbank, CA Map & Demographics
Burbank Map
Burbank Overview
$66,880
PER CAPITA INCOME
$191,190
AVG FAMILY INCOME
$137,929
AVG HOUSEHOLD INCOME
8.5%
WAGE / INCOME GAP [ % ]
91.5¢/ $1
WAGE / INCOME GAP [ $ ]
0.41
INEQUALITY / GINI INDEX
5,234
TOTAL POPULATION
2,737
MALE POPULATION
2,497
FEMALE POPULATION
109.61
MALES / 100 FEMALES
91.23
FEMALES / 100 MALES
36.9
MEDIAN AGE
3.4
AVG FAMILY SIZE
2.6
AVG HOUSEHOLD SIZE
3,313
LABOR FORCE [ PEOPLE ]
78.2%
PERCENT IN LABOR FORCE
2.0%
UNEMPLOYMENT RATE
Income in Burbank
Income Overview in Burbank
Per Capita Income in Burbank is $66,880, while median incomes of families and households are $191,190 and $137,929 respectively.
| Characteristic | Number | Measure |
| Per Capita Income | 5,234 | $66,880 |
| Median Family Income | 1,198 | $191,190 |
| Mean Family Income | 1,198 | $203,636 |
| Median Household Income | 1,994 | $137,929 |
| Mean Household Income | 1,994 | $170,557 |
| Income Deficit | 1,198 | $0 |
| Wage / Income Gap (%) | 5,234 | 8.45% |
| Wage / Income Gap ($) | 5,234 | 91.55¢ per $1 |
| Gini / Inequality Index | 5,234 | 0.41 |
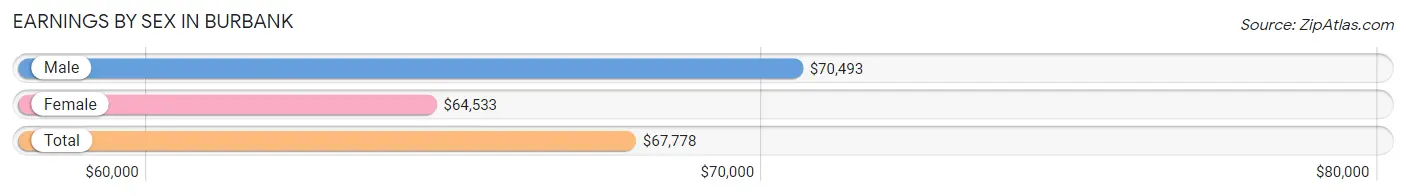
Earnings by Sex in Burbank
Average Earnings in Burbank are $67,778, $70,493 for men and $64,533 for women, a difference of 8.5%.
| Sex | Number | Average Earnings |
| Male | 1,855 (56.1%) | $70,493 |
| Female | 1,453 (43.9%) | $64,533 |
| Total | 3,308 (100.0%) | $67,778 |
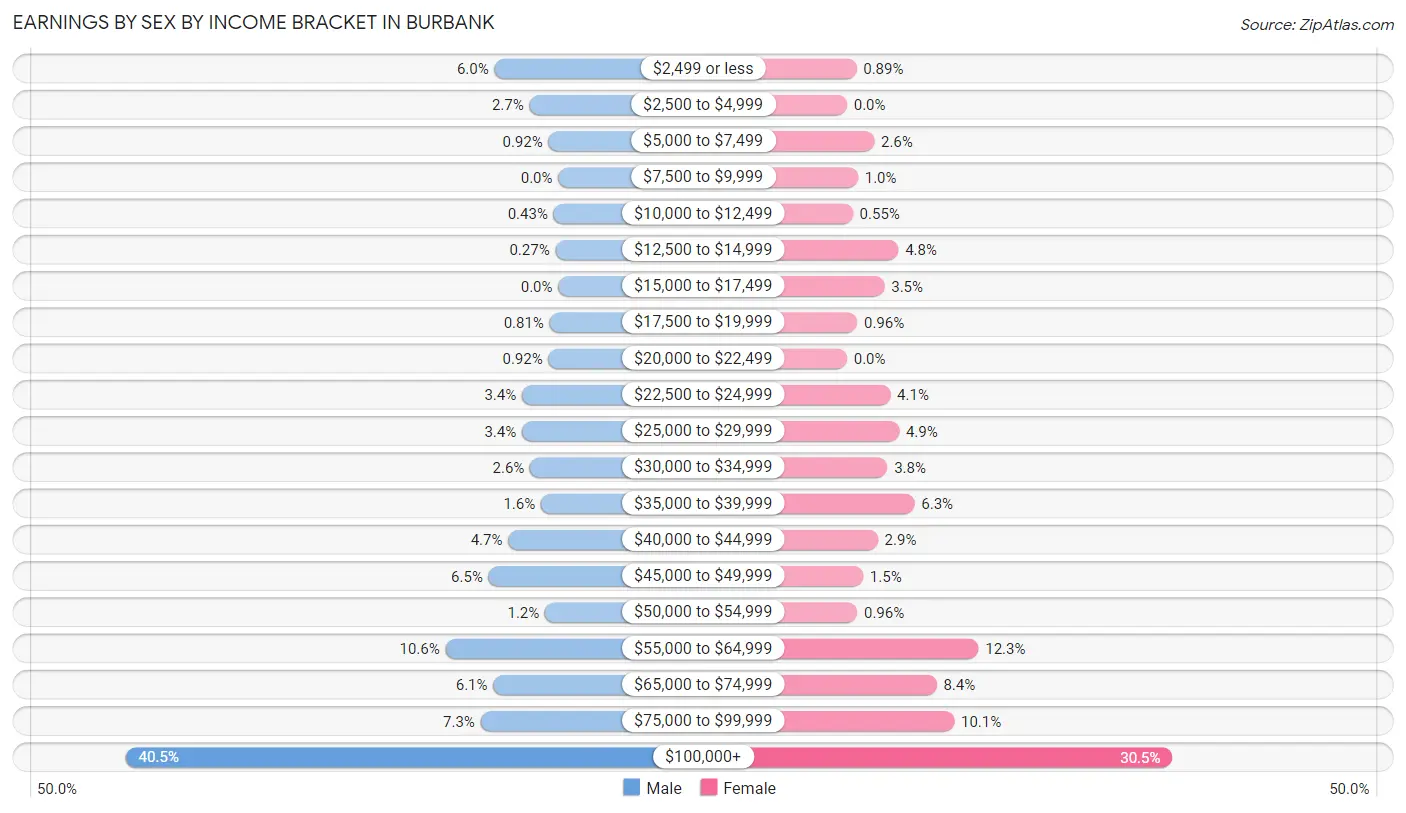
Earnings by Sex by Income Bracket in Burbank
The most common earnings brackets in Burbank are $100,000+ for men (752 | 40.5%) and $100,000+ for women (443 | 30.5%).
| Income | Male | Female |
| $2,499 or less | 111 (6.0%) | 13 (0.9%) |
| $2,500 to $4,999 | 50 (2.7%) | 0 (0.0%) |
| $5,000 to $7,499 | 17 (0.9%) | 37 (2.5%) |
| $7,500 to $9,999 | 0 (0.0%) | 15 (1.0%) |
| $10,000 to $12,499 | 8 (0.4%) | 8 (0.5%) |
| $12,500 to $14,999 | 5 (0.3%) | 70 (4.8%) |
| $15,000 to $17,499 | 0 (0.0%) | 51 (3.5%) |
| $17,500 to $19,999 | 15 (0.8%) | 14 (1.0%) |
| $20,000 to $22,499 | 17 (0.9%) | 0 (0.0%) |
| $22,500 to $24,999 | 63 (3.4%) | 59 (4.1%) |
| $25,000 to $29,999 | 63 (3.4%) | 71 (4.9%) |
| $30,000 to $34,999 | 49 (2.6%) | 55 (3.8%) |
| $35,000 to $39,999 | 30 (1.6%) | 92 (6.3%) |
| $40,000 to $44,999 | 87 (4.7%) | 42 (2.9%) |
| $45,000 to $49,999 | 121 (6.5%) | 22 (1.5%) |
| $50,000 to $54,999 | 23 (1.2%) | 14 (1.0%) |
| $55,000 to $64,999 | 196 (10.6%) | 179 (12.3%) |
| $65,000 to $74,999 | 113 (6.1%) | 122 (8.4%) |
| $75,000 to $99,999 | 135 (7.3%) | 146 (10.1%) |
| $100,000+ | 752 (40.5%) | 443 (30.5%) |
| Total | 1,855 (100.0%) | 1,453 (100.0%) |
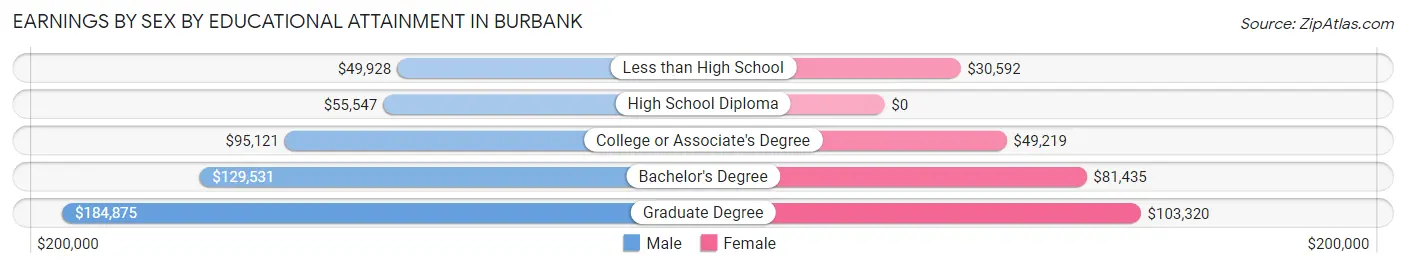
Earnings by Sex by Educational Attainment in Burbank
Average earnings in Burbank are $77,168 for men and $69,746 for women, a difference of 9.6%. Men with an educational attainment of graduate degree enjoy the highest average annual earnings of $184,875, while those with less than high school education earn the least with $49,928. Women with an educational attainment of graduate degree earn the most with the average annual earnings of $103,320, while those with less than high school education have the smallest earnings of $30,592.
| Educational Attainment | Male Income | Female Income |
| Less than High School | $49,928 | $30,592 |
| High School Diploma | $55,547 | $0 |
| College or Associate's Degree | $95,121 | $49,219 |
| Bachelor's Degree | $129,531 | $81,435 |
| Graduate Degree | $184,875 | $103,320 |
| Total | $77,168 | $69,746 |
Family Income in Burbank
Family Income Brackets in Burbank
According to the Burbank family income data, there are 568 families falling into the $200,000+ income range, which is the most common income bracket and makes up 47.4% of all families.
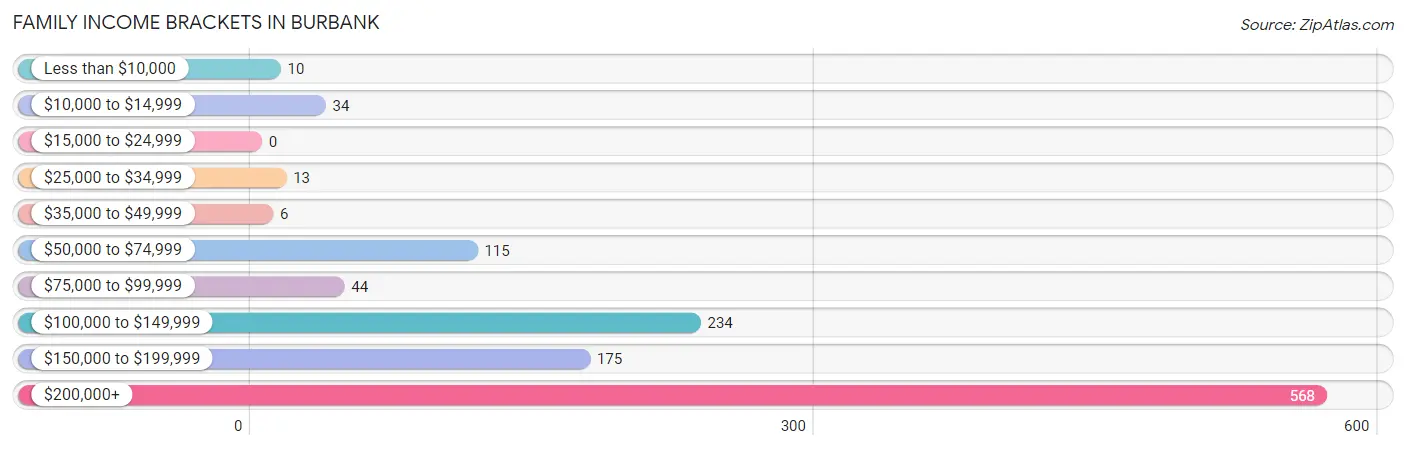
| Income Bracket | # Families | % Families |
| Less than $10,000 | 10 | 0.8% |
| $10,000 to $14,999 | 34 | 2.8% |
| $15,000 to $24,999 | 0 | 0.0% |
| $25,000 to $34,999 | 13 | 1.1% |
| $35,000 to $49,999 | 6 | 0.5% |
| $50,000 to $74,999 | 115 | 9.6% |
| $75,000 to $99,999 | 44 | 3.7% |
| $100,000 to $149,999 | 234 | 19.5% |
| $150,000 to $199,999 | 175 | 14.6% |
| $200,000+ | 568 | 47.4% |
Family Income by Famaliy Size in Burbank
5-person families (147 | 12.3%) account for the highest median family income in Burbank with $206,519 per family, while 2-person families (437 | 36.5%) have the highest median income of $95,387 per family member.
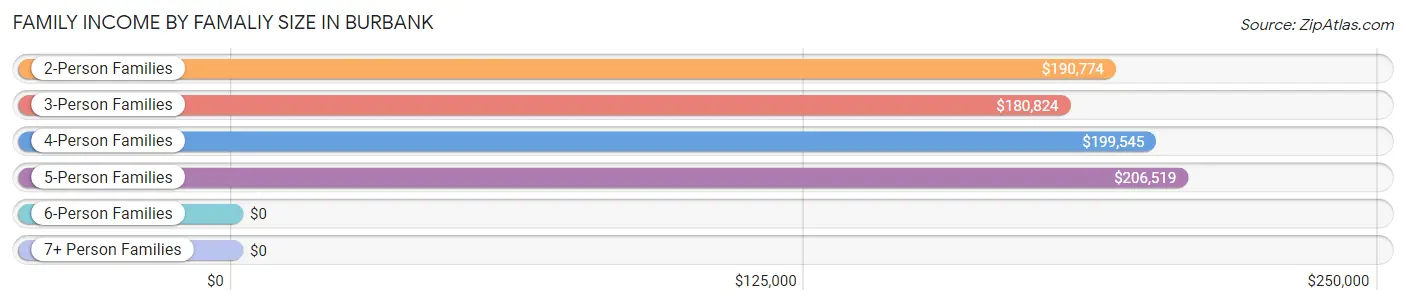
| Income Bracket | # Families | Median Income |
| 2-Person Families | 437 (36.5%) | $190,774 |
| 3-Person Families | 373 (31.1%) | $180,824 |
| 4-Person Families | 200 (16.7%) | $199,545 |
| 5-Person Families | 147 (12.3%) | $206,519 |
| 6-Person Families | 18 (1.5%) | $0 |
| 7+ Person Families | 23 (1.9%) | $0 |
| Total | 1,198 (100.0%) | $191,190 |
Family Income by Number of Earners in Burbank
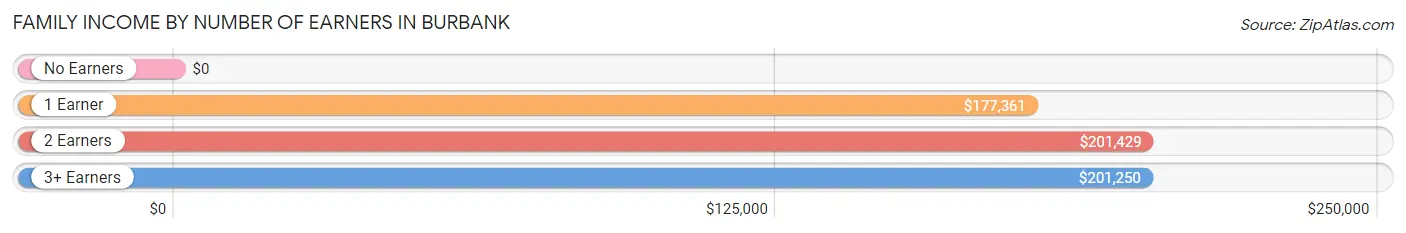
| Number of Earners | # Families | Median Income |
| No Earners | 63 (5.3%) | $0 |
| 1 Earner | 341 (28.5%) | $177,361 |
| 2 Earners | 568 (47.4%) | $201,429 |
| 3+ Earners | 226 (18.9%) | $201,250 |
| Total | 1,198 (100.0%) | $191,190 |
Household Income in Burbank
Household Income Brackets in Burbank
With 660 households falling in the category, the $200,000+ income range is the most frequent in Burbank, accounting for 33.1% of all households. In contrast, only 10 households (0.5%) fall into the less than $10,000 income bracket, making it the least populous group.
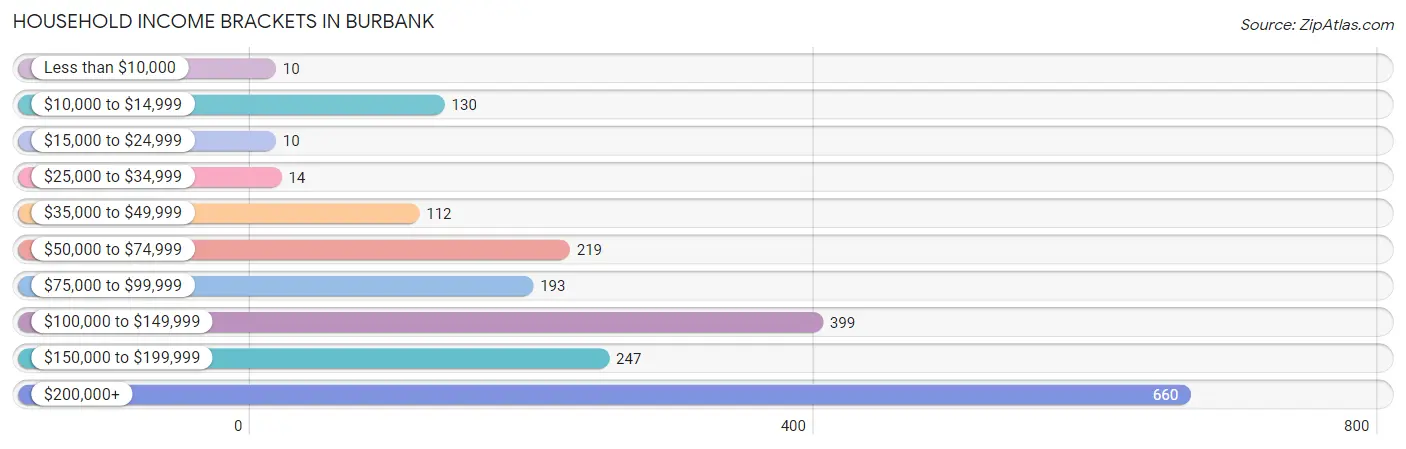
| Income Bracket | # Households | % Households |
| Less than $10,000 | 10 | 0.5% |
| $10,000 to $14,999 | 130 | 6.5% |
| $15,000 to $24,999 | 10 | 0.5% |
| $25,000 to $34,999 | 14 | 0.7% |
| $35,000 to $49,999 | 112 | 5.6% |
| $50,000 to $74,999 | 219 | 11.0% |
| $75,000 to $99,999 | 193 | 9.7% |
| $100,000 to $149,999 | 399 | 20.0% |
| $150,000 to $199,999 | 247 | 12.4% |
| $200,000+ | 660 | 33.1% |
Household Income by Householder Age in Burbank
The median household income in Burbank is $137,929, with the highest median household income of $180,745 found in the 45 to 64 years age bracket for the primary householder. A total of 824 households (41.3%) fall into this category. Meanwhile, the 15 to 24 years age bracket for the primary householder has the lowest median household income of $0, with 38 households (1.9%) in this group.
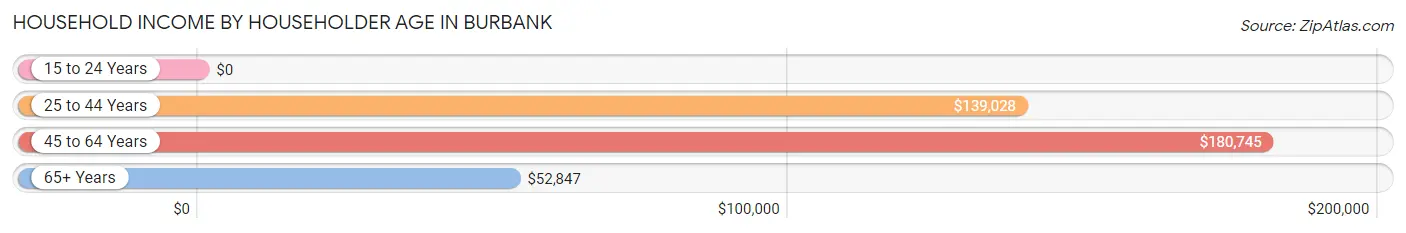
| Income Bracket | # Households | Median Income |
| 15 to 24 Years | 38 (1.9%) | $0 |
| 25 to 44 Years | 875 (43.9%) | $139,028 |
| 45 to 64 Years | 824 (41.3%) | $180,745 |
| 65+ Years | 257 (12.9%) | $52,847 |
| Total | 1,994 (100.0%) | $137,929 |
Poverty in Burbank
Income Below Poverty by Sex and Age in Burbank
With 3.3% poverty level for males and 5.9% for females among the residents of Burbank, 15 year old males and 75 year old and over females are the most vulnerable to poverty, with 9 males (19.2%) and 68 females (38.9%) in their respective age groups living below the poverty level.
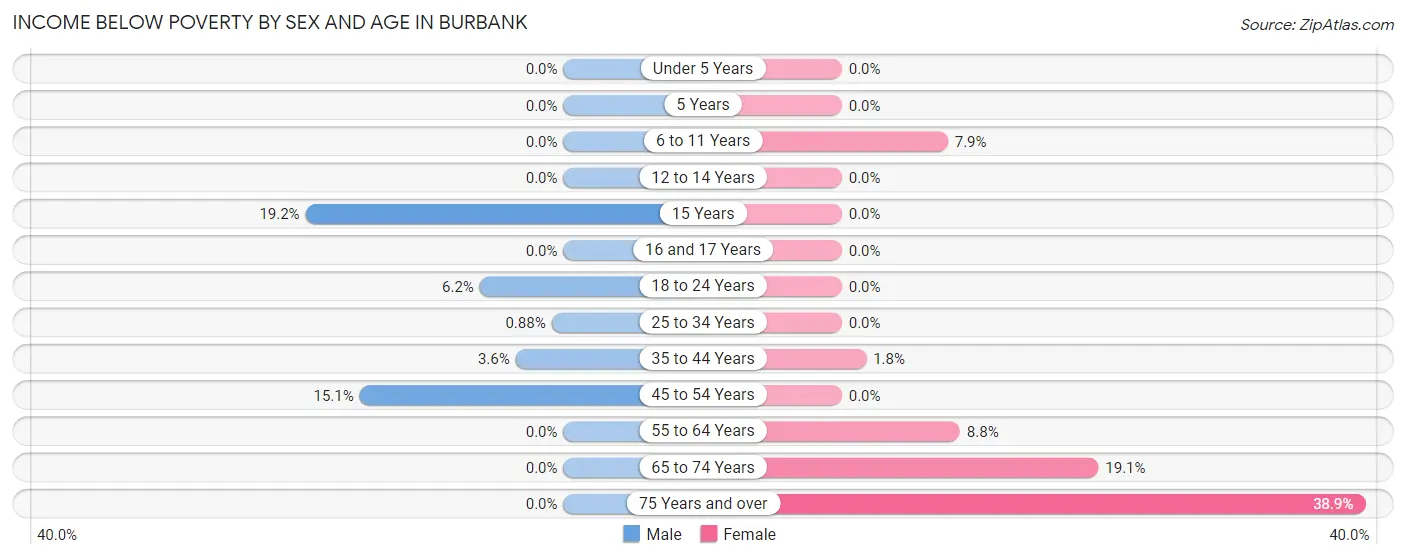
| Age Bracket | Male | Female |
| Under 5 Years | 0 (0.0%) | 0 (0.0%) |
| 5 Years | 0 (0.0%) | 0 (0.0%) |
| 6 to 11 Years | 0 (0.0%) | 10 (7.9%) |
| 12 to 14 Years | 0 (0.0%) | 0 (0.0%) |
| 15 Years | 9 (19.2%) | 0 (0.0%) |
| 16 and 17 Years | 0 (0.0%) | 0 (0.0%) |
| 18 to 24 Years | 9 (6.2%) | 0 (0.0%) |
| 25 to 34 Years | 5 (0.9%) | 0 (0.0%) |
| 35 to 44 Years | 19 (3.5%) | 9 (1.8%) |
| 45 to 54 Years | 46 (15.1%) | 0 (0.0%) |
| 55 to 64 Years | 0 (0.0%) | 35 (8.8%) |
| 65 to 74 Years | 0 (0.0%) | 24 (19.1%) |
| 75 Years and over | 0 (0.0%) | 68 (38.9%) |
| Total | 88 (3.3%) | 146 (5.9%) |
Income Above Poverty by Sex and Age in Burbank
According to the poverty statistics in Burbank, males aged under 5 years and females aged under 5 years are the age groups that are most secure financially, with 100.0% of males and 100.0% of females in these age groups living above the poverty line.
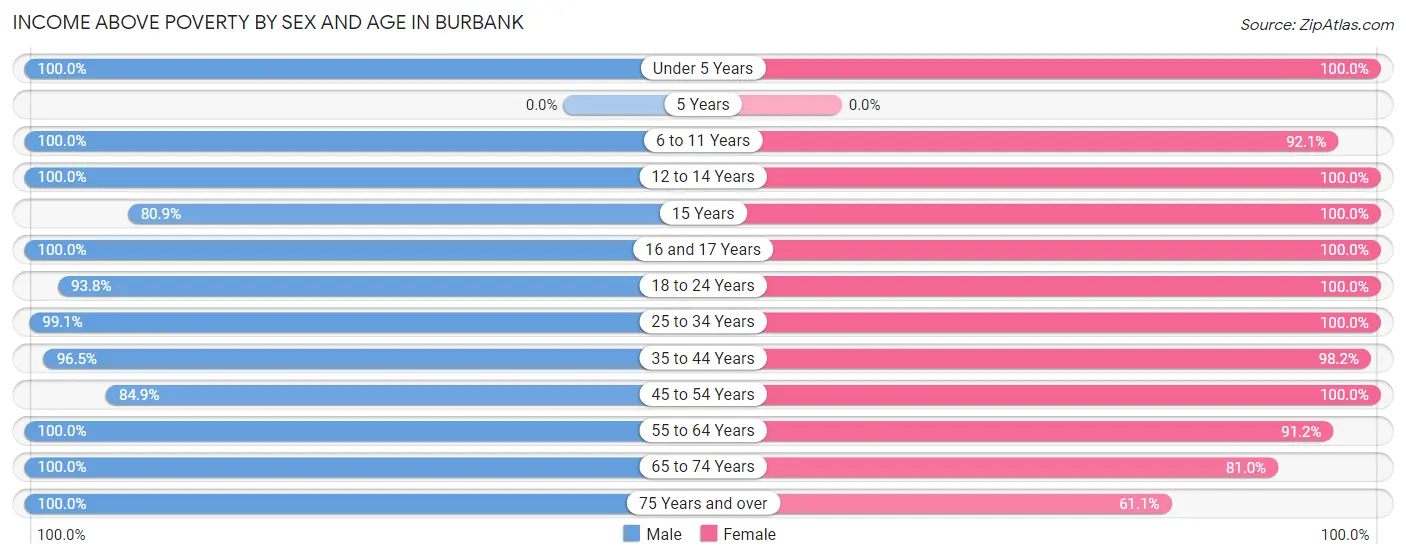
| Age Bracket | Male | Female |
| Under 5 Years | 140 (100.0%) | 221 (100.0%) |
| 5 Years | 0 (0.0%) | 0 (0.0%) |
| 6 to 11 Years | 199 (100.0%) | 117 (92.1%) |
| 12 to 14 Years | 91 (100.0%) | 101 (100.0%) |
| 15 Years | 38 (80.8%) | 43 (100.0%) |
| 16 and 17 Years | 69 (100.0%) | 29 (100.0%) |
| 18 to 24 Years | 136 (93.8%) | 168 (100.0%) |
| 25 to 34 Years | 562 (99.1%) | 380 (100.0%) |
| 35 to 44 Years | 516 (96.5%) | 489 (98.2%) |
| 45 to 54 Years | 258 (84.9%) | 230 (100.0%) |
| 55 to 64 Years | 461 (100.0%) | 364 (91.2%) |
| 65 to 74 Years | 79 (100.0%) | 102 (80.9%) |
| 75 Years and over | 72 (100.0%) | 107 (61.1%) |
| Total | 2,621 (96.8%) | 2,351 (94.2%) |
Income Below Poverty Among Married-Couple Families in Burbank
The poverty statistics for married-couple families in Burbank show that 2.4% or 21 of the total 884 families live below the poverty line. Families with 1 or 2 children have the highest poverty rate of 3.4%, comprising of 10 families. On the other hand, families with 3 or 4 children have the lowest poverty rate of 0.0%, which includes 0 families.
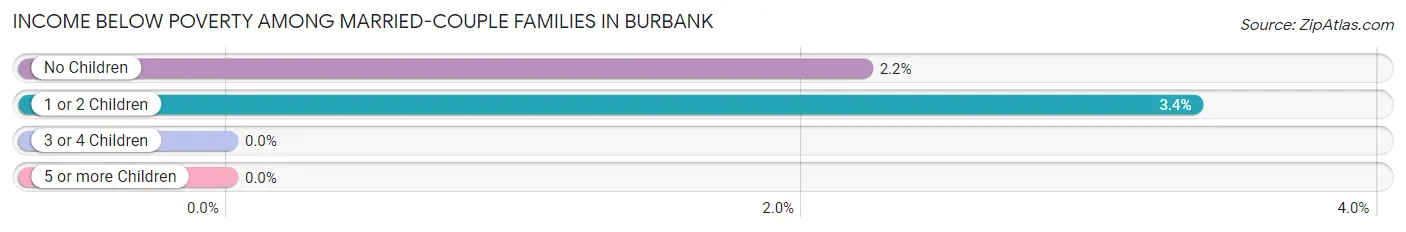
| Children | Above Poverty | Below Poverty |
| No Children | 487 (97.8%) | 11 (2.2%) |
| 1 or 2 Children | 288 (96.6%) | 10 (3.4%) |
| 3 or 4 Children | 88 (100.0%) | 0 (0.0%) |
| 5 or more Children | 0 (0.0%) | 0 (0.0%) |
| Total | 863 (97.6%) | 21 (2.4%) |
Income Below Poverty Among Single-Parent Households in Burbank
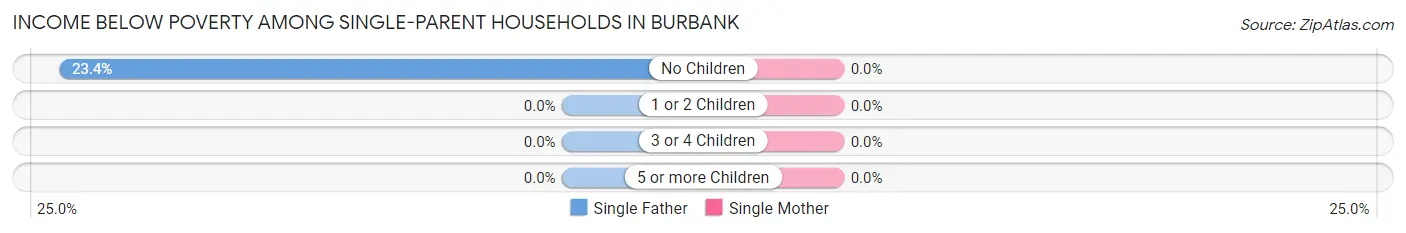
| Children | Single Father | Single Mother |
| No Children | 22 (23.4%) | 0 (0.0%) |
| 1 or 2 Children | 0 (0.0%) | 0 (0.0%) |
| 3 or 4 Children | 0 (0.0%) | 0 (0.0%) |
| 5 or more Children | 0 (0.0%) | 0 (0.0%) |
| Total | 22 (13.5%) | 0 (0.0%) |
Income Below Poverty Among Married-Couple vs Single-Parent Households in Burbank
The poverty data for Burbank shows that 21 of the married-couple family households (2.4%) and 22 of the single-parent households (7.0%) are living below the poverty level. Within the married-couple family households, those with 1 or 2 children have the highest poverty rate, with 10 households (3.4%) falling below the poverty line. Among the single-parent households, those with no children have the highest poverty rate, with 22 household (13.4%) living below poverty.
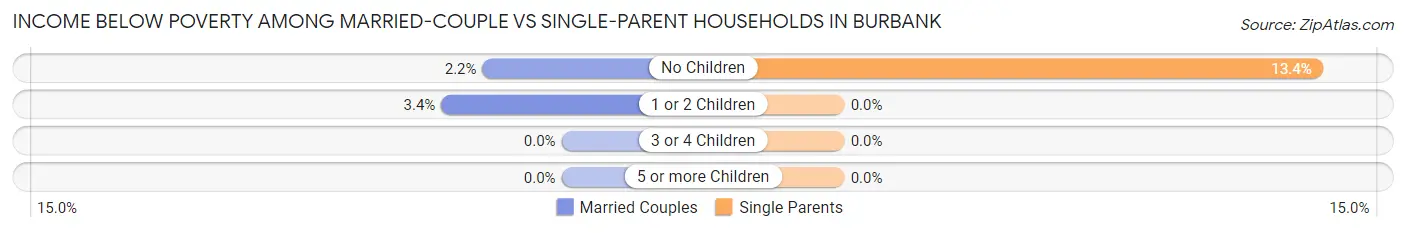
| Children | Married-Couple Families | Single-Parent Households |
| No Children | 11 (2.2%) | 22 (13.4%) |
| 1 or 2 Children | 10 (3.4%) | 0 (0.0%) |
| 3 or 4 Children | 0 (0.0%) | 0 (0.0%) |
| 5 or more Children | 0 (0.0%) | 0 (0.0%) |
| Total | 21 (2.4%) | 22 (7.0%) |
Race in Burbank
The most populous races in Burbank are White / Caucasian (2,872 | 54.9%), Hispanic or Latino (1,688 | 32.3%), and Asian (921 | 17.6%).
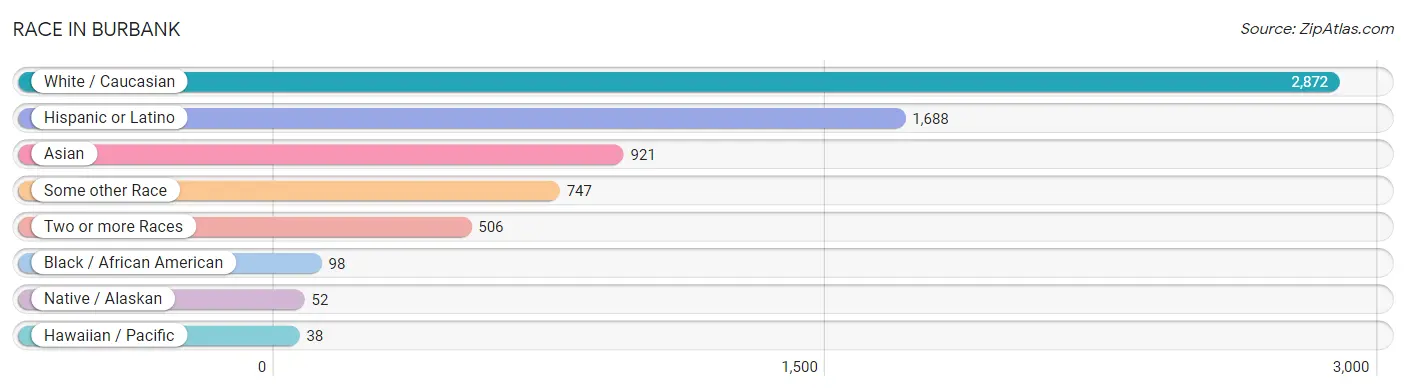
| Race | # Population | % Population |
| Asian | 921 | 17.6% |
| Black / African American | 98 | 1.9% |
| Hawaiian / Pacific | 38 | 0.7% |
| Hispanic or Latino | 1,688 | 32.3% |
| Native / Alaskan | 52 | 1.0% |
| White / Caucasian | 2,872 | 54.9% |
| Two or more Races | 506 | 9.7% |
| Some other Race | 747 | 14.3% |
| Total | 5,234 | 100.0% |
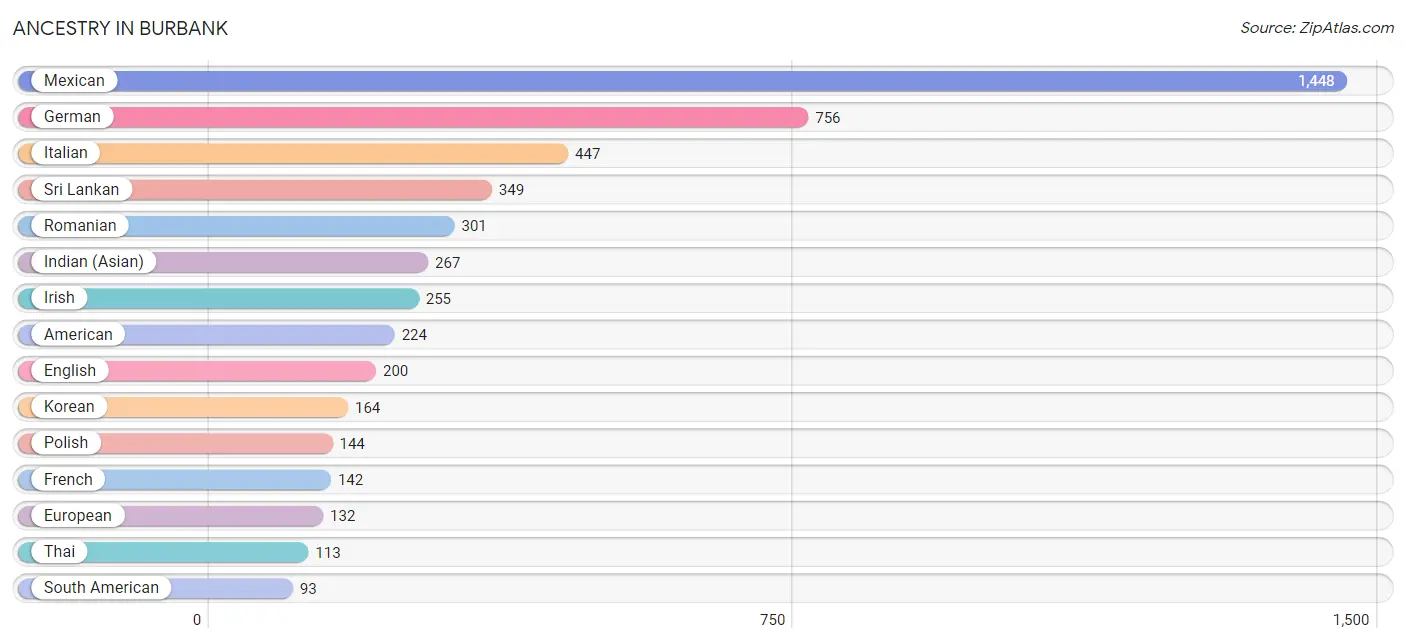
Ancestry in Burbank
The most populous ancestries reported in Burbank are Mexican (1,448 | 27.7%), German (756 | 14.4%), Italian (447 | 8.5%), Sri Lankan (349 | 6.7%), and Romanian (301 | 5.8%), together accounting for 63.1% of all Burbank residents.
| Ancestry | # Population | % Population |
| Albanian | 27 | 0.5% |
| American | 224 | 4.3% |
| Arab | 7 | 0.1% |
| Armenian | 54 | 1.0% |
| Basque | 14 | 0.3% |
| Bhutanese | 42 | 0.8% |
| British | 27 | 0.5% |
| Bulgarian | 21 | 0.4% |
| Burmese | 10 | 0.2% |
| Cajun | 9 | 0.2% |
| Central American | 60 | 1.1% |
| Central American Indian | 52 | 1.0% |
| Croatian | 11 | 0.2% |
| Cuban | 9 | 0.2% |
| Danish | 16 | 0.3% |
| Dutch | 21 | 0.4% |
| Eastern European | 13 | 0.3% |
| Ecuadorian | 7 | 0.1% |
| Egyptian | 7 | 0.1% |
| English | 200 | 3.8% |
| European | 132 | 2.5% |
| Finnish | 3 | 0.1% |
| French | 142 | 2.7% |
| German | 756 | 14.4% |
| Greek | 21 | 0.4% |
| Hungarian | 14 | 0.3% |
| Indian (Asian) | 267 | 5.1% |
| Indonesian | 16 | 0.3% |
| Iranian | 7 | 0.1% |
| Irish | 255 | 4.9% |
| Italian | 447 | 8.5% |
| Japanese | 17 | 0.3% |
| Korean | 164 | 3.1% |
| Lithuanian | 13 | 0.3% |
| Mexican | 1,448 | 27.7% |
| Mexican American Indian | 52 | 1.0% |
| Nicaraguan | 36 | 0.7% |
| Northern European | 13 | 0.3% |
| Norwegian | 37 | 0.7% |
| Pakistani | 33 | 0.6% |
| Peruvian | 86 | 1.6% |
| Polish | 144 | 2.8% |
| Portuguese | 66 | 1.3% |
| Potawatomi | 8 | 0.2% |
| Puerto Rican | 17 | 0.3% |
| Romanian | 301 | 5.8% |
| Russian | 48 | 0.9% |
| Salvadoran | 24 | 0.5% |
| Scandinavian | 39 | 0.7% |
| Scotch-Irish | 16 | 0.3% |
| Scottish | 20 | 0.4% |
| South American | 93 | 1.8% |
| Spaniard | 40 | 0.8% |
| Spanish | 21 | 0.4% |
| Sri Lankan | 349 | 6.7% |
| Swedish | 84 | 1.6% |
| Thai | 113 | 2.2% |
| Turkish | 8 | 0.2% |
| Ukrainian | 13 | 0.3% |
| Yugoslavian | 33 | 0.6% | View All 60 Rows |
Immigrants in Burbank
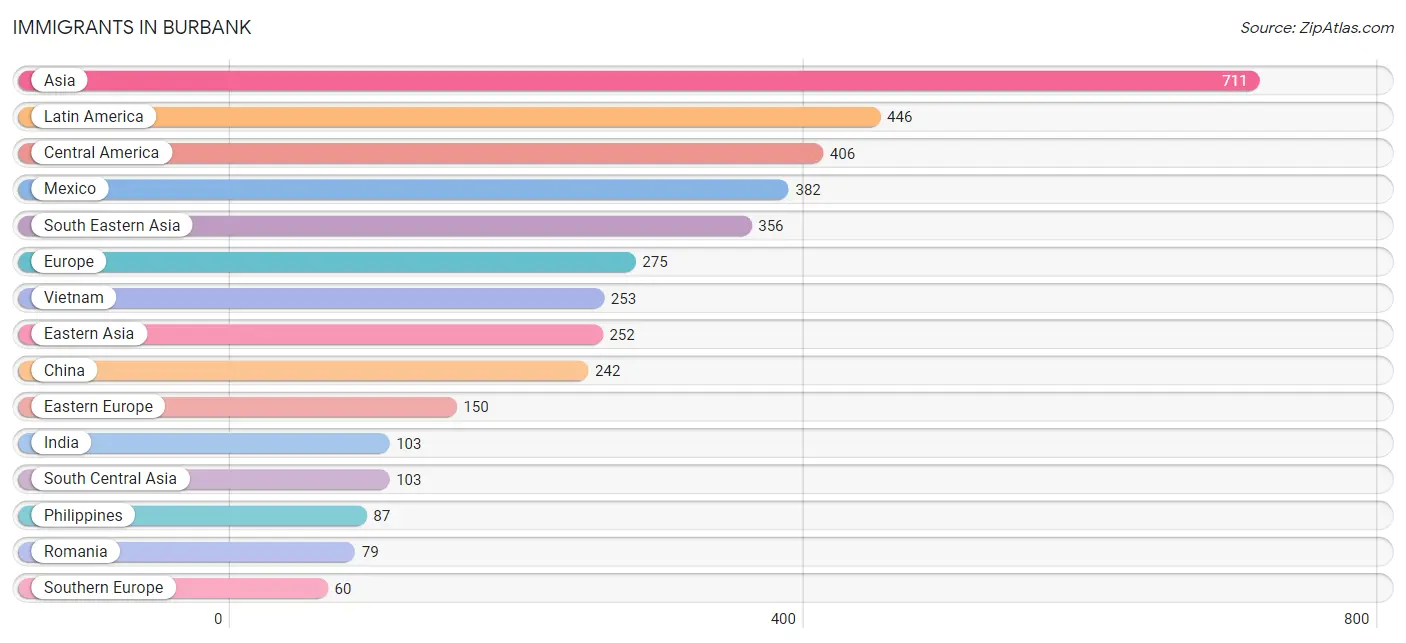
The most numerous immigrant groups reported in Burbank came from Asia (711 | 13.6%), Latin America (446 | 8.5%), Central America (406 | 7.8%), Mexico (382 | 7.3%), and South Eastern Asia (356 | 6.8%), together accounting for 44.0% of all Burbank residents.
| Immigration Origin | # Population | % Population |
| Africa | 11 | 0.2% |
| Asia | 711 | 13.6% |
| Bosnia and Herzegovina | 33 | 0.6% |
| Bulgaria | 21 | 0.4% |
| Central America | 406 | 7.8% |
| China | 242 | 4.6% |
| Eastern Asia | 252 | 4.8% |
| Eastern Europe | 150 | 2.9% |
| El Salvador | 24 | 0.5% |
| England | 7 | 0.1% |
| Europe | 275 | 5.2% |
| Germany | 33 | 0.6% |
| India | 103 | 2.0% |
| Italy | 42 | 0.8% |
| Korea | 10 | 0.2% |
| Latin America | 446 | 8.5% |
| Mexico | 382 | 7.3% |
| Netherlands | 8 | 0.2% |
| Northern Europe | 17 | 0.3% |
| Peru | 40 | 0.8% |
| Philippines | 87 | 1.7% |
| Romania | 79 | 1.5% |
| Russia | 17 | 0.3% |
| South Africa | 11 | 0.2% |
| South America | 40 | 0.8% |
| South Central Asia | 103 | 2.0% |
| South Eastern Asia | 356 | 6.8% |
| Southern Europe | 60 | 1.1% |
| Spain | 18 | 0.3% |
| Taiwan | 14 | 0.3% |
| Vietnam | 253 | 4.8% |
| Western Europe | 41 | 0.8% | View All 32 Rows |
Sex and Age in Burbank
Sex and Age in Burbank
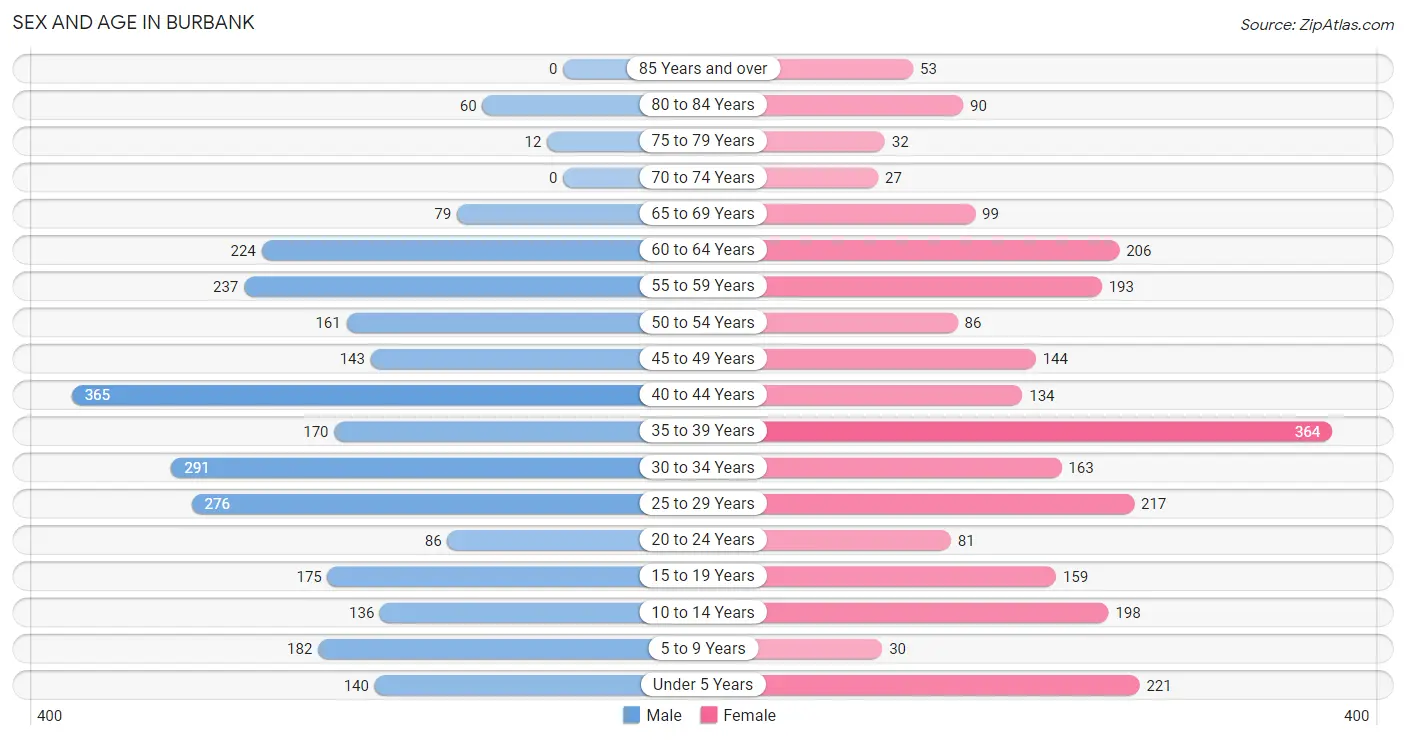
The most populous age groups in Burbank are 40 to 44 Years (365 | 13.3%) for men and 35 to 39 Years (364 | 14.6%) for women.
| Age Bracket | Male | Female |
| Under 5 Years | 140 (5.1%) | 221 (8.8%) |
| 5 to 9 Years | 182 (6.7%) | 30 (1.2%) |
| 10 to 14 Years | 136 (5.0%) | 198 (7.9%) |
| 15 to 19 Years | 175 (6.4%) | 159 (6.4%) |
| 20 to 24 Years | 86 (3.1%) | 81 (3.2%) |
| 25 to 29 Years | 276 (10.1%) | 217 (8.7%) |
| 30 to 34 Years | 291 (10.6%) | 163 (6.5%) |
| 35 to 39 Years | 170 (6.2%) | 364 (14.6%) |
| 40 to 44 Years | 365 (13.3%) | 134 (5.4%) |
| 45 to 49 Years | 143 (5.2%) | 144 (5.8%) |
| 50 to 54 Years | 161 (5.9%) | 86 (3.4%) |
| 55 to 59 Years | 237 (8.7%) | 193 (7.7%) |
| 60 to 64 Years | 224 (8.2%) | 206 (8.3%) |
| 65 to 69 Years | 79 (2.9%) | 99 (4.0%) |
| 70 to 74 Years | 0 (0.0%) | 27 (1.1%) |
| 75 to 79 Years | 12 (0.4%) | 32 (1.3%) |
| 80 to 84 Years | 60 (2.2%) | 90 (3.6%) |
| 85 Years and over | 0 (0.0%) | 53 (2.1%) |
| Total | 2,737 (100.0%) | 2,497 (100.0%) |
Families and Households in Burbank
Median Family Size in Burbank
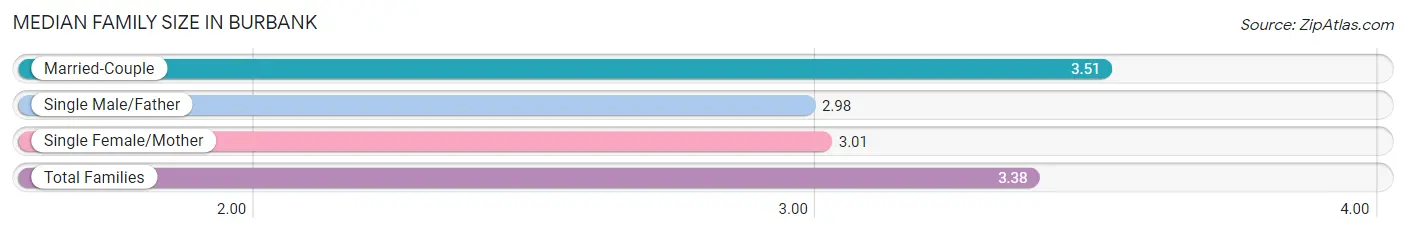
The median family size in Burbank is 3.38 persons per family, with married-couple families (884 | 73.8%) accounting for the largest median family size of 3.51 persons per family. On the other hand, single male/father families (163 | 13.6%) represent the smallest median family size with 2.98 persons per family.
| Family Type | # Families | Family Size |
| Married-Couple | 884 (73.8%) | 3.51 |
| Single Male/Father | 163 (13.6%) | 2.98 |
| Single Female/Mother | 151 (12.6%) | 3.01 |
| Total Families | 1,198 (100.0%) | 3.38 |
Median Household Size in Burbank
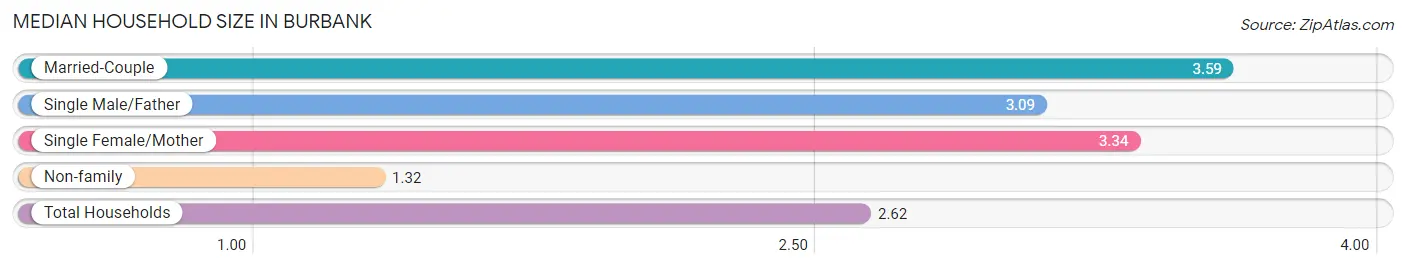
The median household size in Burbank is 2.62 persons per household, with married-couple households (884 | 44.3%) accounting for the largest median household size of 3.59 persons per household. non-family households (796 | 39.9%) represent the smallest median household size with 1.32 persons per household.
| Household Type | # Households | Household Size |
| Married-Couple | 884 (44.3%) | 3.59 |
| Single Male/Father | 163 (8.2%) | 3.09 |
| Single Female/Mother | 151 (7.6%) | 3.34 |
| Non-family | 796 (39.9%) | 1.32 |
| Total Households | 1,994 (100.0%) | 2.62 |
Household Size by Marriage Status in Burbank
Out of a total of 1,994 households in Burbank, 1,198 (60.1%) are family households, while 796 (39.9%) are nonfamily households. The most numerous type of family households are 3-person households, comprising 381, and the most common type of nonfamily households are 1-person households, comprising 603.
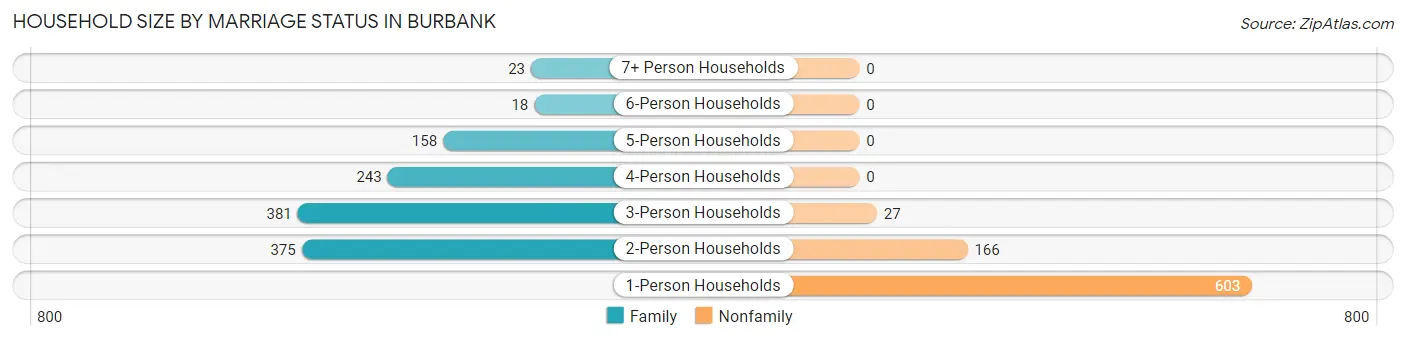
| Household Size | Family Households | Nonfamily Households |
| 1-Person Households | - | 603 (30.2%) |
| 2-Person Households | 375 (18.8%) | 166 (8.3%) |
| 3-Person Households | 381 (19.1%) | 27 (1.3%) |
| 4-Person Households | 243 (12.2%) | 0 (0.0%) |
| 5-Person Households | 158 (7.9%) | 0 (0.0%) |
| 6-Person Households | 18 (0.9%) | 0 (0.0%) |
| 7+ Person Households | 23 (1.1%) | 0 (0.0%) |
| Total | 1,198 (60.1%) | 796 (39.9%) |
Female Fertility in Burbank
Fertility by Age in Burbank
Average fertility rate in Burbank is 62.0 births per 1,000 women. Women in the age bracket of 35 to 50 years have the highest fertility rate with 87.0 births per 1,000 women. Women in the age bracket of 35 to 50 years acount for 74.1% of all women with births.
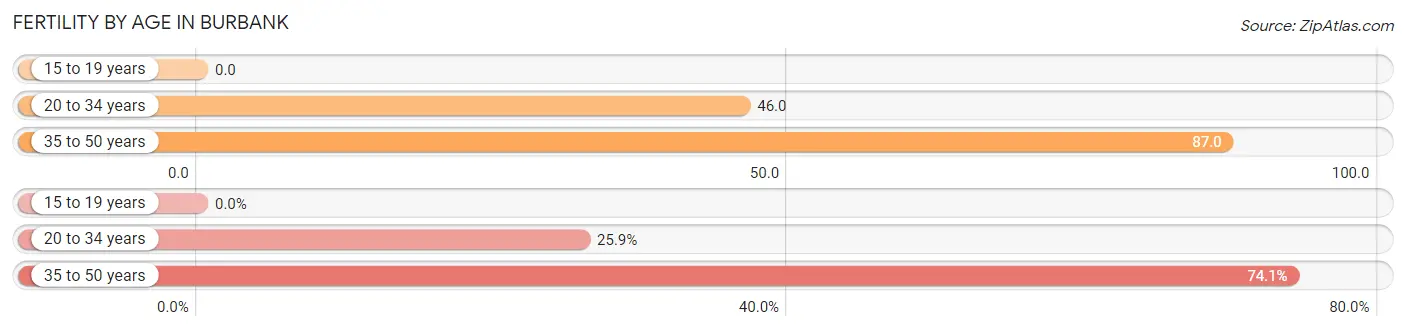
| Age Bracket | Women with Births | Births / 1,000 Women |
| 15 to 19 years | 0 (0.0%) | 0.0 |
| 20 to 34 years | 21 (25.9%) | 46.0 |
| 35 to 50 years | 60 (74.1%) | 87.0 |
| Total | 81 (100.0%) | 62.0 |
Fertility by Age by Marriage Status in Burbank
90.1% of women with births (81) in Burbank are married. The highest percentage of unmarried women with births falls into 20 to 34 years age bracket with 38.1% of them unmarried at the time of birth, while the lowest percentage of unmarried women with births belong to 35 to 50 years age bracket with 0.0% of them unmarried.
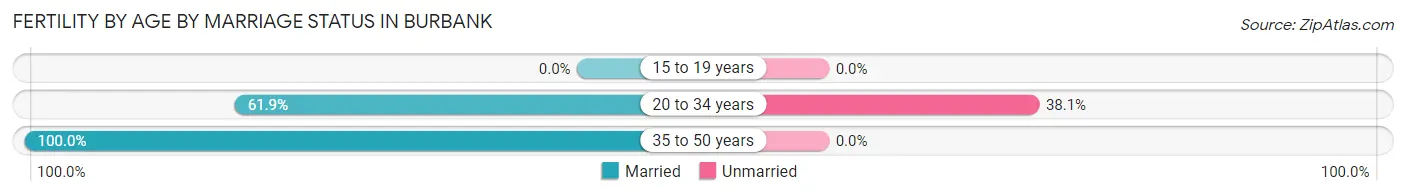
| Age Bracket | Married | Unmarried |
| 15 to 19 years | 0 (0.0%) | 0 (0.0%) |
| 20 to 34 years | 13 (61.9%) | 8 (38.1%) |
| 35 to 50 years | 60 (100.0%) | 0 (0.0%) |
| Total | 73 (90.1%) | 8 (9.9%) |
Fertility by Education in Burbank
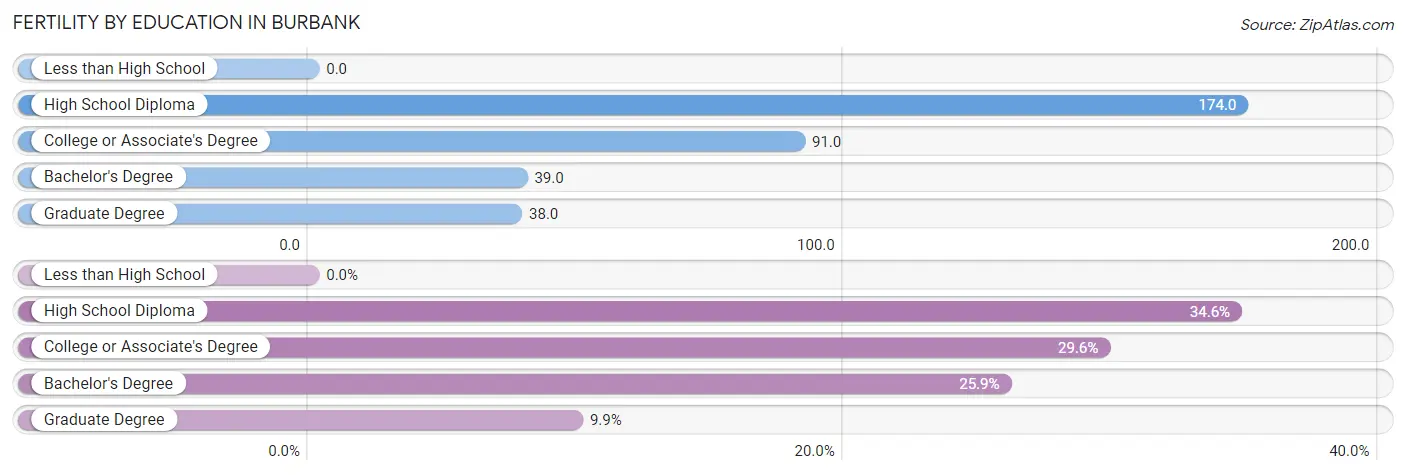
| Educational Attainment | Women with Births | Births / 1,000 Women |
| Less than High School | 0 (0.0%) | 0.0 |
| High School Diploma | 28 (34.6%) | 174.0 |
| College or Associate's Degree | 24 (29.6%) | 91.0 |
| Bachelor's Degree | 21 (25.9%) | 39.0 |
| Graduate Degree | 8 (9.9%) | 38.0 |
| Total | 81 (100.0%) | 62.0 |
Fertility by Education by Marriage Status in Burbank
9.9% of women with births in Burbank are unmarried. Women with the educational attainment of high school diploma are most likely to be married with 100.0% of them married at childbirth, while women with the educational attainment of graduate degree are least likely to be married with 100.0% of them unmarried at childbirth.
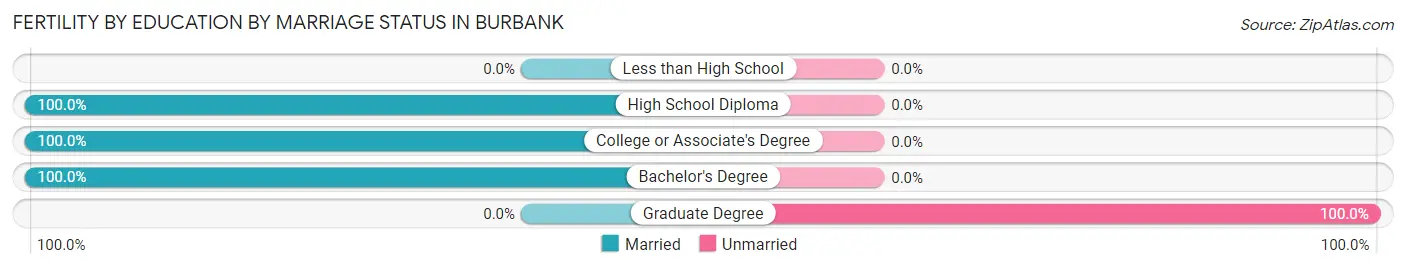
| Educational Attainment | Married | Unmarried |
| Less than High School | 0 (0.0%) | 0 (0.0%) |
| High School Diploma | 28 (100.0%) | 0 (0.0%) |
| College or Associate's Degree | 24 (100.0%) | 0 (0.0%) |
| Bachelor's Degree | 21 (100.0%) | 0 (0.0%) |
| Graduate Degree | 0 (0.0%) | 8 (100.0%) |
| Total | 73 (90.1%) | 8 (9.9%) |
Employment Characteristics in Burbank
Employment by Class of Employer in Burbank
Among the 3,198 employed individuals in Burbank, private company employees (2,438 | 76.2%), local government employees (348 | 10.9%), and self-employed (not incorporated) (128 | 4.0%) make up the most common classes of employment.
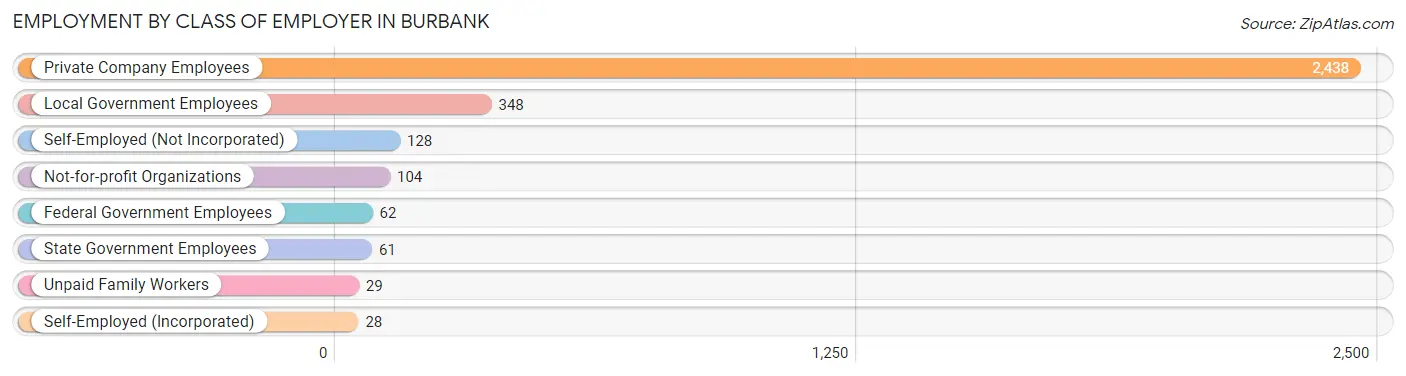
| Employer Class | # Employees | % Employees |
| Private Company Employees | 2,438 | 76.2% |
| Self-Employed (Incorporated) | 28 | 0.9% |
| Self-Employed (Not Incorporated) | 128 | 4.0% |
| Not-for-profit Organizations | 104 | 3.3% |
| Local Government Employees | 348 | 10.9% |
| State Government Employees | 61 | 1.9% |
| Federal Government Employees | 62 | 1.9% |
| Unpaid Family Workers | 29 | 0.9% |
| Total | 3,198 | 100.0% |
Employment Status by Age in Burbank
According to the labor force statistics for Burbank, out of the total population over 16 years of age (4,237), 78.2% or 3,313 individuals are in the labor force, with 2.0% or 66 of them unemployed. The age group with the highest labor force participation rate is 30 to 34 years, with 100.0% or 454 individuals in the labor force. Within the labor force, the 45 to 54 years age range has the highest percentage of unemployed individuals, with 7.2% or 32 of them being unemployed.
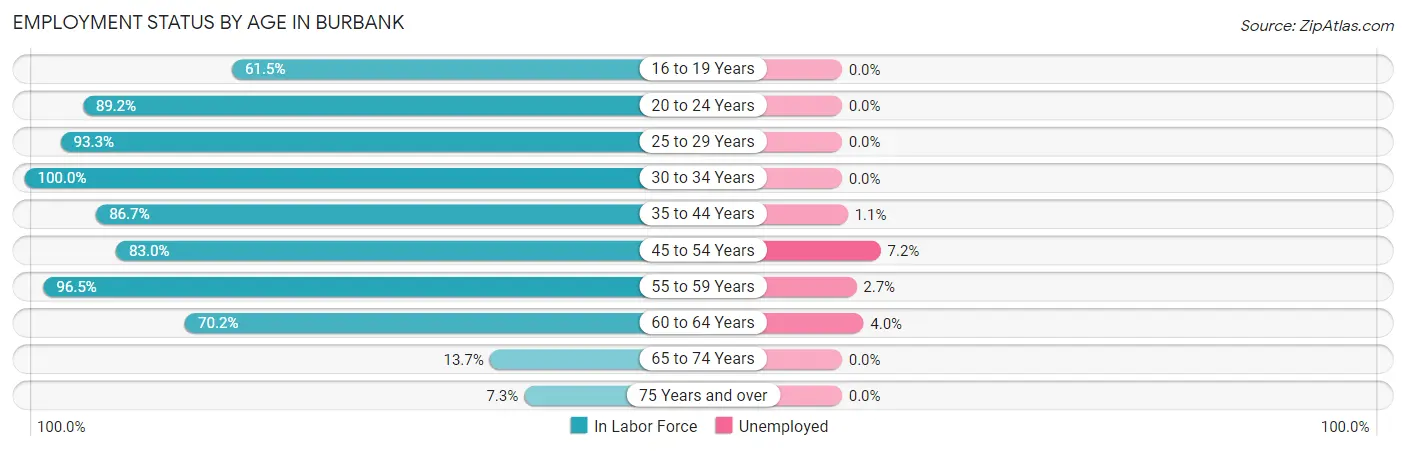
| Age Bracket | In Labor Force | Unemployed |
| 16 to 19 Years | 150 (61.5%) | 0 (0.0%) |
| 20 to 24 Years | 149 (89.2%) | 0 (0.0%) |
| 25 to 29 Years | 460 (93.3%) | 0 (0.0%) |
| 30 to 34 Years | 454 (100.0%) | 0 (0.0%) |
| 35 to 44 Years | 896 (86.7%) | 10 (1.1%) |
| 45 to 54 Years | 443 (83.0%) | 32 (7.2%) |
| 55 to 59 Years | 415 (96.5%) | 11 (2.7%) |
| 60 to 64 Years | 302 (70.2%) | 12 (4.0%) |
| 65 to 74 Years | 28 (13.7%) | 0 (0.0%) |
| 75 Years and over | 18 (7.3%) | 0 (0.0%) |
| Total | 3,313 (78.2%) | 66 (2.0%) |
Employment Status by Educational Attainment in Burbank
According to labor force statistics for Burbank, 88.0% of individuals (2,969) out of the total population between 25 and 64 years of age (3,374) are in the labor force, with 2.2% or 65 of them being unemployed. The group with the highest labor force participation rate are those with the educational attainment of high school diploma, with 94.4% or 612 individuals in the labor force. Within the labor force, individuals with bachelor's degree or higher education have the highest percentage of unemployment, with 2.9% or 42 of them being unemployed.
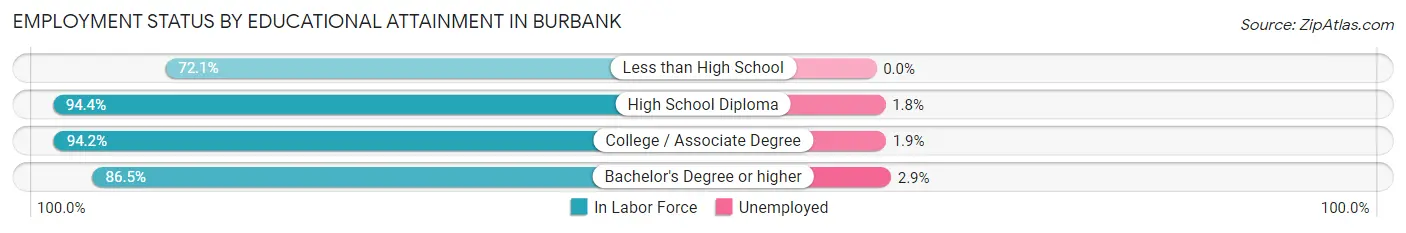
| Educational Attainment | In Labor Force | Unemployed |
| Less than High School | 266 (72.1%) | 0 (0.0%) |
| High School Diploma | 612 (94.4%) | 12 (1.8%) |
| College / Associate Degree | 645 (94.2%) | 13 (1.9%) |
| Bachelor's Degree or higher | 1,446 (86.5%) | 48 (2.9%) |
| Total | 2,969 (88.0%) | 74 (2.2%) |
Employment Occupations by Sex in Burbank
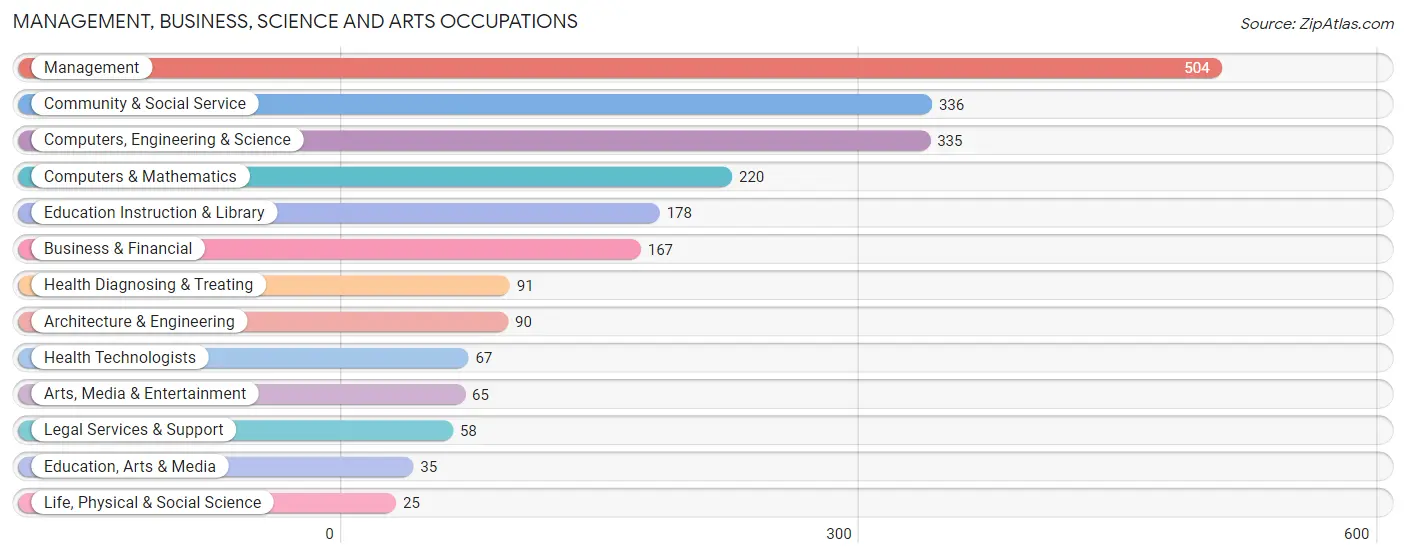
Management, Business, Science and Arts Occupations
The most common Management, Business, Science and Arts occupations in Burbank are Management (504 | 15.5%), Community & Social Service (336 | 10.3%), Computers, Engineering & Science (335 | 10.3%), Computers & Mathematics (220 | 6.8%), and Education Instruction & Library (178 | 5.5%).
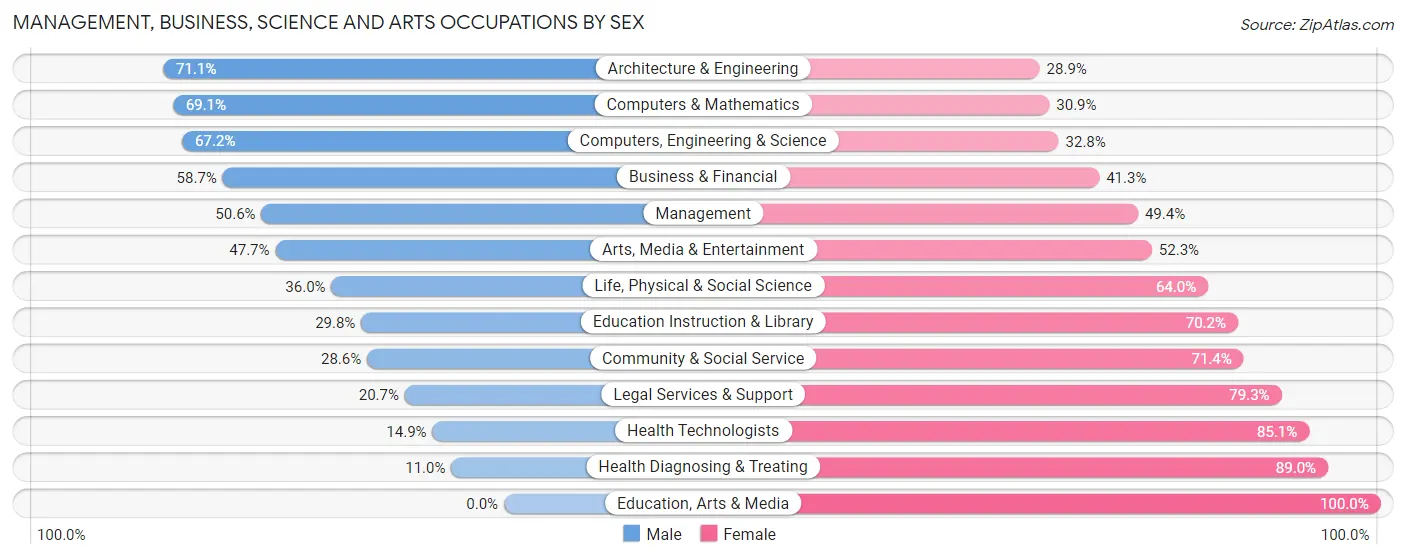
Management, Business, Science and Arts Occupations by Sex
Within the Management, Business, Science and Arts occupations in Burbank, the most male-oriented occupations are Architecture & Engineering (71.1%), Computers & Mathematics (69.1%), and Computers, Engineering & Science (67.2%), while the most female-oriented occupations are Education, Arts & Media (100.0%), Health Diagnosing & Treating (89.0%), and Health Technologists (85.1%).
| Occupation | Male | Female |
| Management | 255 (50.6%) | 249 (49.4%) |
| Business & Financial | 98 (58.7%) | 69 (41.3%) |
| Computers, Engineering & Science | 225 (67.2%) | 110 (32.8%) |
| Computers & Mathematics | 152 (69.1%) | 68 (30.9%) |
| Architecture & Engineering | 64 (71.1%) | 26 (28.9%) |
| Life, Physical & Social Science | 9 (36.0%) | 16 (64.0%) |
| Community & Social Service | 96 (28.6%) | 240 (71.4%) |
| Education, Arts & Media | 0 (0.0%) | 35 (100.0%) |
| Legal Services & Support | 12 (20.7%) | 46 (79.3%) |
| Education Instruction & Library | 53 (29.8%) | 125 (70.2%) |
| Arts, Media & Entertainment | 31 (47.7%) | 34 (52.3%) |
| Health Diagnosing & Treating | 10 (11.0%) | 81 (89.0%) |
| Health Technologists | 10 (14.9%) | 57 (85.1%) |
| Total (Category) | 684 (47.7%) | 749 (52.3%) |
| Total (Overall) | 1,776 (54.6%) | 1,474 (45.4%) |
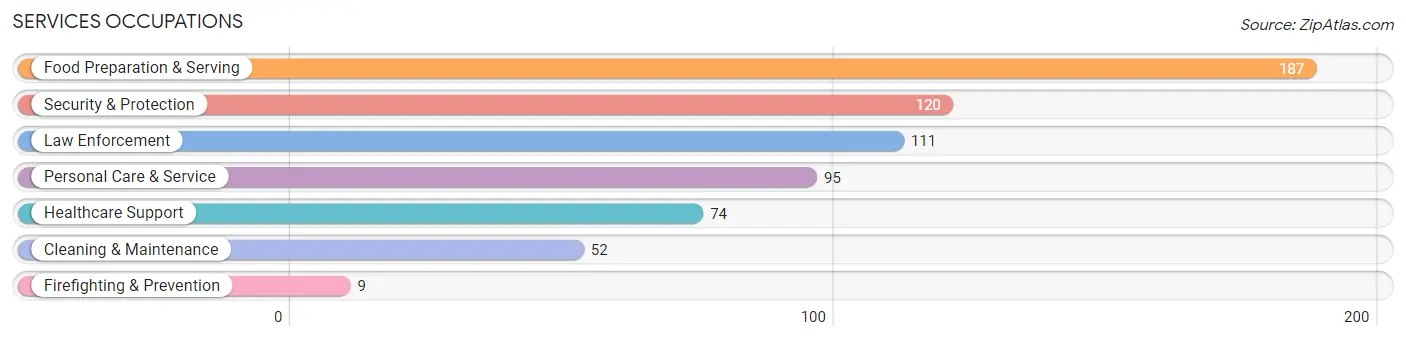
Services Occupations
The most common Services occupations in Burbank are Food Preparation & Serving (187 | 5.8%), Security & Protection (120 | 3.7%), Law Enforcement (111 | 3.4%), Personal Care & Service (95 | 2.9%), and Healthcare Support (74 | 2.3%).
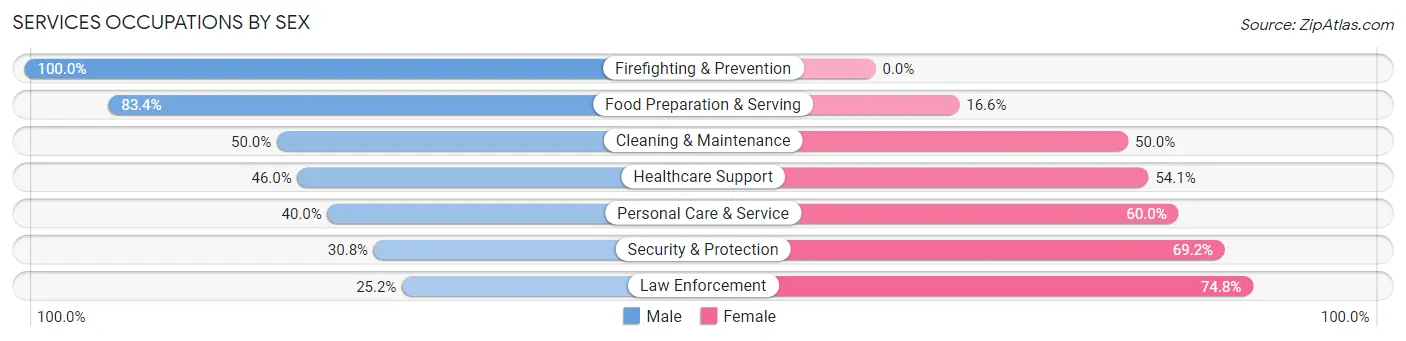
Services Occupations by Sex
Within the Services occupations in Burbank, the most male-oriented occupations are Firefighting & Prevention (100.0%), Food Preparation & Serving (83.4%), and Cleaning & Maintenance (50.0%), while the most female-oriented occupations are Law Enforcement (74.8%), Security & Protection (69.2%), and Personal Care & Service (60.0%).
| Occupation | Male | Female |
| Healthcare Support | 34 (46.0%) | 40 (54.0%) |
| Security & Protection | 37 (30.8%) | 83 (69.2%) |
| Firefighting & Prevention | 9 (100.0%) | 0 (0.0%) |
| Law Enforcement | 28 (25.2%) | 83 (74.8%) |
| Food Preparation & Serving | 156 (83.4%) | 31 (16.6%) |
| Cleaning & Maintenance | 26 (50.0%) | 26 (50.0%) |
| Personal Care & Service | 38 (40.0%) | 57 (60.0%) |
| Total (Category) | 291 (55.1%) | 237 (44.9%) |
| Total (Overall) | 1,776 (54.6%) | 1,474 (45.4%) |
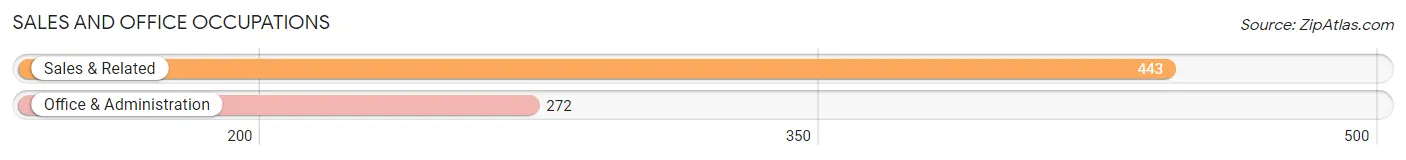
Sales and Office Occupations
The most common Sales and Office occupations in Burbank are Sales & Related (443 | 13.6%), and Office & Administration (272 | 8.4%).
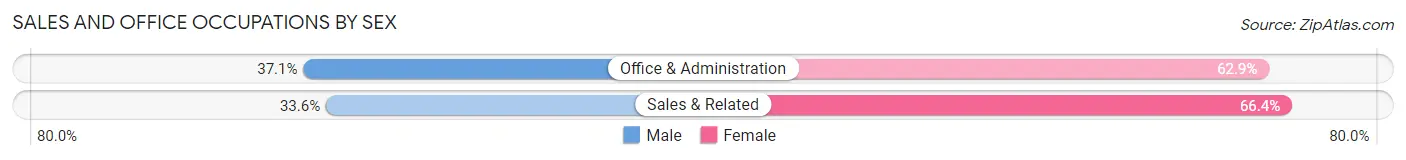
Sales and Office Occupations by Sex
| Occupation | Male | Female |
| Sales & Related | 149 (33.6%) | 294 (66.4%) |
| Office & Administration | 101 (37.1%) | 171 (62.9%) |
| Total (Category) | 250 (35.0%) | 465 (65.0%) |
| Total (Overall) | 1,776 (54.6%) | 1,474 (45.4%) |
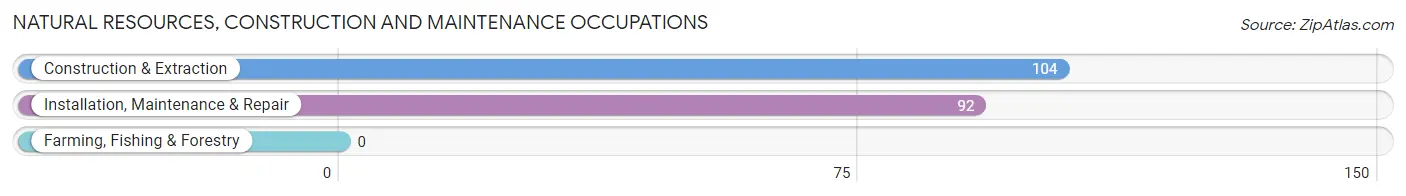
Natural Resources, Construction and Maintenance Occupations
The most common Natural Resources, Construction and Maintenance occupations in Burbank are Construction & Extraction (104 | 3.2%), and Installation, Maintenance & Repair (92 | 2.8%).
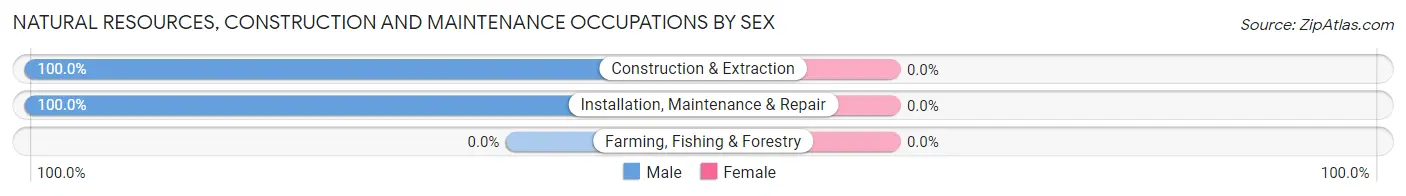
Natural Resources, Construction and Maintenance Occupations by Sex
| Occupation | Male | Female |
| Farming, Fishing & Forestry | 0 (0.0%) | 0 (0.0%) |
| Construction & Extraction | 104 (100.0%) | 0 (0.0%) |
| Installation, Maintenance & Repair | 92 (100.0%) | 0 (0.0%) |
| Total (Category) | 196 (100.0%) | 0 (0.0%) |
| Total (Overall) | 1,776 (54.6%) | 1,474 (45.4%) |
Production, Transportation and Moving Occupations
The most common Production, Transportation and Moving occupations in Burbank are Material Moving (242 | 7.4%), Production (89 | 2.7%), and Transportation (47 | 1.5%).
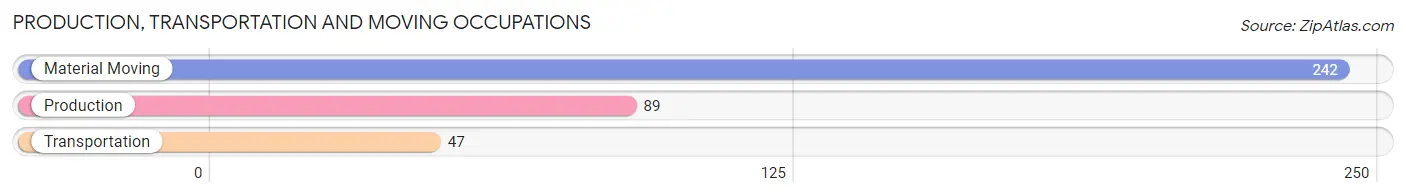
Production, Transportation and Moving Occupations by Sex
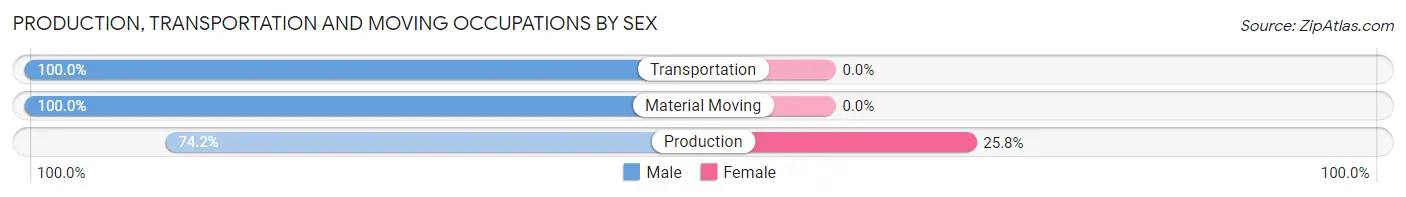
| Occupation | Male | Female |
| Production | 66 (74.2%) | 23 (25.8%) |
| Transportation | 47 (100.0%) | 0 (0.0%) |
| Material Moving | 242 (100.0%) | 0 (0.0%) |
| Total (Category) | 355 (93.9%) | 23 (6.1%) |
| Total (Overall) | 1,776 (54.6%) | 1,474 (45.4%) |
Employment Industries by Sex in Burbank
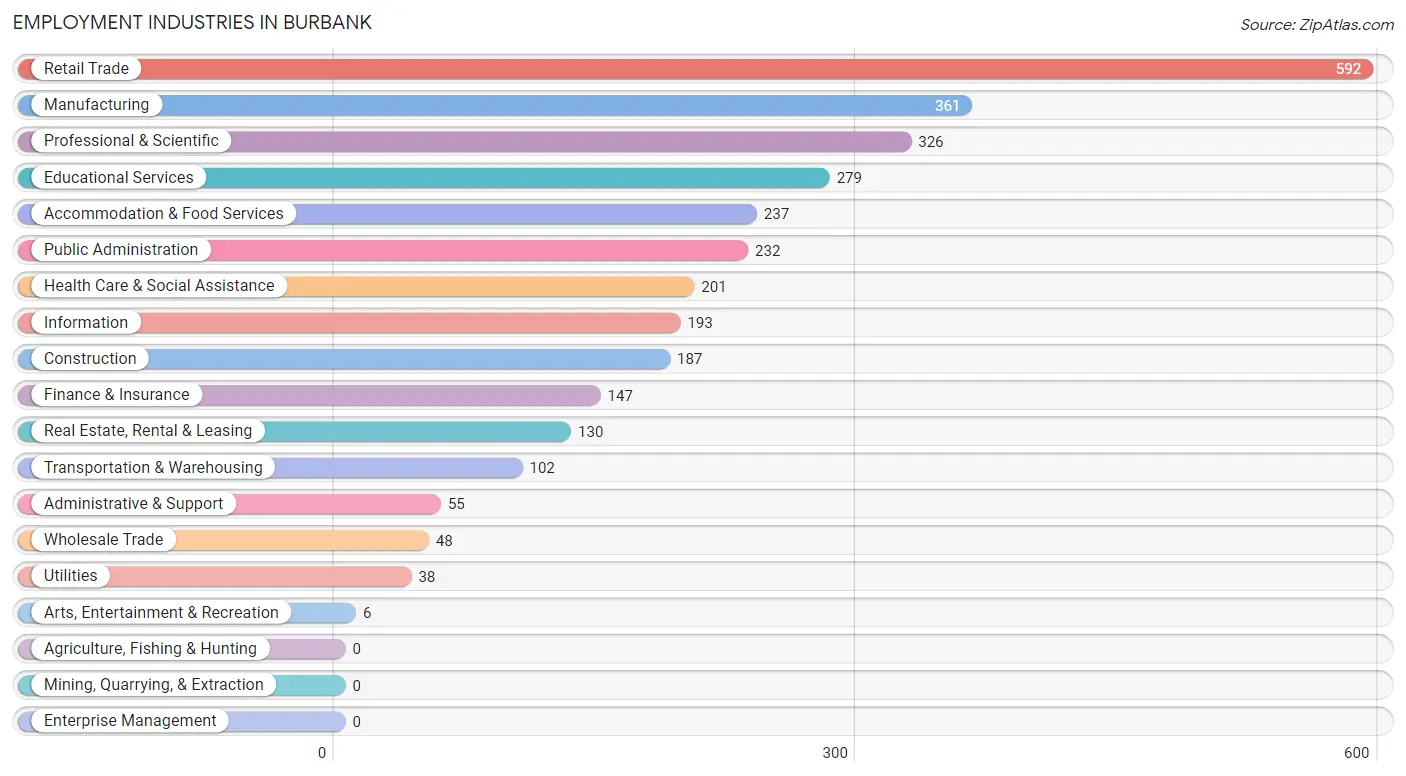
Employment Industries in Burbank
The major employment industries in Burbank include Retail Trade (592 | 18.2%), Manufacturing (361 | 11.1%), Professional & Scientific (326 | 10.0%), Educational Services (279 | 8.6%), and Accommodation & Food Services (237 | 7.3%).
Employment Industries by Sex in Burbank
The Burbank industries that see more men than women are Utilities (100.0%), Construction (87.2%), and Accommodation & Food Services (78.1%), whereas the industries that tend to have a higher number of women are Arts, Entertainment & Recreation (100.0%), Health Care & Social Assistance (76.6%), and Wholesale Trade (75.0%).
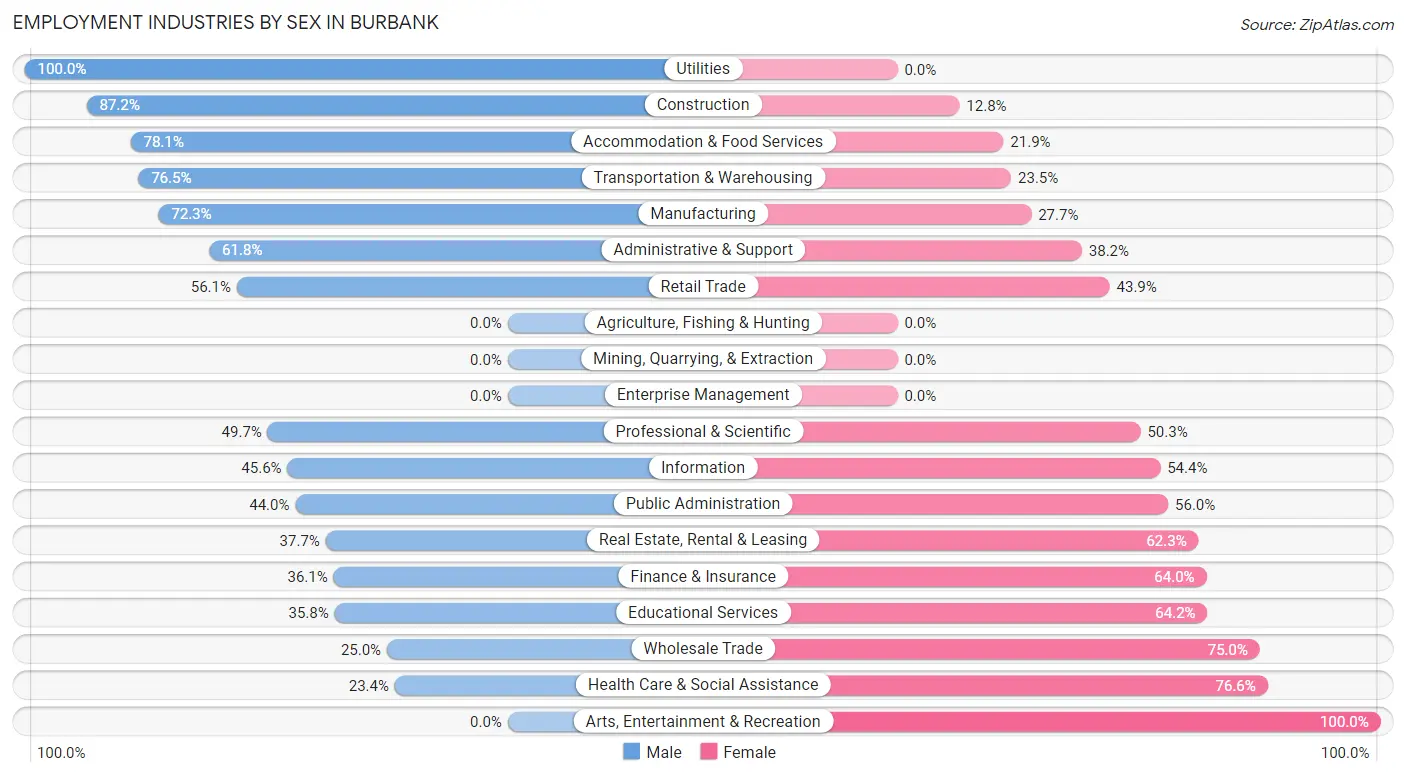
| Industry | Male | Female |
| Agriculture, Fishing & Hunting | 0 (0.0%) | 0 (0.0%) |
| Mining, Quarrying, & Extraction | 0 (0.0%) | 0 (0.0%) |
| Construction | 163 (87.2%) | 24 (12.8%) |
| Manufacturing | 261 (72.3%) | 100 (27.7%) |
| Wholesale Trade | 12 (25.0%) | 36 (75.0%) |
| Retail Trade | 332 (56.1%) | 260 (43.9%) |
| Transportation & Warehousing | 78 (76.5%) | 24 (23.5%) |
| Utilities | 38 (100.0%) | 0 (0.0%) |
| Information | 88 (45.6%) | 105 (54.4%) |
| Finance & Insurance | 53 (36.0%) | 94 (63.9%) |
| Real Estate, Rental & Leasing | 49 (37.7%) | 81 (62.3%) |
| Professional & Scientific | 162 (49.7%) | 164 (50.3%) |
| Enterprise Management | 0 (0.0%) | 0 (0.0%) |
| Administrative & Support | 34 (61.8%) | 21 (38.2%) |
| Educational Services | 100 (35.8%) | 179 (64.2%) |
| Health Care & Social Assistance | 47 (23.4%) | 154 (76.6%) |
| Arts, Entertainment & Recreation | 0 (0.0%) | 6 (100.0%) |
| Accommodation & Food Services | 185 (78.1%) | 52 (21.9%) |
| Public Administration | 102 (44.0%) | 130 (56.0%) |
| Total | 1,776 (54.6%) | 1,474 (45.4%) |
Education in Burbank
School Enrollment in Burbank
The most common levels of schooling among the 1,154 students in Burbank are middle school (331 | 28.7%), college / undergraduate (232 | 20.1%), and high school (229 | 19.8%).
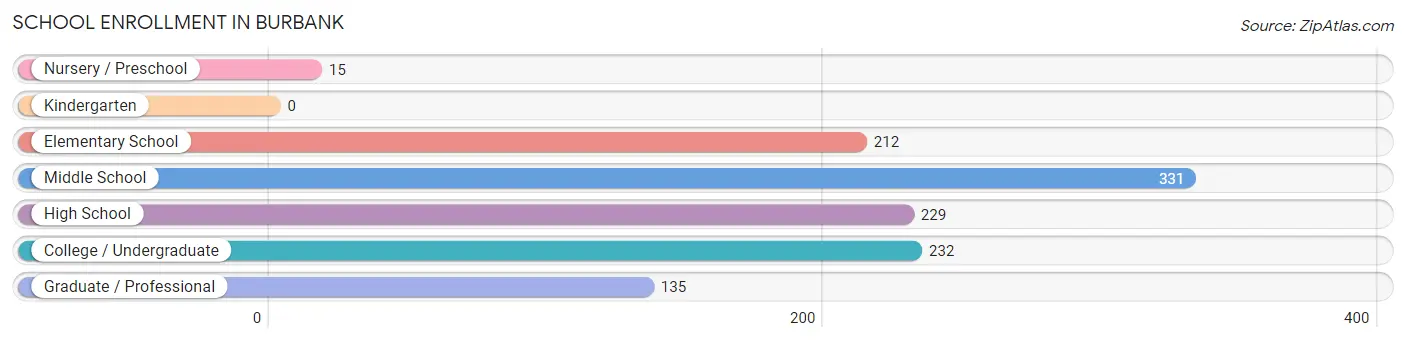
| School Level | # Students | % Students |
| Nursery / Preschool | 15 | 1.3% |
| Kindergarten | 0 | 0.0% |
| Elementary School | 212 | 18.4% |
| Middle School | 331 | 28.7% |
| High School | 229 | 19.8% |
| College / Undergraduate | 232 | 20.1% |
| Graduate / Professional | 135 | 11.7% |
| Total | 1,154 | 100.0% |
School Enrollment by Age by Funding Source in Burbank
Out of a total of 1,154 students who are enrolled in schools in Burbank, 263 (22.8%) attend a private institution, while the remaining 891 (77.2%) are enrolled in public schools. The age group of 5 to 9 year old has the highest likelihood of being enrolled in private schools, with 145 (68.4% in the age bracket) enrolled. Conversely, the age group of 18 to 19 year olds has the lowest likelihood of being enrolled in a private school, with 146 (100.0% in the age bracket) attending a public institution.
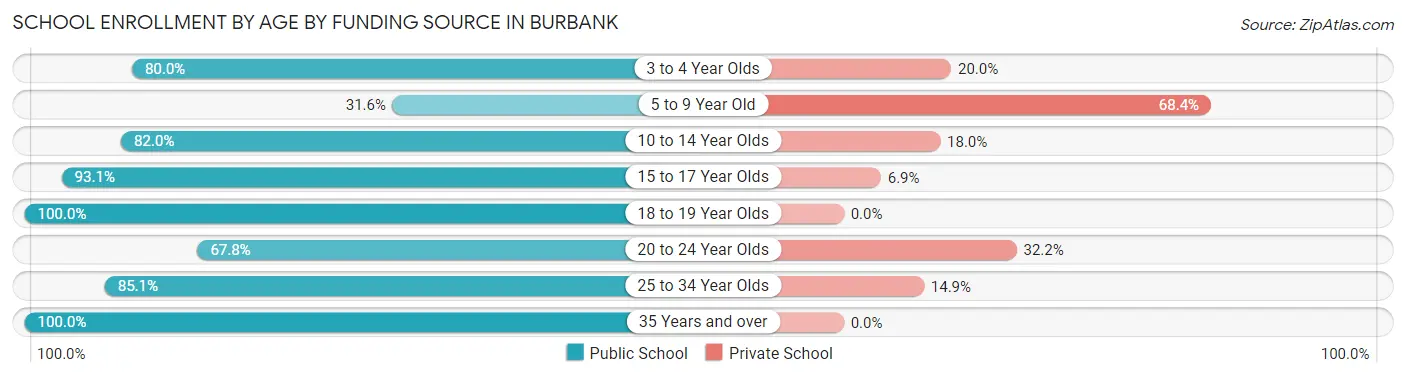
| Age Bracket | Public School | Private School |
| 3 to 4 Year Olds | 12 (80.0%) | 3 (20.0%) |
| 5 to 9 Year Old | 67 (31.6%) | 145 (68.4%) |
| 10 to 14 Year Olds | 274 (82.0%) | 60 (18.0%) |
| 15 to 17 Year Olds | 175 (93.1%) | 13 (6.9%) |
| 18 to 19 Year Olds | 146 (100.0%) | 0 (0.0%) |
| 20 to 24 Year Olds | 40 (67.8%) | 19 (32.2%) |
| 25 to 34 Year Olds | 131 (85.1%) | 23 (14.9%) |
| 35 Years and over | 46 (100.0%) | 0 (0.0%) |
| Total | 891 (77.2%) | 263 (22.8%) |
Educational Attainment by Field of Study in Burbank
Engineering (350 | 18.9%), business (237 | 12.8%), science & technology (225 | 12.1%), communications (203 | 11.0%), and physical & health sciences (145 | 7.8%) are the most common fields of study among 1,854 individuals in Burbank who have obtained a bachelor's degree or higher.
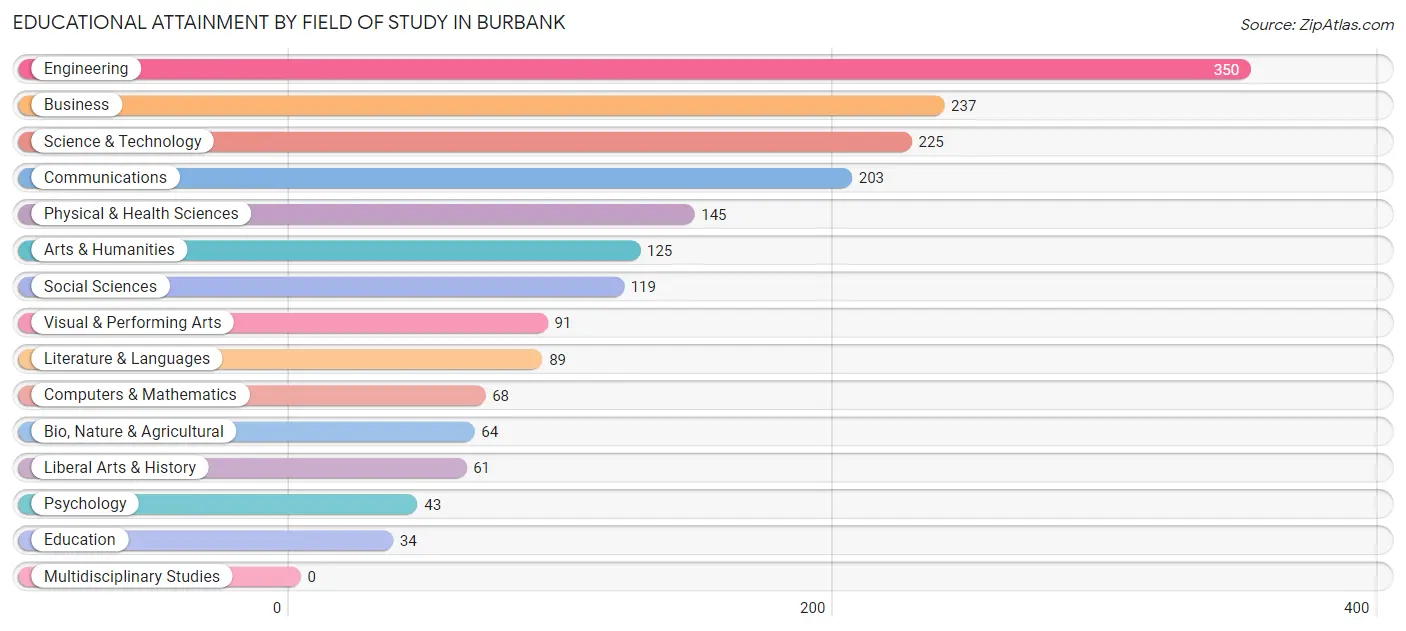
| Field of Study | # Graduates | % Graduates |
| Computers & Mathematics | 68 | 3.7% |
| Bio, Nature & Agricultural | 64 | 3.5% |
| Physical & Health Sciences | 145 | 7.8% |
| Psychology | 43 | 2.3% |
| Social Sciences | 119 | 6.4% |
| Engineering | 350 | 18.9% |
| Multidisciplinary Studies | 0 | 0.0% |
| Science & Technology | 225 | 12.1% |
| Business | 237 | 12.8% |
| Education | 34 | 1.8% |
| Literature & Languages | 89 | 4.8% |
| Liberal Arts & History | 61 | 3.3% |
| Visual & Performing Arts | 91 | 4.9% |
| Communications | 203 | 11.0% |
| Arts & Humanities | 125 | 6.7% |
| Total | 1,854 | 100.0% |
Transportation & Commute in Burbank
Vehicle Availability by Sex in Burbank
The most prevalent vehicle ownership categories in Burbank are males with 3 vehicles (674, accounting for 38.3%) and females with 3 vehicles (346, making up 46.9%).
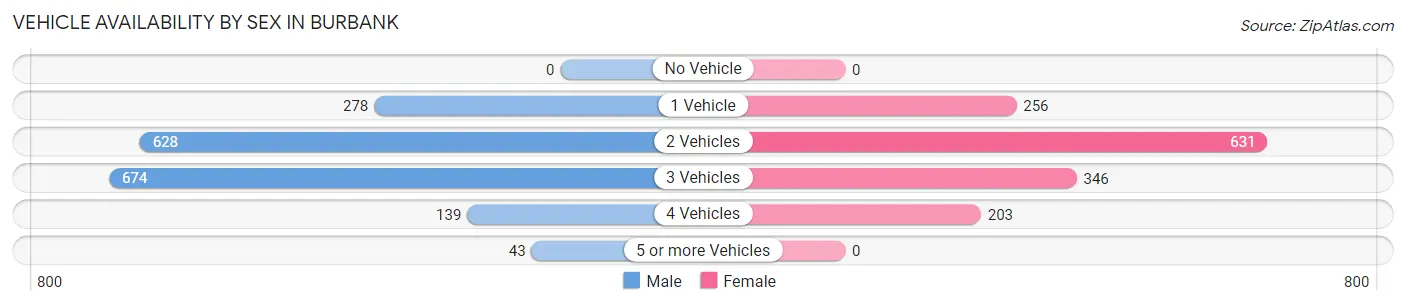
| Vehicles Available | Male | Female |
| No Vehicle | 0 (0.0%) | 0 (0.0%) |
| 1 Vehicle | 278 (15.8%) | 256 (17.8%) |
| 2 Vehicles | 628 (35.6%) | 631 (43.9%) |
| 3 Vehicles | 674 (38.3%) | 346 (24.1%) |
| 4 Vehicles | 139 (7.9%) | 203 (14.1%) |
| 5 or more Vehicles | 43 (2.4%) | 0 (0.0%) |
| Total | 1,762 (100.0%) | 1,436 (100.0%) |
Commute Time in Burbank
The most frequently occuring commute durations in Burbank are 10 to 14 minutes (495 commuters, 18.4%), 20 to 24 minutes (479 commuters, 17.8%), and 15 to 19 minutes (463 commuters, 17.2%).
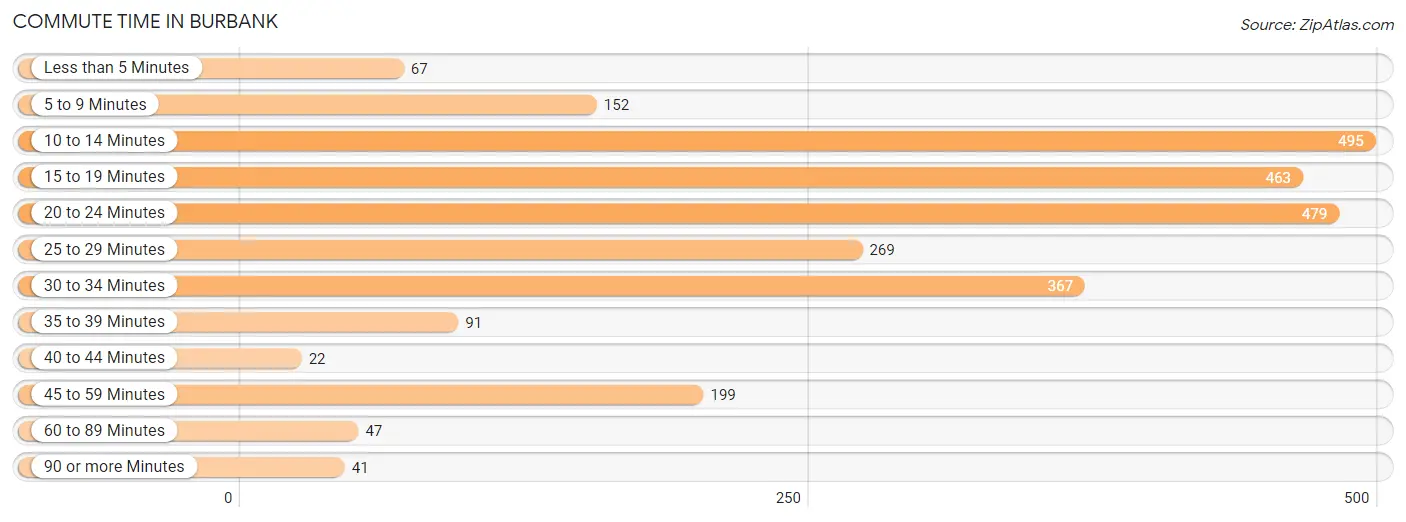
| Commute Time | # Commuters | % Commuters |
| Less than 5 Minutes | 67 | 2.5% |
| 5 to 9 Minutes | 152 | 5.7% |
| 10 to 14 Minutes | 495 | 18.4% |
| 15 to 19 Minutes | 463 | 17.2% |
| 20 to 24 Minutes | 479 | 17.8% |
| 25 to 29 Minutes | 269 | 10.0% |
| 30 to 34 Minutes | 367 | 13.6% |
| 35 to 39 Minutes | 91 | 3.4% |
| 40 to 44 Minutes | 22 | 0.8% |
| 45 to 59 Minutes | 199 | 7.4% |
| 60 to 89 Minutes | 47 | 1.8% |
| 90 or more Minutes | 41 | 1.5% |
Commute Time by Sex in Burbank
The most common commute times in Burbank are 20 to 24 minutes (343 commuters, 21.0%) for males and 10 to 14 minutes (300 commuters, 28.2%) for females.
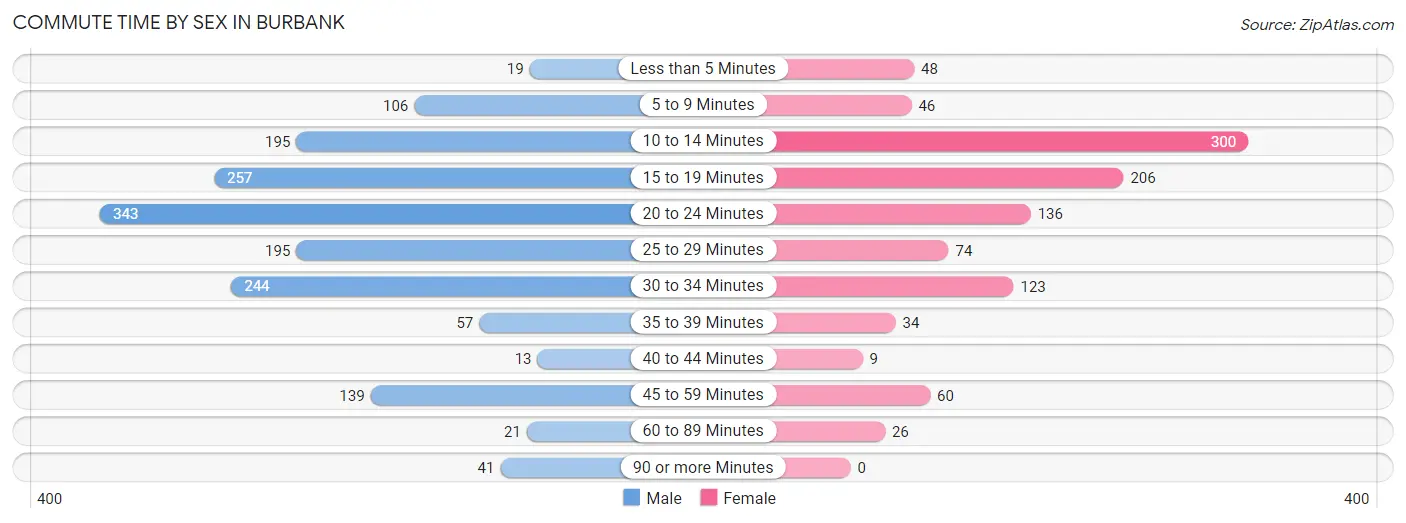
| Commute Time | Male | Female |
| Less than 5 Minutes | 19 (1.2%) | 48 (4.5%) |
| 5 to 9 Minutes | 106 (6.5%) | 46 (4.3%) |
| 10 to 14 Minutes | 195 (12.0%) | 300 (28.2%) |
| 15 to 19 Minutes | 257 (15.8%) | 206 (19.4%) |
| 20 to 24 Minutes | 343 (21.0%) | 136 (12.8%) |
| 25 to 29 Minutes | 195 (12.0%) | 74 (7.0%) |
| 30 to 34 Minutes | 244 (15.0%) | 123 (11.6%) |
| 35 to 39 Minutes | 57 (3.5%) | 34 (3.2%) |
| 40 to 44 Minutes | 13 (0.8%) | 9 (0.9%) |
| 45 to 59 Minutes | 139 (8.5%) | 60 (5.7%) |
| 60 to 89 Minutes | 21 (1.3%) | 26 (2.5%) |
| 90 or more Minutes | 41 (2.5%) | 0 (0.0%) |
Time of Departure to Work by Sex in Burbank
The most frequent times of departure to work in Burbank are 7:00 AM to 7:29 AM (331, 20.3%) for males and 9:00 AM to 9:59 AM (213, 20.1%) for females.
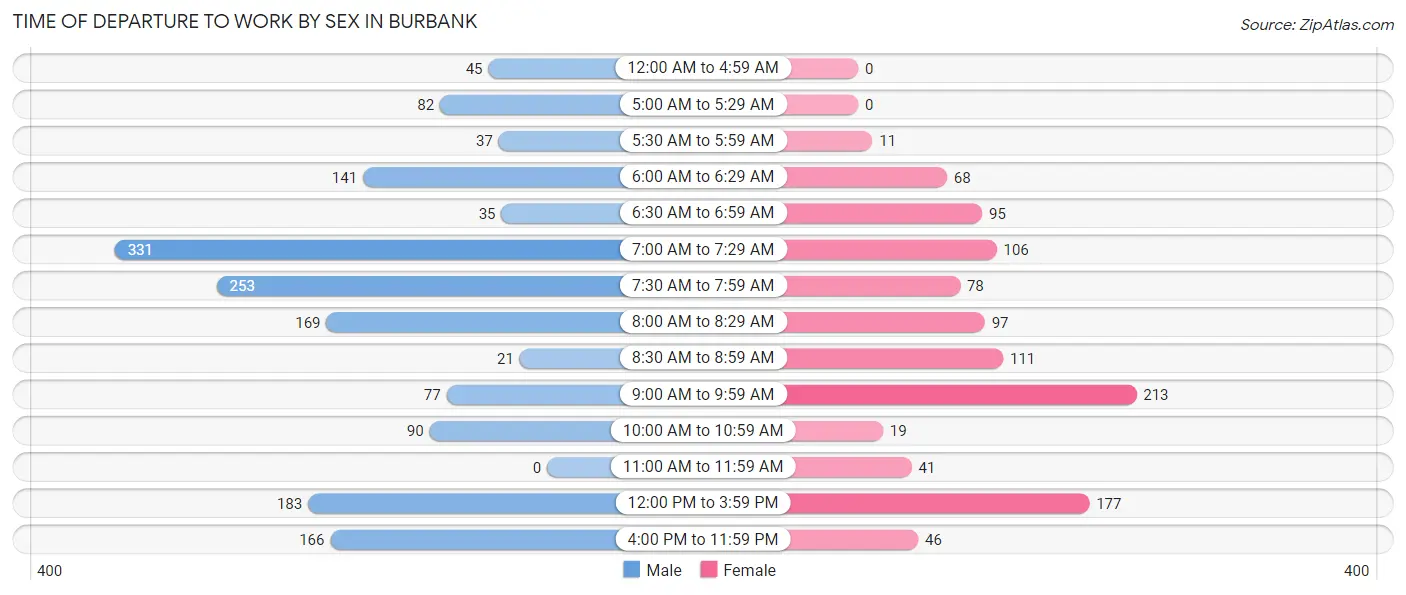
| Time of Departure | Male | Female |
| 12:00 AM to 4:59 AM | 45 (2.8%) | 0 (0.0%) |
| 5:00 AM to 5:29 AM | 82 (5.0%) | 0 (0.0%) |
| 5:30 AM to 5:59 AM | 37 (2.3%) | 11 (1.0%) |
| 6:00 AM to 6:29 AM | 141 (8.6%) | 68 (6.4%) |
| 6:30 AM to 6:59 AM | 35 (2.1%) | 95 (8.9%) |
| 7:00 AM to 7:29 AM | 331 (20.3%) | 106 (10.0%) |
| 7:30 AM to 7:59 AM | 253 (15.5%) | 78 (7.3%) |
| 8:00 AM to 8:29 AM | 169 (10.4%) | 97 (9.1%) |
| 8:30 AM to 8:59 AM | 21 (1.3%) | 111 (10.4%) |
| 9:00 AM to 9:59 AM | 77 (4.7%) | 213 (20.1%) |
| 10:00 AM to 10:59 AM | 90 (5.5%) | 19 (1.8%) |
| 11:00 AM to 11:59 AM | 0 (0.0%) | 41 (3.9%) |
| 12:00 PM to 3:59 PM | 183 (11.2%) | 177 (16.7%) |
| 4:00 PM to 11:59 PM | 166 (10.2%) | 46 (4.3%) |
| Total | 1,630 (100.0%) | 1,062 (100.0%) |
Housing Occupancy in Burbank
Occupancy by Ownership in Burbank
Of the total 1,994 dwellings in Burbank, owner-occupied units account for 1,185 (59.4%), while renter-occupied units make up 809 (40.6%).
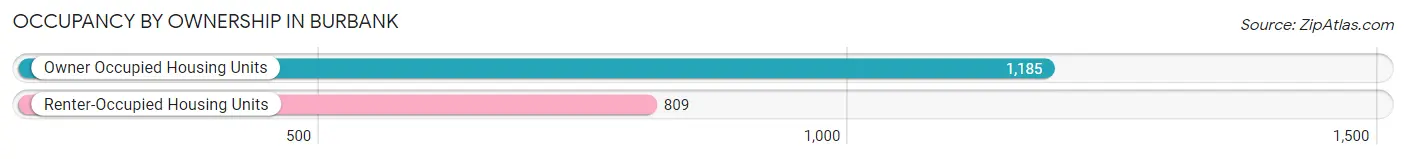
| Occupancy | # Housing Units | % Housing Units |
| Owner Occupied Housing Units | 1,185 | 59.4% |
| Renter-Occupied Housing Units | 809 | 40.6% |
| Total Occupied Housing Units | 1,994 | 100.0% |
Occupancy by Household Size in Burbank
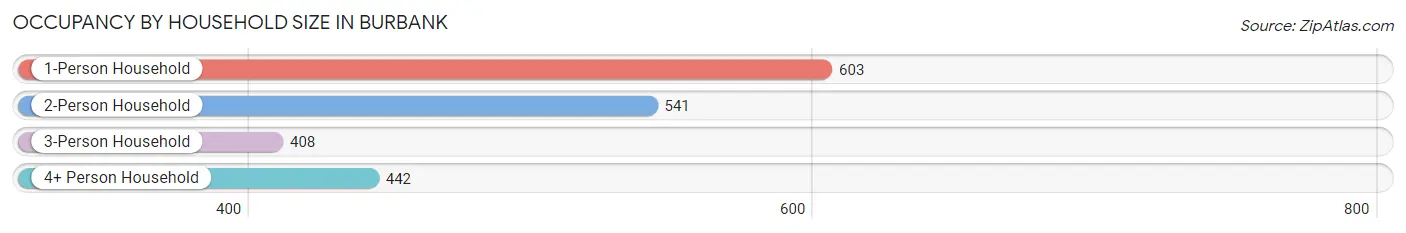
| Household Size | # Housing Units | % Housing Units |
| 1-Person Household | 603 | 30.2% |
| 2-Person Household | 541 | 27.1% |
| 3-Person Household | 408 | 20.5% |
| 4+ Person Household | 442 | 22.2% |
| Total Housing Units | 1,994 | 100.0% |
Occupancy by Ownership by Household Size in Burbank
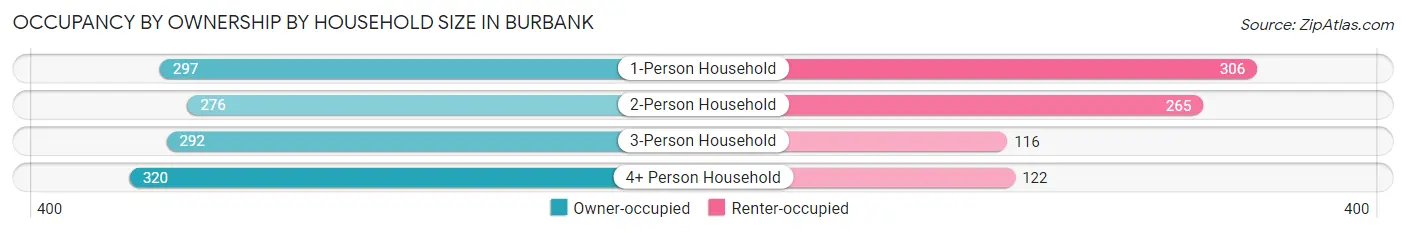
| Household Size | Owner-occupied | Renter-occupied |
| 1-Person Household | 297 (49.2%) | 306 (50.7%) |
| 2-Person Household | 276 (51.0%) | 265 (49.0%) |
| 3-Person Household | 292 (71.6%) | 116 (28.4%) |
| 4+ Person Household | 320 (72.4%) | 122 (27.6%) |
| Total Housing Units | 1,185 (59.4%) | 809 (40.6%) |
Occupancy by Educational Attainment in Burbank
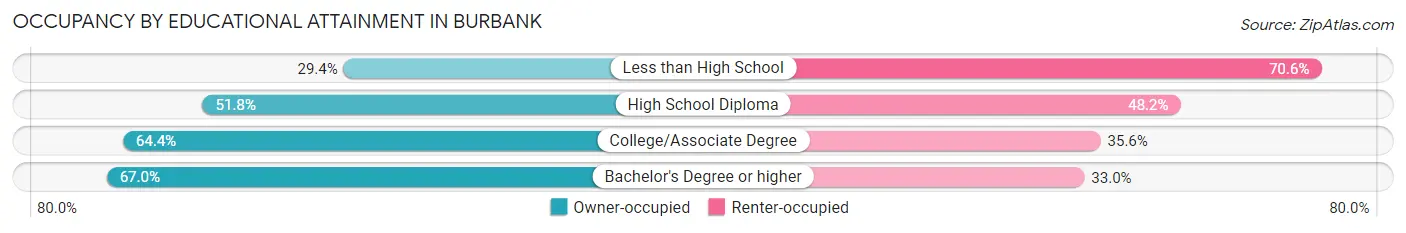
| Household Size | Owner-occupied | Renter-occupied |
| Less than High School | 75 (29.4%) | 180 (70.6%) |
| High School Diploma | 146 (51.8%) | 136 (48.2%) |
| College/Associate Degree | 293 (64.4%) | 162 (35.6%) |
| Bachelor's Degree or higher | 671 (67.0%) | 331 (33.0%) |
Occupancy by Age of Householder in Burbank
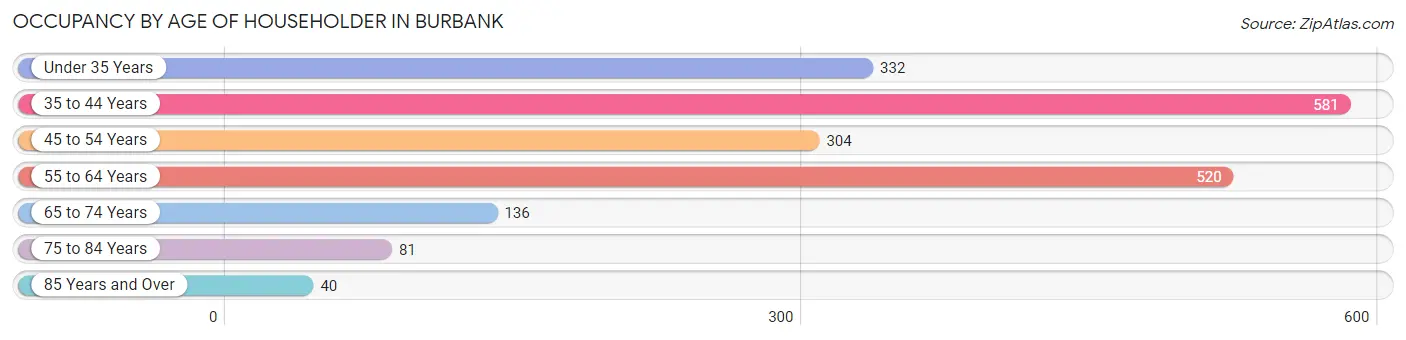
| Age Bracket | # Households | % Households |
| Under 35 Years | 332 | 16.7% |
| 35 to 44 Years | 581 | 29.1% |
| 45 to 54 Years | 304 | 15.2% |
| 55 to 64 Years | 520 | 26.1% |
| 65 to 74 Years | 136 | 6.8% |
| 75 to 84 Years | 81 | 4.1% |
| 85 Years and Over | 40 | 2.0% |
| Total | 1,994 | 100.0% |
Housing Finances in Burbank
Median Income by Occupancy in Burbank
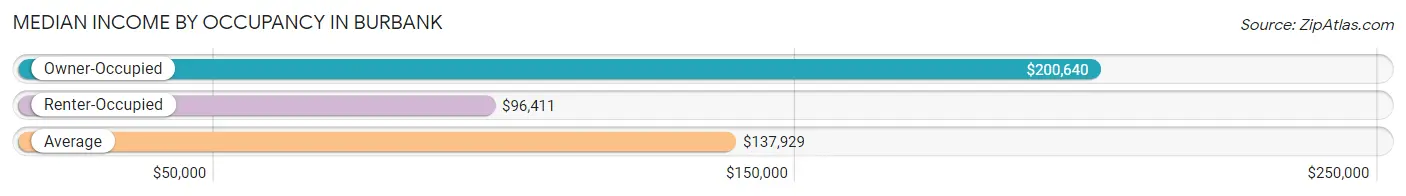
| Occupancy Type | # Households | Median Income |
| Owner-Occupied | 1,185 (59.4%) | $200,640 |
| Renter-Occupied | 809 (40.6%) | $96,411 |
| Average | 1,994 (100.0%) | $137,929 |
Occupancy by Householder Income Bracket in Burbank
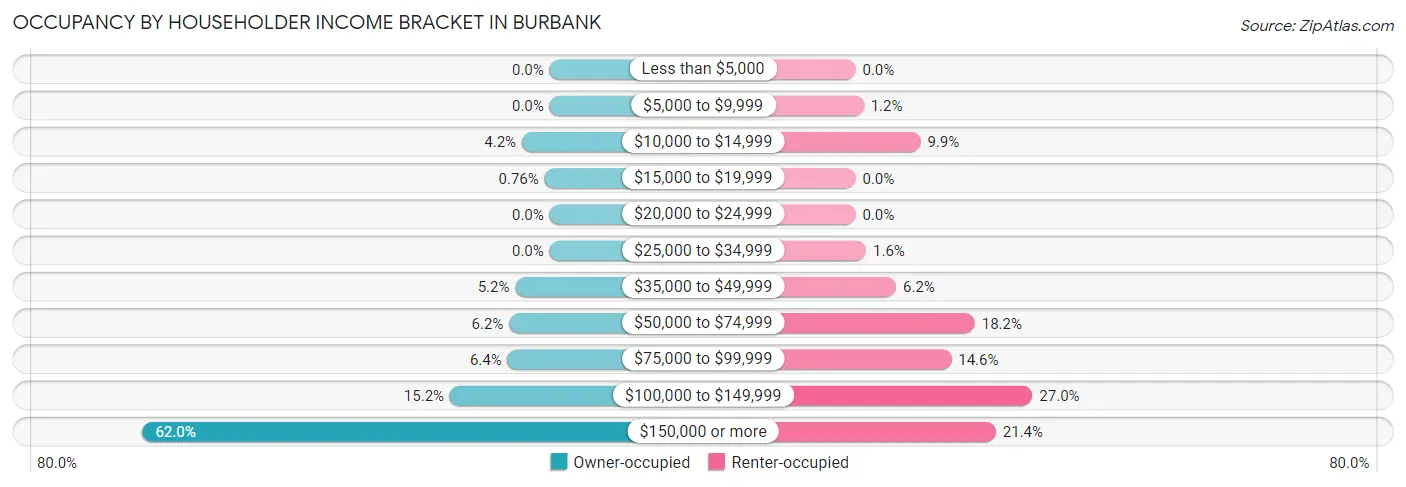
| Income Bracket | Owner-occupied | Renter-occupied |
| Less than $5,000 | 0 (0.0%) | 0 (0.0%) |
| $5,000 to $9,999 | 0 (0.0%) | 10 (1.2%) |
| $10,000 to $14,999 | 50 (4.2%) | 80 (9.9%) |
| $15,000 to $19,999 | 9 (0.8%) | 0 (0.0%) |
| $20,000 to $24,999 | 0 (0.0%) | 0 (0.0%) |
| $25,000 to $34,999 | 0 (0.0%) | 13 (1.6%) |
| $35,000 to $49,999 | 62 (5.2%) | 50 (6.2%) |
| $50,000 to $74,999 | 73 (6.2%) | 147 (18.2%) |
| $75,000 to $99,999 | 76 (6.4%) | 118 (14.6%) |
| $100,000 to $149,999 | 180 (15.2%) | 218 (27.0%) |
| $150,000 or more | 735 (62.0%) | 173 (21.4%) |
| Total | 1,185 (100.0%) | 809 (100.0%) |
Monthly Housing Cost Tiers in Burbank
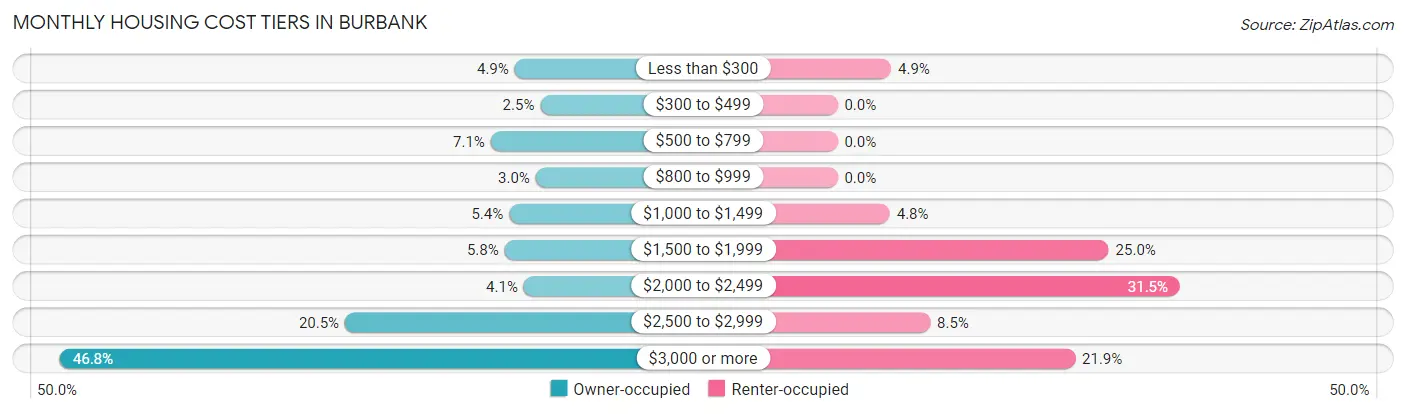
| Monthly Cost | Owner-occupied | Renter-occupied |
| Less than $300 | 58 (4.9%) | 40 (4.9%) |
| $300 to $499 | 30 (2.5%) | 0 (0.0%) |
| $500 to $799 | 84 (7.1%) | 0 (0.0%) |
| $800 to $999 | 35 (2.9%) | 0 (0.0%) |
| $1,000 to $1,499 | 64 (5.4%) | 39 (4.8%) |
| $1,500 to $1,999 | 69 (5.8%) | 202 (25.0%) |
| $2,000 to $2,499 | 48 (4.1%) | 255 (31.5%) |
| $2,500 to $2,999 | 243 (20.5%) | 69 (8.5%) |
| $3,000 or more | 554 (46.8%) | 177 (21.9%) |
| Total | 1,185 (100.0%) | 809 (100.0%) |
Physical Housing Characteristics in Burbank
Housing Structures in Burbank
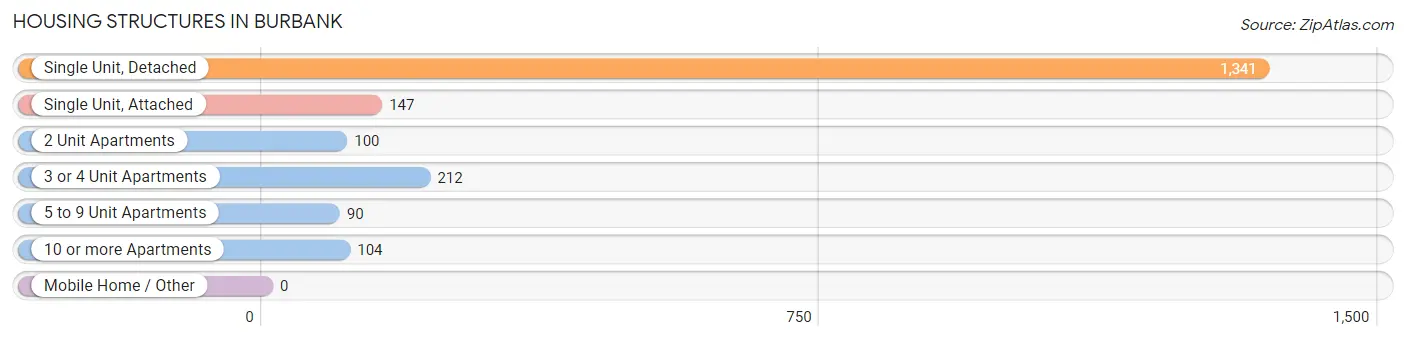
| Structure Type | # Housing Units | % Housing Units |
| Single Unit, Detached | 1,341 | 67.2% |
| Single Unit, Attached | 147 | 7.4% |
| 2 Unit Apartments | 100 | 5.0% |
| 3 or 4 Unit Apartments | 212 | 10.6% |
| 5 to 9 Unit Apartments | 90 | 4.5% |
| 10 or more Apartments | 104 | 5.2% |
| Mobile Home / Other | 0 | 0.0% |
| Total | 1,994 | 100.0% |
Housing Structures by Occupancy in Burbank
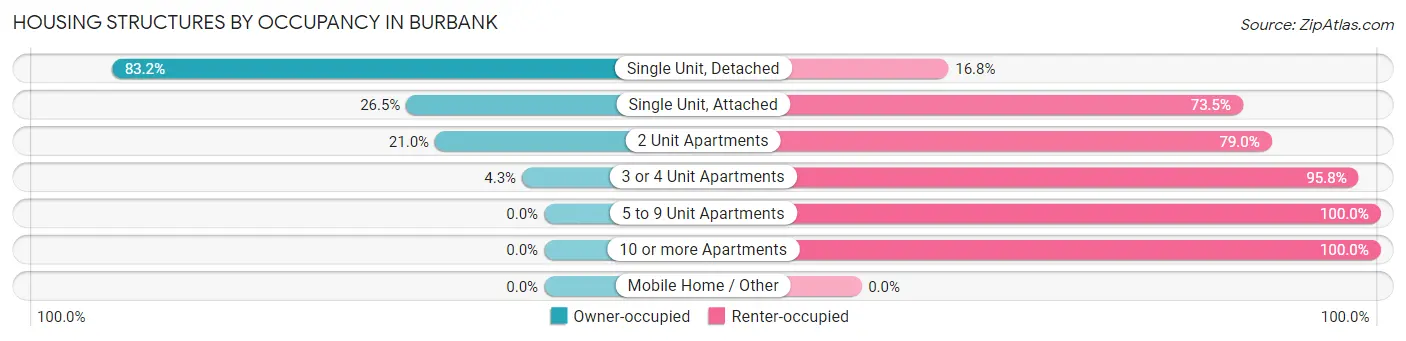
| Structure Type | Owner-occupied | Renter-occupied |
| Single Unit, Detached | 1,116 (83.2%) | 225 (16.8%) |
| Single Unit, Attached | 39 (26.5%) | 108 (73.5%) |
| 2 Unit Apartments | 21 (21.0%) | 79 (79.0%) |
| 3 or 4 Unit Apartments | 9 (4.3%) | 203 (95.8%) |
| 5 to 9 Unit Apartments | 0 (0.0%) | 90 (100.0%) |
| 10 or more Apartments | 0 (0.0%) | 104 (100.0%) |
| Mobile Home / Other | 0 (0.0%) | 0 (0.0%) |
| Total | 1,185 (59.4%) | 809 (40.6%) |
Housing Structures by Number of Rooms in Burbank
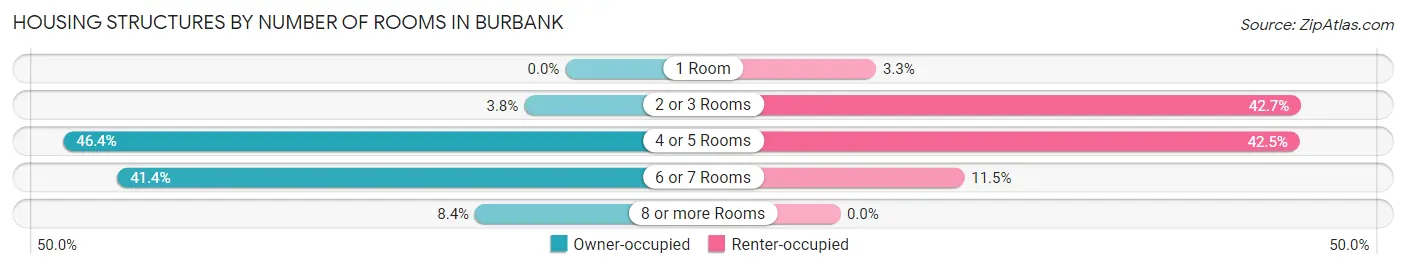
| Number of Rooms | Owner-occupied | Renter-occupied |
| 1 Room | 0 (0.0%) | 27 (3.3%) |
| 2 or 3 Rooms | 45 (3.8%) | 345 (42.6%) |
| 4 or 5 Rooms | 550 (46.4%) | 344 (42.5%) |
| 6 or 7 Rooms | 491 (41.4%) | 93 (11.5%) |
| 8 or more Rooms | 99 (8.4%) | 0 (0.0%) |
| Total | 1,185 (100.0%) | 809 (100.0%) |
Housing Structure by Heating Type in Burbank
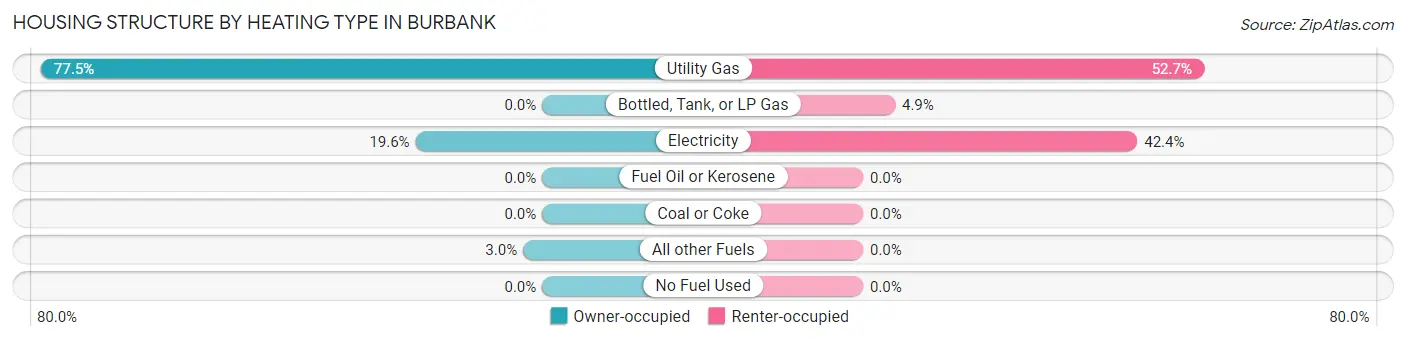
| Heating Type | Owner-occupied | Renter-occupied |
| Utility Gas | 918 (77.5%) | 426 (52.7%) |
| Bottled, Tank, or LP Gas | 0 (0.0%) | 40 (4.9%) |
| Electricity | 232 (19.6%) | 343 (42.4%) |
| Fuel Oil or Kerosene | 0 (0.0%) | 0 (0.0%) |
| Coal or Coke | 0 (0.0%) | 0 (0.0%) |
| All other Fuels | 35 (2.9%) | 0 (0.0%) |
| No Fuel Used | 0 (0.0%) | 0 (0.0%) |
| Total | 1,185 (100.0%) | 809 (100.0%) |
Household Vehicle Usage in Burbank
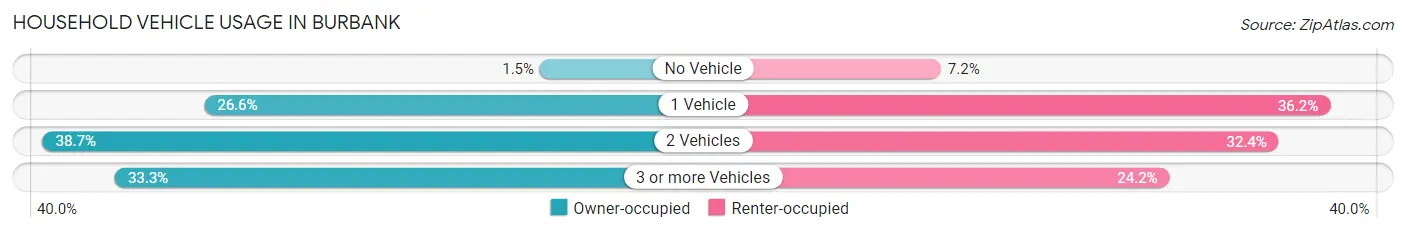
| Vehicles per Household | Owner-occupied | Renter-occupied |
| No Vehicle | 18 (1.5%) | 58 (7.2%) |
| 1 Vehicle | 315 (26.6%) | 293 (36.2%) |
| 2 Vehicles | 458 (38.7%) | 262 (32.4%) |
| 3 or more Vehicles | 394 (33.3%) | 196 (24.2%) |
| Total | 1,185 (100.0%) | 809 (100.0%) |
Real Estate & Mortgages in Burbank
Real Estate and Mortgage Overview in Burbank
| Characteristic | Without Mortgage | With Mortgage |
| Housing Units | 225 | 960 |
| Median Property Value | $929,300 | $1,105,300 |
| Median Household Income | $102,604 | $660 |
| Monthly Housing Costs | $591 | $554 |
| Real Estate Taxes | $5,146 | $9 |
Property Value by Mortgage Status in Burbank
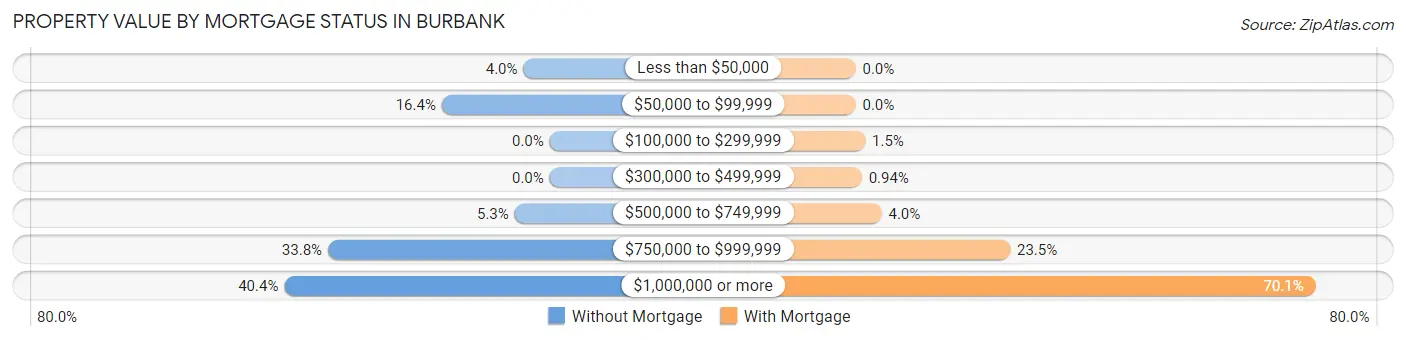
| Property Value | Without Mortgage | With Mortgage |
| Less than $50,000 | 9 (4.0%) | 0 (0.0%) |
| $50,000 to $99,999 | 37 (16.4%) | 0 (0.0%) |
| $100,000 to $299,999 | 0 (0.0%) | 14 (1.5%) |
| $300,000 to $499,999 | 0 (0.0%) | 9 (0.9%) |
| $500,000 to $749,999 | 12 (5.3%) | 38 (4.0%) |
| $750,000 to $999,999 | 76 (33.8%) | 226 (23.5%) |
| $1,000,000 or more | 91 (40.4%) | 673 (70.1%) |
| Total | 225 (100.0%) | 960 (100.0%) |
Household Income by Mortgage Status in Burbank
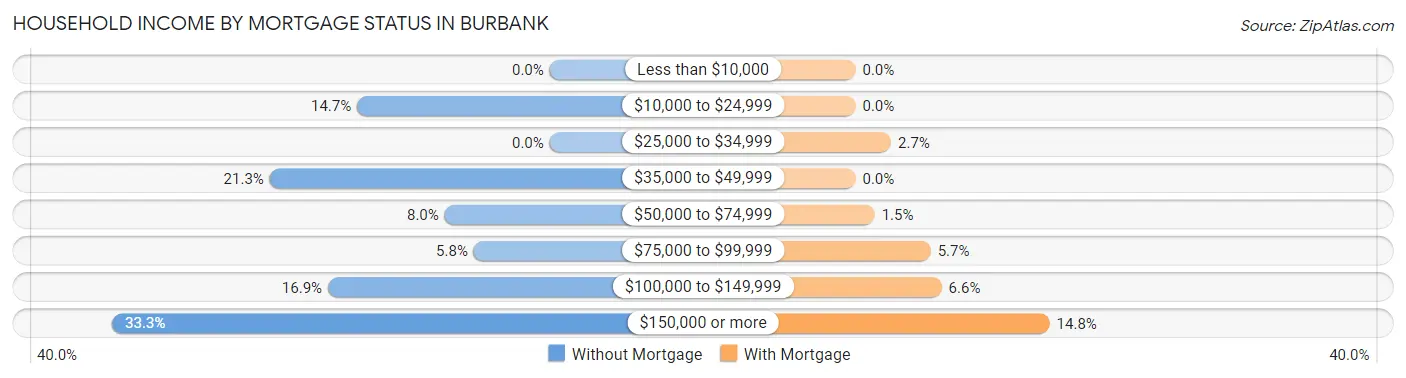
| Household Income | Without Mortgage | With Mortgage |
| Less than $10,000 | 0 (0.0%) | 0 (0.0%) |
| $10,000 to $24,999 | 33 (14.7%) | 0 (0.0%) |
| $25,000 to $34,999 | 0 (0.0%) | 26 (2.7%) |
| $35,000 to $49,999 | 48 (21.3%) | 0 (0.0%) |
| $50,000 to $74,999 | 18 (8.0%) | 14 (1.5%) |
| $75,000 to $99,999 | 13 (5.8%) | 55 (5.7%) |
| $100,000 to $149,999 | 38 (16.9%) | 63 (6.6%) |
| $150,000 or more | 75 (33.3%) | 142 (14.8%) |
| Total | 225 (100.0%) | 960 (100.0%) |
Property Value to Household Income Ratio in Burbank
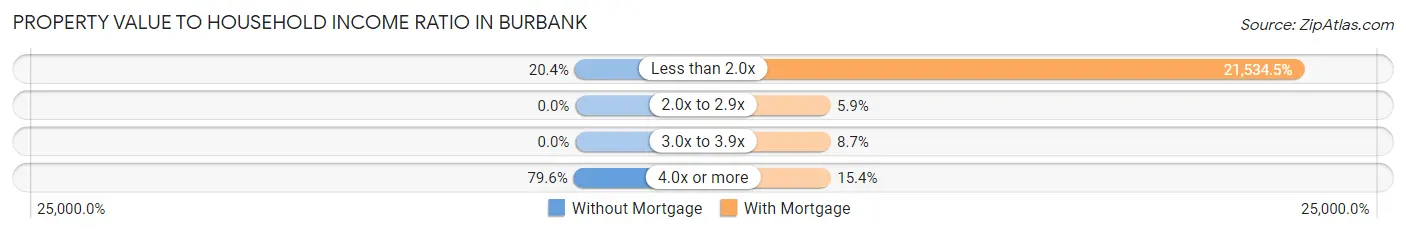
| Value-to-Income Ratio | Without Mortgage | With Mortgage |
| Less than 2.0x | 46 (20.4%) | 206,731 (21,534.5%) |
| 2.0x to 2.9x | 0 (0.0%) | 57 (5.9%) |
| 3.0x to 3.9x | 0 (0.0%) | 83 (8.6%) |
| 4.0x or more | 179 (79.6%) | 148 (15.4%) |
| Total | 225 (100.0%) | 960 (100.0%) |
Real Estate Taxes by Mortgage Status in Burbank
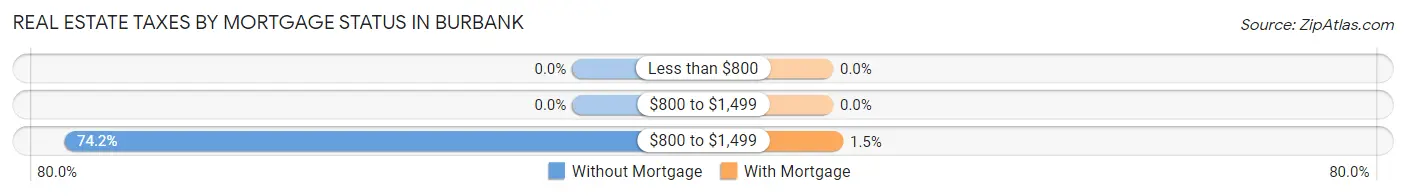
| Property Taxes | Without Mortgage | With Mortgage |
| Less than $800 | 0 (0.0%) | 0 (0.0%) |
| $800 to $1,499 | 0 (0.0%) | 0 (0.0%) |
| $800 to $1,499 | 167 (74.2%) | 14 (1.5%) |
| Total | 225 (100.0%) | 960 (100.0%) |
Health & Disability in Burbank
Health Insurance Coverage by Age in Burbank
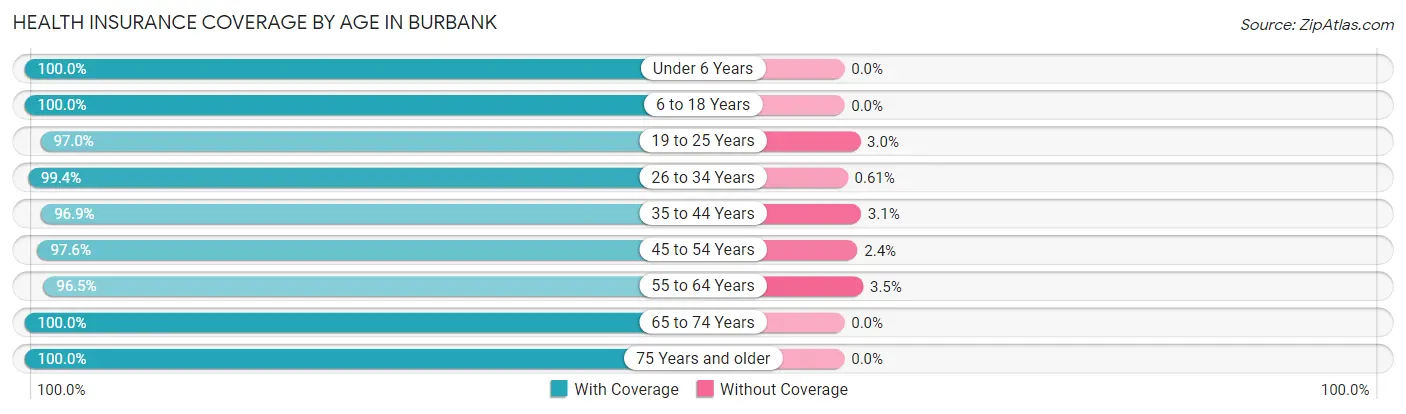
| Age Bracket | With Coverage | Without Coverage |
| Under 6 Years | 361 (100.0%) | 0 (0.0%) |
| 6 to 18 Years | 866 (100.0%) | 0 (0.0%) |
| 19 to 25 Years | 295 (97.0%) | 9 (3.0%) |
| 26 to 34 Years | 819 (99.4%) | 5 (0.6%) |
| 35 to 44 Years | 1,001 (96.9%) | 32 (3.1%) |
| 45 to 54 Years | 521 (97.6%) | 13 (2.4%) |
| 55 to 64 Years | 830 (96.5%) | 30 (3.5%) |
| 65 to 74 Years | 205 (100.0%) | 0 (0.0%) |
| 75 Years and older | 247 (100.0%) | 0 (0.0%) |
| Total | 5,145 (98.3%) | 89 (1.7%) |
Health Insurance Coverage by Citizenship Status in Burbank
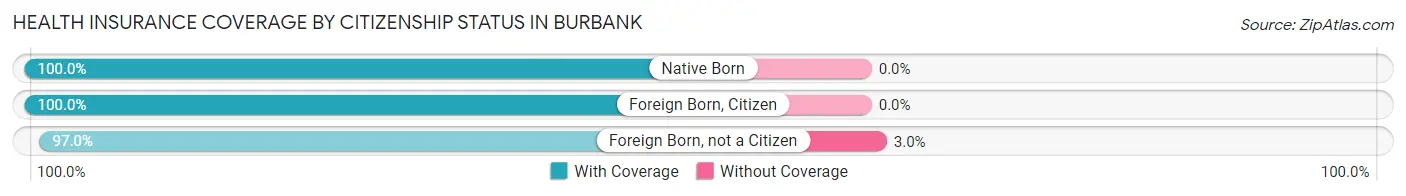
| Citizenship Status | With Coverage | Without Coverage |
| Native Born | 361 (100.0%) | 0 (0.0%) |
| Foreign Born, Citizen | 866 (100.0%) | 0 (0.0%) |
| Foreign Born, not a Citizen | 295 (97.0%) | 9 (3.0%) |
Health Insurance Coverage by Household Income in Burbank
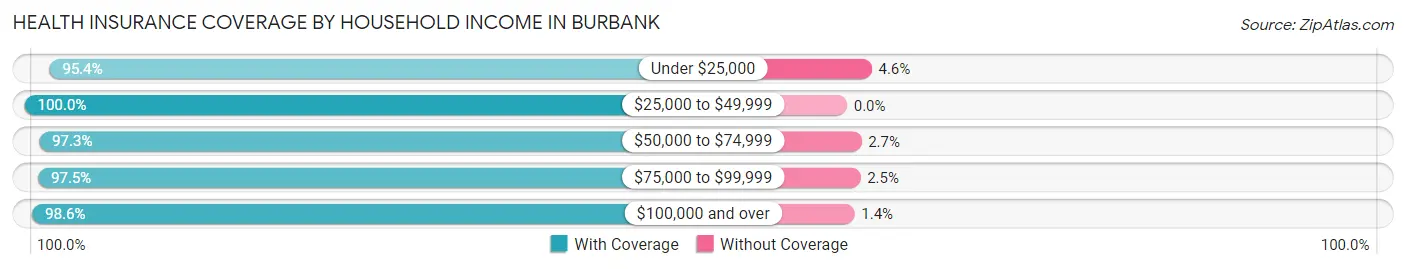
| Household Income | With Coverage | Without Coverage |
| Under $25,000 | 206 (95.4%) | 10 (4.6%) |
| $25,000 to $49,999 | 160 (100.0%) | 0 (0.0%) |
| $50,000 to $74,999 | 468 (97.3%) | 13 (2.7%) |
| $75,000 to $99,999 | 349 (97.5%) | 9 (2.5%) |
| $100,000 and over | 3,962 (98.6%) | 57 (1.4%) |
Public vs Private Health Insurance Coverage by Age in Burbank
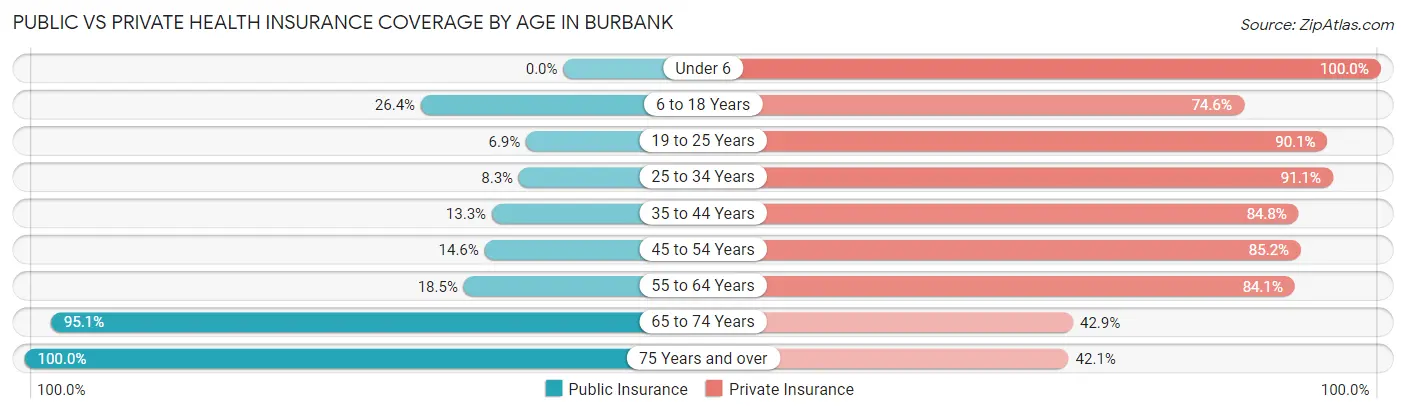
| Age Bracket | Public Insurance | Private Insurance |
| Under 6 | 0 (0.0%) | 361 (100.0%) |
| 6 to 18 Years | 229 (26.4%) | 646 (74.6%) |
| 19 to 25 Years | 21 (6.9%) | 274 (90.1%) |
| 25 to 34 Years | 68 (8.3%) | 751 (91.1%) |
| 35 to 44 Years | 137 (13.3%) | 876 (84.8%) |
| 45 to 54 Years | 78 (14.6%) | 455 (85.2%) |
| 55 to 64 Years | 159 (18.5%) | 723 (84.1%) |
| 65 to 74 Years | 195 (95.1%) | 88 (42.9%) |
| 75 Years and over | 247 (100.0%) | 104 (42.1%) |
| Total | 1,134 (21.7%) | 4,278 (81.7%) |
Disability Status by Sex by Age in Burbank
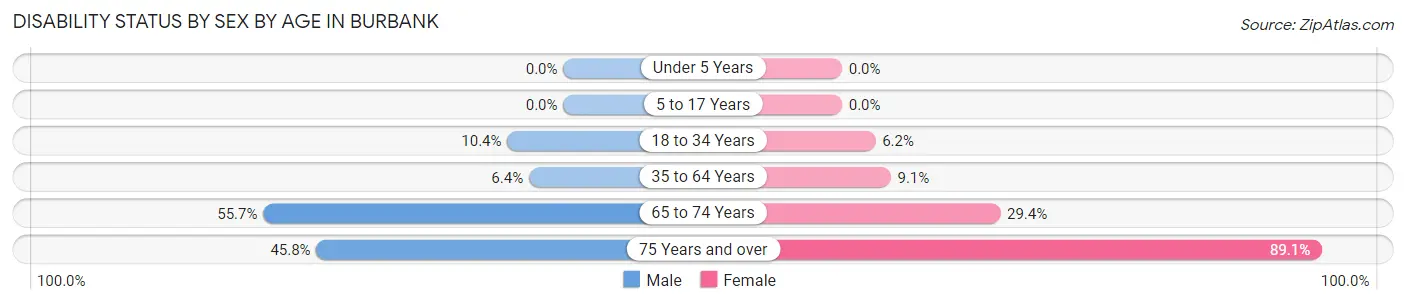
| Age Bracket | Male | Female |
| Under 5 Years | 0 (0.0%) | 0 (0.0%) |
| 5 to 17 Years | 0 (0.0%) | 0 (0.0%) |
| 18 to 34 Years | 74 (10.4%) | 34 (6.2%) |
| 35 to 64 Years | 83 (6.4%) | 102 (9.0%) |
| 65 to 74 Years | 44 (55.7%) | 37 (29.4%) |
| 75 Years and over | 33 (45.8%) | 156 (89.1%) |
Disability Class by Sex by Age in Burbank
Disability Class: Hearing Difficulty
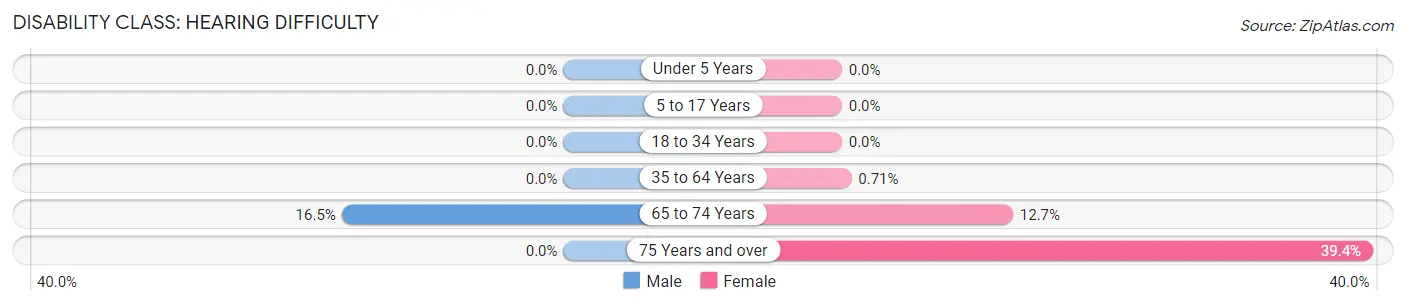
| Age Bracket | Male | Female |
| Under 5 Years | 0 (0.0%) | 0 (0.0%) |
| 5 to 17 Years | 0 (0.0%) | 0 (0.0%) |
| 18 to 34 Years | 0 (0.0%) | 0 (0.0%) |
| 35 to 64 Years | 0 (0.0%) | 8 (0.7%) |
| 65 to 74 Years | 13 (16.5%) | 16 (12.7%) |
| 75 Years and over | 0 (0.0%) | 69 (39.4%) |
Disability Class: Vision Difficulty
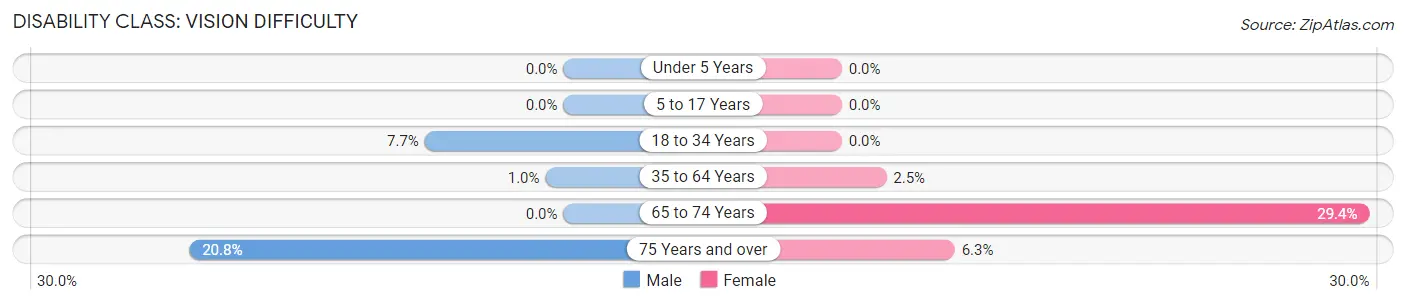
| Age Bracket | Male | Female |
| Under 5 Years | 0 (0.0%) | 0 (0.0%) |
| 5 to 17 Years | 0 (0.0%) | 0 (0.0%) |
| 18 to 34 Years | 55 (7.7%) | 0 (0.0%) |
| 35 to 64 Years | 13 (1.0%) | 28 (2.5%) |
| 65 to 74 Years | 0 (0.0%) | 37 (29.4%) |
| 75 Years and over | 15 (20.8%) | 11 (6.3%) |
Disability Class: Cognitive Difficulty
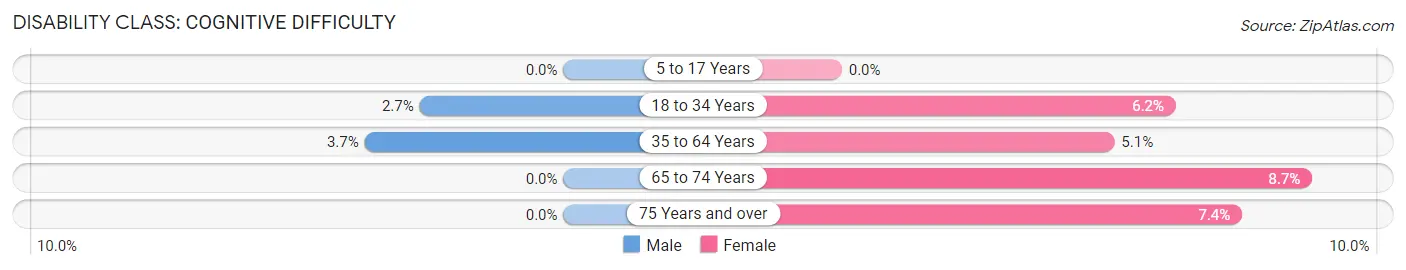
| Age Bracket | Male | Female |
| 5 to 17 Years | 0 (0.0%) | 0 (0.0%) |
| 18 to 34 Years | 19 (2.7%) | 34 (6.2%) |
| 35 to 64 Years | 48 (3.7%) | 57 (5.1%) |
| 65 to 74 Years | 0 (0.0%) | 11 (8.7%) |
| 75 Years and over | 0 (0.0%) | 13 (7.4%) |
Disability Class: Ambulatory Difficulty
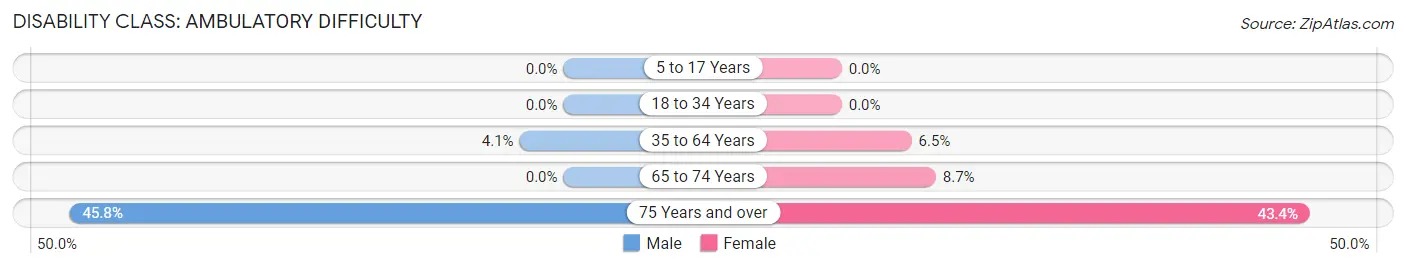
| Age Bracket | Male | Female |
| 5 to 17 Years | 0 (0.0%) | 0 (0.0%) |
| 18 to 34 Years | 0 (0.0%) | 0 (0.0%) |
| 35 to 64 Years | 53 (4.1%) | 73 (6.5%) |
| 65 to 74 Years | 0 (0.0%) | 11 (8.7%) |
| 75 Years and over | 33 (45.8%) | 76 (43.4%) |
Disability Class: Self-Care Difficulty
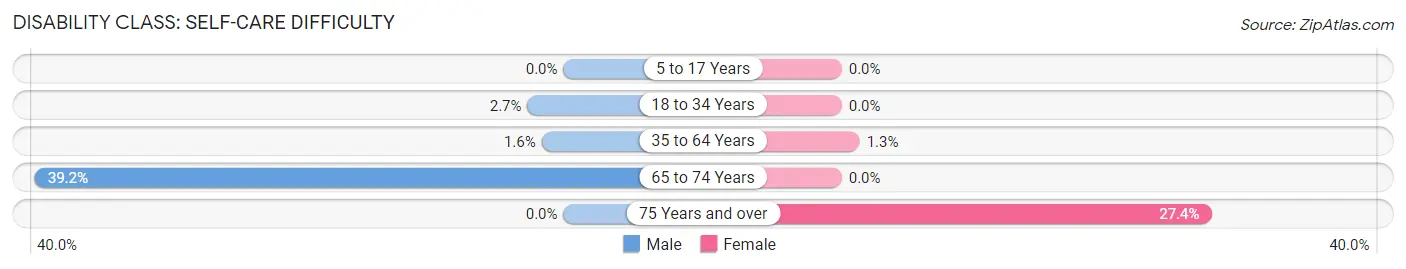
| Age Bracket | Male | Female |
| 5 to 17 Years | 0 (0.0%) | 0 (0.0%) |
| 18 to 34 Years | 19 (2.7%) | 0 (0.0%) |
| 35 to 64 Years | 21 (1.6%) | 15 (1.3%) |
| 65 to 74 Years | 31 (39.2%) | 0 (0.0%) |
| 75 Years and over | 0 (0.0%) | 48 (27.4%) |
Technology Access in Burbank
Computing Device Access in Burbank
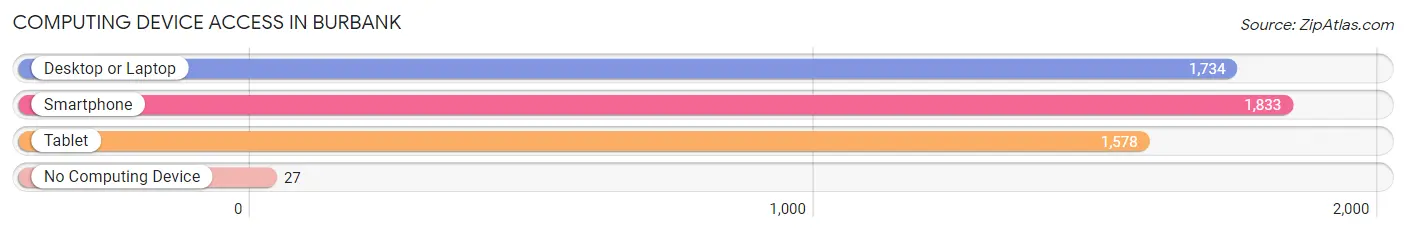
| Device Type | # Households | % Households |
| Desktop or Laptop | 1,734 | 87.0% |
| Smartphone | 1,833 | 91.9% |
| Tablet | 1,578 | 79.1% |
| No Computing Device | 27 | 1.3% |
| Total | 1,994 | 100.0% |
Internet Access in Burbank
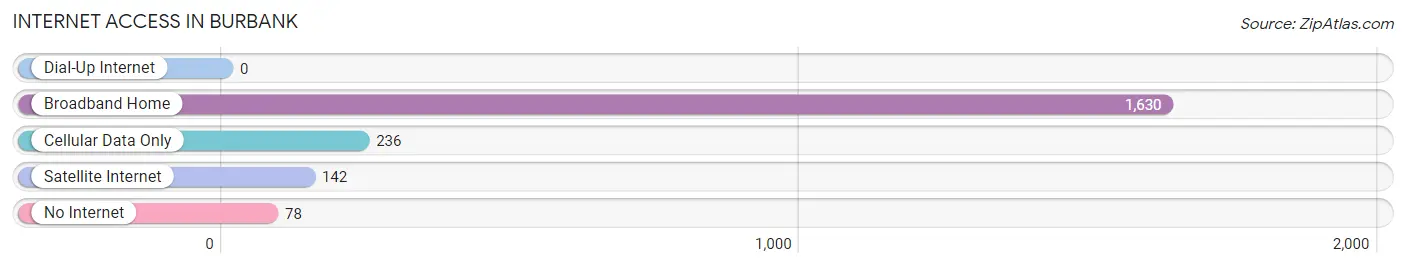
| Internet Type | # Households | % Households |
| Dial-Up Internet | 0 | 0.0% |
| Broadband Home | 1,630 | 81.8% |
| Cellular Data Only | 236 | 11.8% |
| Satellite Internet | 142 | 7.1% |
| No Internet | 78 | 3.9% |
| Total | 1,994 | 100.0% |
Burbank Summary
Burbank, California is a city located in Los Angeles County, California, United States. It is located in the eastern San Fernando Valley, just 8 miles (13 km) northwest of downtown Los Angeles. The population of Burbank was 103,340 at the 2010 census, making it the fifth largest city in Los Angeles County.
History
Burbank was founded in 1887 by David Burbank, a New Hampshire-born dentist and entrepreneur. He purchased over 10,000 acres of land in the San Fernando Valley and began to develop the area. Burbank was incorporated as a city in 1911 and was named after its founder.
In the early 20th century, Burbank became a major center for the motion picture and aviation industries. The first motion picture studio in Burbank was established in 1911 by the Selig Polyscope Company. In the 1920s, the city became home to many of the major Hollywood studios, including Warner Bros., Universal, and Disney.
Geography
Burbank is located in the eastern San Fernando Valley, just 8 miles (13 km) northwest of downtown Los Angeles. The city is bordered by the cities of Glendale to the north, Sun Valley to the northeast, and North Hollywood to the east. The Verdugo Mountains form the eastern border of the city.
Burbank covers an area of 30.2 square miles (78.2 km2). The city has a Mediterranean climate, with hot, dry summers and mild, wet winters. The average annual temperature is 68°F (20°C).
Economy
Burbank is a major center for the entertainment industry. The city is home to many of the major Hollywood studios, including Warner Bros., Universal, and Disney. The city is also home to many television and radio production companies, as well as post-production facilities.
Burbank is also home to many corporate headquarters, including The Walt Disney Company, Warner Music Group, and NBC Universal. The city is also home to many retail stores, restaurants, and other businesses.
Demographics
As of the 2010 census, the population of Burbank was 103,340. The racial makeup of the city was 68.2% White, 8.3% African American, 0.8% Native American, 11.3% Asian, 0.2% Pacific Islander, 6.7% from other races, and 4.5% from two or more races. Hispanic or Latino of any race were 20.2% of the population.
The median household income in Burbank was $60,945 in 2018. The median age of the city was 38.7 years. The city had a poverty rate of 11.3%.
Common Questions
What is Per Capita Income in Burbank?
Per Capita income in Burbank is $66,880.
What is the Median Family Income in Burbank?
Median Family Income in Burbank is $191,190.
What is the Median Household income in Burbank?
Median Household Income in Burbank is $137,929.
What is Income or Wage Gap in Burbank?
Income or Wage Gap in Burbank is 8.5%.
Women in Burbank earn 91.5 cents for every dollar earned by a man.
What is Inequality or Gini Index in Burbank?
Inequality or Gini Index in Burbank is 0.41.
What is the Total Population of Burbank?
Total Population of Burbank is 5,234.
What is the Total Male Population of Burbank?
Total Male Population of Burbank is 2,737.
What is the Total Female Population of Burbank?
Total Female Population of Burbank is 2,497.
What is the Ratio of Males per 100 Females in Burbank?
There are 109.61 Males per 100 Females in Burbank.
What is the Ratio of Females per 100 Males in Burbank?
There are 91.23 Females per 100 Males in Burbank.
What is the Median Population Age in Burbank?
Median Population Age in Burbank is 36.9 Years.
What is the Average Family Size in Burbank
Average Family Size in Burbank is 3.4 People.
What is the Average Household Size in Burbank
Average Household Size in Burbank is 2.6 People.
How Large is the Labor Force in Burbank?
There are 3,313 People in the Labor Forcein in Burbank.
What is the Percentage of People in the Labor Force in Burbank?
78.2% of People are in the Labor Force in Burbank.
What is the Unemployment Rate in Burbank?
Unemployment Rate in Burbank is 2.0%.