Cities with the Highest Percentage of Population Employed in Information in New Mexico
RELATED REPORTS & OPTIONS
Information & Technology
New Mexico
Compare Cities
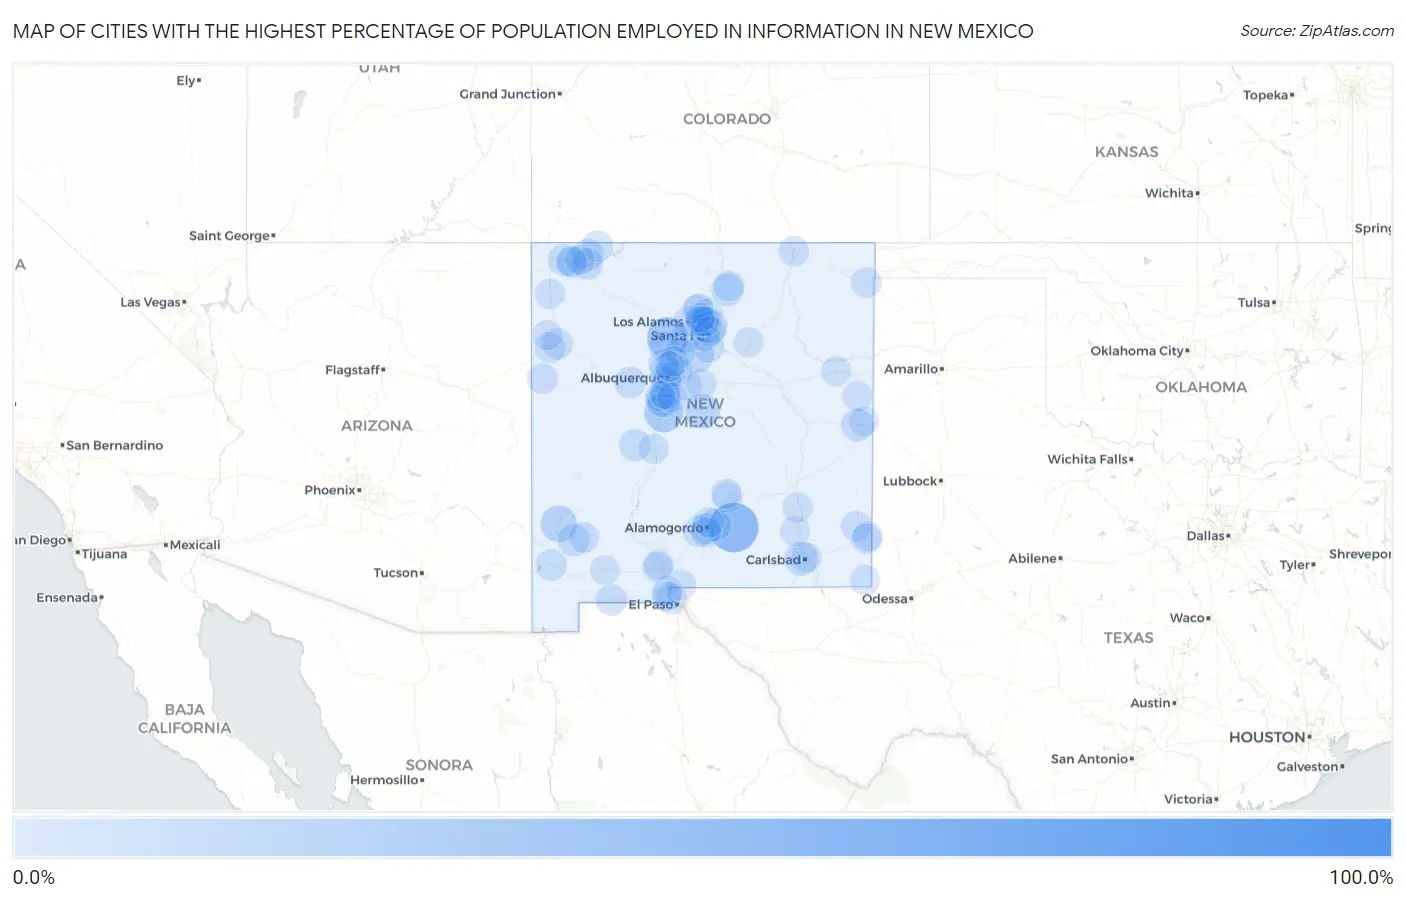
Map of Cities with the Highest Percentage of Population Employed in Information in New Mexico
0.0%
100.0%
Cities with the Highest Percentage of Population Employed in Information in New Mexico
| City | % Employed | vs State | vs National | |
| 1. | Deer Canyon | 100.0% | 1.4%(+98.6)#1 | 1.9%(+98.1)#3 |
| 2. | Mayhill | 47.8% | 1.4%(+46.4)#2 | 1.9%(+45.9)#23 |
| 3. | Ponderosa | 26.9% | 1.4%(+25.5)#3 | 1.9%(+25.0)#68 |
| 4. | Madrone | 22.4% | 1.4%(+21.0)#4 | 1.9%(+20.5)#90 |
| 5. | Gila | 16.0% | 1.4%(+14.6)#5 | 1.9%(+14.1)#170 |
| 6. | Madrid | 13.2% | 1.4%(+11.8)#6 | 1.9%(+11.3)#242 |
| 7. | Willard | 12.0% | 1.4%(+10.6)#7 | 1.9%(+10.1)#289 |
| 8. | Rio En Medio | 11.9% | 1.4%(+10.6)#8 | 1.9%(+10.0)#294 |
| 9. | Happy Valley | 9.8% | 1.4%(+8.41)#9 | 1.9%(+7.90)#410 |
| 10. | White Cliffs | 9.6% | 1.4%(+8.22)#10 | 1.9%(+7.71)#431 |
| 11. | Tome | 8.1% | 1.4%(+6.67)#11 | 1.9%(+6.15)#576 |
| 12. | Cannon Afb | 7.1% | 1.4%(+5.76)#12 | 1.9%(+5.24)#729 |
| 13. | High Rolls | 6.8% | 1.4%(+5.40)#13 | 1.9%(+4.88)#819 |
| 14. | Talpa | 6.7% | 1.4%(+5.27)#14 | 1.9%(+4.76)#846 |
| 15. | Tyrone | 6.6% | 1.4%(+5.23)#15 | 1.9%(+4.72)#856 |
| 16. | Little Walnut | 6.2% | 1.4%(+4.79)#16 | 1.9%(+4.28)#969 |
| 17. | San Antonito Cdp Bernalillo County | 6.2% | 1.4%(+4.78)#17 | 1.9%(+4.27)#975 |
| 18. | Magdalena | 5.8% | 1.4%(+4.37)#18 | 1.9%(+3.86)#1,115 |
| 19. | Waterflow | 5.0% | 1.4%(+3.59)#19 | 1.9%(+3.08)#1,483 |
| 20. | Spencerville | 5.0% | 1.4%(+3.57)#20 | 1.9%(+3.06)#1,496 |
| 21. | San Jose Cdp Rio Arriba County | 4.3% | 1.4%(+2.89)#21 | 1.9%(+2.38)#1,965 |
| 22. | Lordsburg | 4.2% | 1.4%(+2.78)#22 | 1.9%(+2.27)#2,064 |
| 23. | Holloman Afb | 4.1% | 1.4%(+2.74)#23 | 1.9%(+2.23)#2,111 |
| 24. | Mesita | 4.0% | 1.4%(+2.65)#24 | 1.9%(+2.14)#2,193 |
| 25. | Cedar Hill | 3.9% | 1.4%(+2.56)#25 | 1.9%(+2.05)#2,279 |
| 26. | Columbus | 3.9% | 1.4%(+2.52)#26 | 1.9%(+2.01)#2,320 |
| 27. | Upper Fruitland | 3.9% | 1.4%(+2.50)#27 | 1.9%(+1.99)#2,361 |
| 28. | Lee Acres | 3.8% | 1.4%(+2.39)#28 | 1.9%(+1.88)#2,487 |
| 29. | Cochiti Lake | 3.0% | 1.4%(+1.66)#29 | 1.9%(+1.15)#3,567 |
| 30. | Sunland Park | 3.0% | 1.4%(+1.60)#30 | 1.9%(+1.09)#3,696 |
| 31. | Church Rock | 2.9% | 1.4%(+1.55)#31 | 1.9%(+1.04)#3,768 |
| 32. | Gallup | 2.9% | 1.4%(+1.47)#32 | 1.9%(+0.955)#3,976 |
| 33. | Paa-Ko | 2.8% | 1.4%(+1.39)#33 | 1.9%(+0.879)#4,136 |
| 34. | Jacona | 2.6% | 1.4%(+1.24)#34 | 1.9%(+0.733)#4,536 |
| 35. | Ponderosa Pine | 2.6% | 1.4%(+1.20)#35 | 1.9%(+0.686)#4,661 |
| 36. | Kirtland | 2.6% | 1.4%(+1.17)#36 | 1.9%(+0.655)#4,762 |
| 37. | Los Chaves | 2.5% | 1.4%(+1.13)#37 | 1.9%(+0.615)#4,867 |
| 38. | Santa Fe Foothills | 2.5% | 1.4%(+1.08)#38 | 1.9%(+0.571)#5,018 |
| 39. | Alamogordo | 2.4% | 1.4%(+1.03)#39 | 1.9%(+0.518)#5,165 |
| 40. | Paradise Hills | 2.3% | 1.4%(+0.903)#40 | 1.9%(+0.392)#5,588 |
| 41. | Zia Pueblo | 2.3% | 1.4%(+0.880)#41 | 1.9%(+0.369)#5,672 |
| 42. | Bayard | 2.2% | 1.4%(+0.771)#42 | 1.9%(+0.260)#6,049 |
| 43. | Eldorado At Santa Fe | 2.1% | 1.4%(+0.756)#43 | 1.9%(+0.245)#6,103 |
| 44. | Zuni Pueblo | 2.1% | 1.4%(+0.704)#44 | 1.9%(+0.193)#6,301 |
| 45. | Sandia Heights | 2.1% | 1.4%(+0.673)#45 | 1.9%(+0.162)#6,428 |
| 46. | Las Campanas | 2.0% | 1.4%(+0.633)#46 | 1.9%(+0.122)#6,569 |
| 47. | Taos | 2.0% | 1.4%(+0.609)#47 | 1.9%(+0.098)#6,674 |
| 48. | Clayton | 2.0% | 1.4%(+0.605)#48 | 1.9%(+0.094)#6,688 |
| 49. | Placitas Cdp Sandoval County | 2.0% | 1.4%(+0.594)#49 | 1.9%(+0.083)#6,731 |
| 50. | Hernandez | 1.9% | 1.4%(+0.528)#50 | 1.9%(+0.017)#7,009 |
| 51. | Raton | 1.9% | 1.4%(+0.523)#51 | 1.9%(+0.012)#7,037 |
| 52. | Lovington | 1.9% | 1.4%(+0.511)#52 | 1.9%(-0.000)#7,097 |
| 53. | Los Alamos | 1.9% | 1.4%(+0.481)#53 | 1.9%(-0.030)#7,223 |
| 54. | Rio Rancho | 1.8% | 1.4%(+0.443)#54 | 1.9%(-0.068)#7,362 |
| 55. | Hobbs | 1.8% | 1.4%(+0.435)#55 | 1.9%(-0.076)#7,398 |
| 56. | Tesuque Pueblo | 1.8% | 1.4%(+0.409)#56 | 1.9%(-0.102)#7,535 |
| 57. | Peralta | 1.8% | 1.4%(+0.402)#57 | 1.9%(-0.109)#7,565 |
| 58. | Albuquerque | 1.8% | 1.4%(+0.398)#58 | 1.9%(-0.113)#7,607 |
| 59. | San Felipe Pueblo | 1.7% | 1.4%(+0.329)#59 | 1.9%(-0.182)#7,947 |
| 60. | Chaparral | 1.7% | 1.4%(+0.291)#60 | 1.9%(-0.220)#8,123 |
| 61. | Ruidoso Downs | 1.7% | 1.4%(+0.268)#61 | 1.9%(-0.243)#8,242 |
| 62. | La Huerta | 1.7% | 1.4%(+0.263)#62 | 1.9%(-0.248)#8,270 |
| 63. | Boles Acres | 1.6% | 1.4%(+0.244)#63 | 1.9%(-0.267)#8,372 |
| 64. | Chimayo | 1.6% | 1.4%(+0.225)#64 | 1.9%(-0.286)#8,460 |
| 65. | Santa Fe | 1.6% | 1.4%(+0.213)#65 | 1.9%(-0.298)#8,516 |
| 66. | North Hobbs | 1.6% | 1.4%(+0.184)#66 | 1.9%(-0.327)#8,660 |
| 67. | La Union | 1.6% | 1.4%(+0.179)#67 | 1.9%(-0.332)#8,692 |
| 68. | Nambe | 1.5% | 1.4%(+0.118)#68 | 1.9%(-0.393)#9,012 |
| 69. | La Luz | 1.5% | 1.4%(+0.116)#69 | 1.9%(-0.395)#9,023 |
| 70. | South Valley | 1.5% | 1.4%(+0.102)#70 | 1.9%(-0.409)#9,094 |
| 71. | Fairacres | 1.5% | 1.4%(+0.089)#71 | 1.9%(-0.422)#9,176 |
| 72. | Artesia | 1.5% | 1.4%(+0.080)#72 | 1.9%(-0.431)#9,234 |
| 73. | Chamita | 1.4% | 1.4%(+0.058)#73 | 1.9%(-0.453)#9,358 |
| 74. | Socorro | 1.4% | 1.4%(+0.021)#74 | 1.9%(-0.490)#9,550 |
| 75. | Bosque Farms | 1.4% | 1.4%(+0.016)#75 | 1.9%(-0.495)#9,589 |
| 76. | Pojoaque | 1.4% | 1.4%(+0.013)#76 | 1.9%(-0.498)#9,602 |
| 77. | Twin Lakes | 1.3% | 1.4%(-0.054)#77 | 1.9%(-0.565)#9,971 |
| 78. | North Valley | 1.3% | 1.4%(-0.054)#78 | 1.9%(-0.565)#9,986 |
| 79. | Newcomb | 1.3% | 1.4%(-0.097)#79 | 1.9%(-0.608)#10,234 |
| 80. | Bernalillo | 1.3% | 1.4%(-0.117)#80 | 1.9%(-0.628)#10,341 |
| 81. | Corrales | 1.3% | 1.4%(-0.132)#81 | 1.9%(-0.643)#10,436 |
| 82. | Dexter | 1.2% | 1.4%(-0.150)#82 | 1.9%(-0.661)#10,541 |
| 83. | Santa Teresa | 1.2% | 1.4%(-0.159)#83 | 1.9%(-0.670)#10,600 |
| 84. | Tesuque | 1.2% | 1.4%(-0.160)#84 | 1.9%(-0.671)#10,606 |
| 85. | Las Cruces | 1.2% | 1.4%(-0.176)#85 | 1.9%(-0.687)#10,693 |
| 86. | Grady | 1.2% | 1.4%(-0.197)#86 | 1.9%(-0.708)#10,825 |
| 87. | Espanola | 1.2% | 1.4%(-0.199)#87 | 1.9%(-0.710)#10,838 |
| 88. | Moriarty | 1.2% | 1.4%(-0.211)#88 | 1.9%(-0.722)#10,907 |
| 89. | Clovis | 1.1% | 1.4%(-0.244)#89 | 1.9%(-0.755)#11,117 |
| 90. | Meadow Lake | 1.1% | 1.4%(-0.248)#90 | 1.9%(-0.759)#11,142 |
| 91. | Deming | 1.1% | 1.4%(-0.251)#91 | 1.9%(-0.762)#11,153 |
| 92. | Ruidoso | 1.1% | 1.4%(-0.254)#92 | 1.9%(-0.765)#11,175 |
| 93. | Las Vegas | 1.1% | 1.4%(-0.266)#93 | 1.9%(-0.777)#11,266 |
| 94. | Jal | 1.1% | 1.4%(-0.278)#94 | 1.9%(-0.789)#11,329 |
| 95. | Tucumcari | 1.1% | 1.4%(-0.286)#95 | 1.9%(-0.797)#11,390 |
| 96. | Tano Road | 1.1% | 1.4%(-0.312)#96 | 1.9%(-0.823)#11,551 |
| 97. | Farmington | 1.1% | 1.4%(-0.312)#97 | 1.9%(-0.823)#11,558 |
| 98. | El Rancho | 1.0% | 1.4%(-0.368)#98 | 1.9%(-0.879)#11,892 |
| 99. | Los Lunas | 1.0% | 1.4%(-0.387)#99 | 1.9%(-0.898)#11,985 |
| 100. | La Mesilla | 0.97% | 1.4%(-0.413)#100 | 1.9%(-0.924)#12,119 |
Common Questions
What are the Top 10 Cities with the Highest Percentage of Population Employed in Information in New Mexico?
Top 10 Cities with the Highest Percentage of Population Employed in Information in New Mexico are:
#1
47.8%
#2
26.9%
#3
22.4%
#4
16.0%
#5
13.2%
#6
12.0%
#7
11.9%
#8
9.8%
#9
8.1%
#10
7.1%
What city has the Highest Percentage of Population Employed in Information in New Mexico?
Mayhill has the Highest Percentage of Population Employed in Information in New Mexico with 47.8%.
What is the Percentage of Population Employed in Information in the State of New Mexico?
Percentage of Population Employed in Information in New Mexico is 1.4%.
What is the Percentage of Population Employed in Information in the United States?
Percentage of Population Employed in Information in the United States is 1.9%.