Cities with the Highest Percentage of Population Employed in Information in Oregon
RELATED REPORTS & OPTIONS
Information & Technology
Oregon
Compare Cities
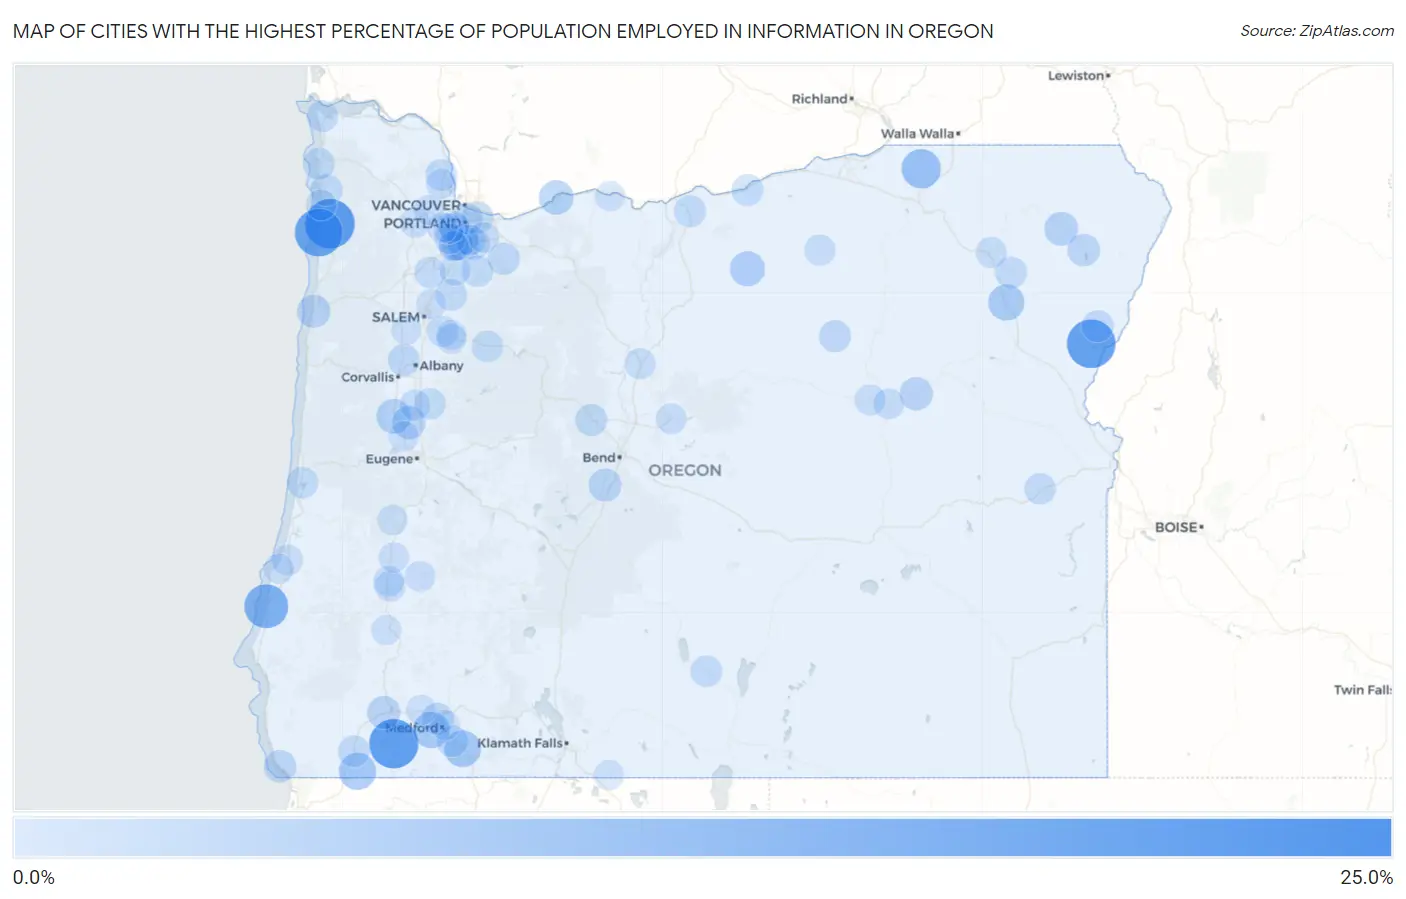
Map of Cities with the Highest Percentage of Population Employed in Information in Oregon
0.0%
25.0%
Cities with the Highest Percentage of Population Employed in Information in Oregon
| City | % Employed | vs State | vs National | |
| 1. | Running Y Ranch | 20.9% | 1.5%(+19.4)#1 | 1.9%(+19.0)#100 |
| 2. | Rhododendron | 20.0% | 1.5%(+18.5)#2 | 1.9%(+18.1)#106 |
| 3. | Idaville | 17.9% | 1.5%(+16.4)#3 | 1.9%(+16.1)#135 |
| 4. | Williams | 17.7% | 1.5%(+16.2)#4 | 1.9%(+15.8)#138 |
| 5. | Richland | 17.1% | 1.5%(+15.5)#5 | 1.9%(+15.2)#151 |
| 6. | Oceanside | 16.5% | 1.5%(+14.9)#6 | 1.9%(+14.6)#162 |
| 7. | Bandon | 13.1% | 1.5%(+11.5)#7 | 1.9%(+11.2)#247 |
| 8. | Helix | 9.2% | 1.5%(+7.69)#8 | 1.9%(+7.33)#459 |
| 9. | Juniper Canyon | 8.9% | 1.5%(+7.39)#9 | 1.9%(+7.03)#487 |
| 10. | Elmira | 7.5% | 1.5%(+5.96)#10 | 1.9%(+5.60)#658 |
| 11. | Takilma | 7.4% | 1.5%(+5.84)#11 | 1.9%(+5.48)#688 |
| 12. | Ashland | 7.2% | 1.5%(+5.67)#12 | 1.9%(+5.31)#720 |
| 13. | Jacksonville | 6.9% | 1.5%(+5.33)#13 | 1.9%(+4.97)#802 |
| 14. | North Powder | 6.6% | 1.5%(+5.02)#14 | 1.9%(+4.66)#872 |
| 15. | Prineville Lake Acres | 6.0% | 1.5%(+4.48)#15 | 1.9%(+4.12)#1,024 |
| 16. | Condon | 5.6% | 1.5%(+4.10)#16 | 1.9%(+3.74)#1,169 |
| 17. | San Marine | 5.5% | 1.5%(+3.98)#17 | 1.9%(+3.62)#1,221 |
| 18. | River Point | 5.5% | 1.5%(+3.94)#18 | 1.9%(+3.58)#1,235 |
| 19. | Monroe | 5.4% | 1.5%(+3.86)#19 | 1.9%(+3.50)#1,263 |
| 20. | Cascade Locks | 5.3% | 1.5%(+3.75)#20 | 1.9%(+3.39)#1,317 |
| 21. | Heceta Beach | 5.0% | 1.5%(+3.46)#21 | 1.9%(+3.10)#1,463 |
| 22. | Lostine | 4.7% | 1.5%(+3.19)#22 | 1.9%(+2.83)#1,628 |
| 23. | Harrisburg | 4.4% | 1.5%(+2.91)#23 | 1.9%(+2.55)#1,821 |
| 24. | Lincoln City | 4.3% | 1.5%(+2.81)#24 | 1.9%(+2.44)#1,915 |
| 25. | Prairie City | 4.2% | 1.5%(+2.71)#25 | 1.9%(+2.35)#1,995 |
| 26. | Redwood | 4.2% | 1.5%(+2.70)#26 | 1.9%(+2.34)#1,998 |
| 27. | Sunriver | 4.0% | 1.5%(+2.41)#27 | 1.9%(+2.05)#2,275 |
| 28. | Durham | 3.8% | 1.5%(+2.29)#28 | 1.9%(+1.93)#2,416 |
| 29. | Brookings | 3.7% | 1.5%(+2.14)#29 | 1.9%(+1.78)#2,614 |
| 30. | Joseph | 3.6% | 1.5%(+2.10)#30 | 1.9%(+1.73)#2,677 |
| 31. | Stafford | 3.4% | 1.5%(+1.82)#31 | 1.9%(+1.46)#3,027 |
| 32. | Estacada | 3.3% | 1.5%(+1.79)#32 | 1.9%(+1.43)#3,084 |
| 33. | Sisters | 3.3% | 1.5%(+1.77)#33 | 1.9%(+1.41)#3,103 |
| 34. | Monument | 3.3% | 1.5%(+1.74)#34 | 1.9%(+1.38)#3,153 |
| 35. | Central Point | 3.2% | 1.5%(+1.71)#35 | 1.9%(+1.35)#3,198 |
| 36. | Adair Village | 3.2% | 1.5%(+1.65)#36 | 1.9%(+1.28)#3,300 |
| 37. | Halfway | 3.2% | 1.5%(+1.64)#37 | 1.9%(+1.28)#3,319 |
| 38. | Maywood Park | 3.1% | 1.5%(+1.60)#38 | 1.9%(+1.24)#3,398 |
| 39. | Wasco | 3.1% | 1.5%(+1.59)#39 | 1.9%(+1.23)#3,423 |
| 40. | Nehalem | 3.1% | 1.5%(+1.59)#40 | 1.9%(+1.23)#3,426 |
| 41. | Cannon Beach | 3.1% | 1.5%(+1.58)#41 | 1.9%(+1.22)#3,434 |
| 42. | Gladstone | 3.1% | 1.5%(+1.58)#42 | 1.9%(+1.22)#3,442 |
| 43. | Union | 3.1% | 1.5%(+1.51)#43 | 1.9%(+1.15)#3,557 |
| 44. | Warren | 3.0% | 1.5%(+1.49)#44 | 1.9%(+1.13)#3,594 |
| 45. | Mount Angel | 3.0% | 1.5%(+1.48)#45 | 1.9%(+1.12)#3,626 |
| 46. | Cave Junction | 3.0% | 1.5%(+1.44)#46 | 1.9%(+1.07)#3,722 |
| 47. | Raleigh Hills | 2.9% | 1.5%(+1.40)#47 | 1.9%(+1.04)#3,784 |
| 48. | Talent | 2.9% | 1.5%(+1.35)#48 | 1.9%(+0.991)#3,881 |
| 49. | Paisley | 2.9% | 1.5%(+1.35)#49 | 1.9%(+0.986)#3,900 |
| 50. | Harper | 2.9% | 1.5%(+1.32)#50 | 1.9%(+0.959)#3,965 |
| 51. | Mill City | 2.8% | 1.5%(+1.29)#51 | 1.9%(+0.926)#4,027 |
| 52. | Warrenton | 2.8% | 1.5%(+1.25)#52 | 1.9%(+0.888)#4,123 |
| 53. | St Paul | 2.8% | 1.5%(+1.24)#53 | 1.9%(+0.879)#4,139 |
| 54. | Arlington | 2.8% | 1.5%(+1.23)#54 | 1.9%(+0.870)#4,163 |
| 55. | Mulino | 2.7% | 1.5%(+1.20)#55 | 1.9%(+0.840)#4,251 |
| 56. | Dunes City | 2.7% | 1.5%(+1.20)#56 | 1.9%(+0.838)#4,258 |
| 57. | Brownsville | 2.6% | 1.5%(+1.06)#57 | 1.9%(+0.698)#4,625 |
| 58. | Aurora | 2.6% | 1.5%(+1.04)#58 | 1.9%(+0.674)#4,698 |
| 59. | Lake Oswego | 2.6% | 1.5%(+1.02)#59 | 1.9%(+0.654)#4,767 |
| 60. | Aumsville | 2.5% | 1.5%(+1.000)#60 | 1.9%(+0.637)#4,807 |
| 61. | Heppner | 2.5% | 1.5%(+0.969)#61 | 1.9%(+0.606)#4,895 |
| 62. | Island City | 2.5% | 1.5%(+0.959)#62 | 1.9%(+0.596)#4,928 |
| 63. | Portland | 2.5% | 1.5%(+0.956)#63 | 1.9%(+0.594)#4,935 |
| 64. | Rivergrove | 2.5% | 1.5%(+0.953)#64 | 1.9%(+0.591)#4,944 |
| 65. | Marlene | 2.4% | 1.5%(+0.911)#65 | 1.9%(+0.548)#5,088 |
| 66. | Roseburg | 2.4% | 1.5%(+0.845)#66 | 1.9%(+0.483)#5,275 |
| 67. | Madras | 2.4% | 1.5%(+0.843)#67 | 1.9%(+0.481)#5,296 |
| 68. | Mount Vernon | 2.3% | 1.5%(+0.797)#68 | 1.9%(+0.435)#5,435 |
| 69. | Oak Grove | 2.3% | 1.5%(+0.792)#69 | 1.9%(+0.429)#5,457 |
| 70. | North Bend | 2.3% | 1.5%(+0.756)#70 | 1.9%(+0.394)#5,579 |
| 71. | Rockaway Beach | 2.3% | 1.5%(+0.749)#71 | 1.9%(+0.387)#5,607 |
| 72. | Roseburg North | 2.3% | 1.5%(+0.738)#72 | 1.9%(+0.376)#5,639 |
| 73. | Halsey | 2.2% | 1.5%(+0.698)#73 | 1.9%(+0.335)#5,790 |
| 74. | Prineville | 2.2% | 1.5%(+0.695)#74 | 1.9%(+0.333)#5,803 |
| 75. | Canyon City | 2.2% | 1.5%(+0.668)#75 | 1.9%(+0.305)#5,888 |
| 76. | Glide | 2.2% | 1.5%(+0.660)#76 | 1.9%(+0.298)#5,920 |
| 77. | West Slope | 2.2% | 1.5%(+0.651)#77 | 1.9%(+0.289)#5,962 |
| 78. | Mapleton | 2.2% | 1.5%(+0.622)#78 | 1.9%(+0.260)#6,051 |
| 79. | Tigard | 2.1% | 1.5%(+0.571)#79 | 1.9%(+0.209)#6,229 |
| 80. | Drain | 2.1% | 1.5%(+0.560)#80 | 1.9%(+0.198)#6,274 |
| 81. | Happy Valley | 2.1% | 1.5%(+0.554)#81 | 1.9%(+0.192)#6,306 |
| 82. | River Road | 2.0% | 1.5%(+0.485)#82 | 1.9%(+0.123)#6,562 |
| 83. | Stayton | 2.0% | 1.5%(+0.483)#83 | 1.9%(+0.120)#6,578 |
| 84. | Forest Grove | 2.0% | 1.5%(+0.459)#84 | 1.9%(+0.097)#6,677 |
| 85. | Scappoose | 2.0% | 1.5%(+0.448)#85 | 1.9%(+0.086)#6,723 |
| 86. | Junction City | 2.0% | 1.5%(+0.443)#86 | 1.9%(+0.081)#6,744 |
| 87. | Tualatin | 1.9% | 1.5%(+0.410)#87 | 1.9%(+0.048)#6,882 |
| 88. | Oakland | 1.9% | 1.5%(+0.399)#88 | 1.9%(+0.037)#6,924 |
| 89. | Beaverton | 1.9% | 1.5%(+0.367)#89 | 1.9%(+0.005)#7,066 |
| 90. | Sublimity | 1.9% | 1.5%(+0.330)#90 | 1.9%(-0.032)#7,231 |
| 91. | Malin | 1.9% | 1.5%(+0.321)#91 | 1.9%(-0.041)#7,266 |
| 92. | Labish Village | 1.8% | 1.5%(+0.289)#92 | 1.9%(-0.074)#7,385 |
| 93. | Aloha | 1.8% | 1.5%(+0.268)#93 | 1.9%(-0.095)#7,488 |
| 94. | Medford | 1.8% | 1.5%(+0.250)#94 | 1.9%(-0.112)#7,583 |
| 95. | Gold Hill | 1.8% | 1.5%(+0.246)#95 | 1.9%(-0.116)#7,619 |
| 96. | Mosier | 1.8% | 1.5%(+0.228)#96 | 1.9%(-0.134)#7,710 |
| 97. | North Plains | 1.8% | 1.5%(+0.224)#97 | 1.9%(-0.138)#7,729 |
| 98. | Independence | 1.7% | 1.5%(+0.209)#98 | 1.9%(-0.153)#7,808 |
| 99. | Barview | 1.7% | 1.5%(+0.195)#99 | 1.9%(-0.167)#7,880 |
| 100. | Riddle | 1.7% | 1.5%(+0.185)#100 | 1.9%(-0.178)#7,932 |
Common Questions
What are the Top 10 Cities with the Highest Percentage of Population Employed in Information in Oregon?
Top 10 Cities with the Highest Percentage of Population Employed in Information in Oregon are:
#1
17.9%
#2
17.7%
#3
17.1%
#4
16.5%
#5
13.1%
#6
9.2%
#7
7.4%
#8
7.2%
#9
6.9%
#10
6.6%
What city has the Highest Percentage of Population Employed in Information in Oregon?
Idaville has the Highest Percentage of Population Employed in Information in Oregon with 17.9%.
What is the Percentage of Population Employed in Information in the State of Oregon?
Percentage of Population Employed in Information in Oregon is 1.5%.
What is the Percentage of Population Employed in Information in the United States?
Percentage of Population Employed in Information in the United States is 1.9%.