Cities with the Highest Percentage of Population Employed in Information in Indiana
RELATED REPORTS & OPTIONS
Information & Technology
Indiana
Compare Cities
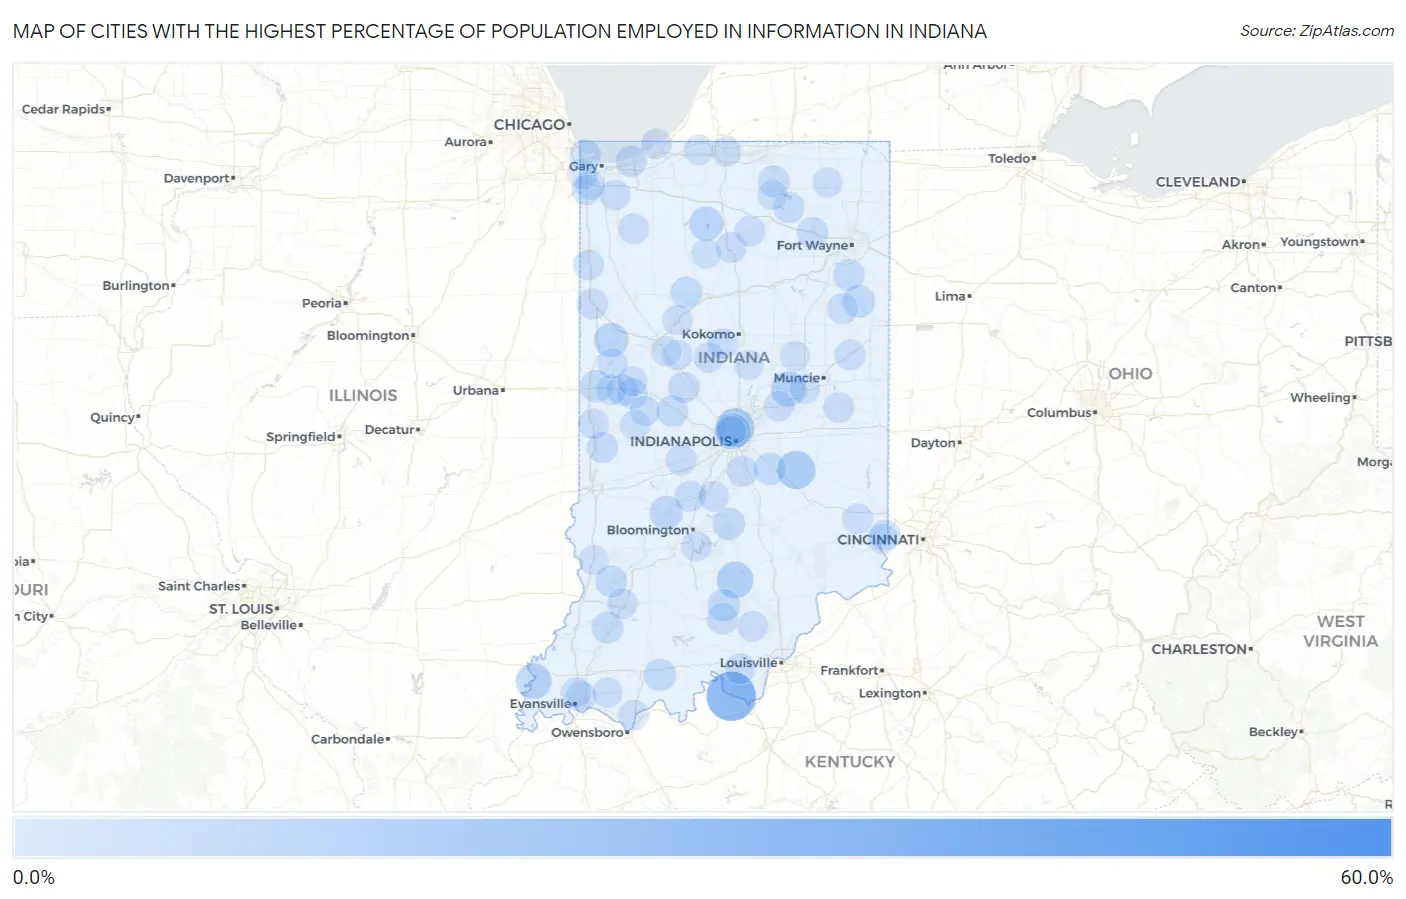
Map of Cities with the Highest Percentage of Population Employed in Information in Indiana
0.0%
60.0%
Cities with the Highest Percentage of Population Employed in Information in Indiana
| City | % Employed | vs State | vs National | |
| 1. | Lewis | 51.3% | 1.2%(+50.1)#1 | 1.9%(+49.4)#19 |
| 2. | Abington | 46.9% | 1.2%(+45.6)#2 | 1.9%(+45.0)#25 |
| 3. | Pleasantville | 35.5% | 1.2%(+34.3)#3 | 1.9%(+33.6)#43 |
| 4. | Mauckport | 28.6% | 1.2%(+27.3)#4 | 1.9%(+26.7)#58 |
| 5. | Laotto | 25.6% | 1.2%(+24.4)#5 | 1.9%(+23.7)#73 |
| 6. | Maxwell | 19.7% | 1.2%(+18.5)#6 | 1.9%(+17.8)#114 |
| 7. | St. Omer | 19.4% | 1.2%(+18.2)#7 | 1.9%(+17.5)#118 |
| 8. | Crows Nest | 13.8% | 1.2%(+12.6)#8 | 1.9%(+11.9)#225 |
| 9. | Manilla | 13.2% | 1.2%(+11.9)#9 | 1.9%(+11.3)#241 |
| 10. | Pittsburg | 12.7% | 1.2%(+11.5)#10 | 1.9%(+10.8)#263 |
| 11. | Wooster | 12.4% | 1.2%(+11.2)#11 | 1.9%(+10.5)#279 |
| 12. | Petersville | 11.8% | 1.2%(+10.6)#12 | 1.9%(+9.93)#298 |
| 13. | Medora | 11.1% | 1.2%(+9.85)#13 | 1.9%(+9.18)#328 |
| 14. | Chain-O-Lakes | 11.0% | 1.2%(+9.81)#14 | 1.9%(+9.14)#330 |
| 15. | Spring Hill | 10.0% | 1.2%(+8.77)#15 | 1.9%(+8.10)#397 |
| 16. | New Harmony | 9.7% | 1.2%(+8.43)#16 | 1.9%(+7.76)#426 |
| 17. | Woodlawn Heights | 9.6% | 1.2%(+8.39)#17 | 1.9%(+7.72)#430 |
| 18. | Arthur | 8.6% | 1.2%(+7.35)#18 | 1.9%(+6.67)#517 |
| 19. | Pine Village | 8.2% | 1.2%(+6.97)#19 | 1.9%(+6.30)#556 |
| 20. | Culver | 7.8% | 1.2%(+6.60)#20 | 1.9%(+5.93)#600 |
| 21. | Haysville | 7.4% | 1.2%(+6.20)#21 | 1.9%(+5.53)#673 |
| 22. | Carrollton | 7.2% | 1.2%(+5.97)#22 | 1.9%(+5.30)#721 |
| 23. | Duneland Beach | 6.9% | 1.2%(+5.72)#23 | 1.9%(+5.05)#786 |
| 24. | Spencer | 6.6% | 1.2%(+5.41)#24 | 1.9%(+4.74)#848 |
| 25. | Underwood | 6.3% | 1.2%(+5.08)#25 | 1.9%(+4.41)#931 |
| 26. | Vera Cruz | 5.9% | 1.2%(+4.66)#26 | 1.9%(+3.98)#1,071 |
| 27. | Nashville | 5.8% | 1.2%(+4.56)#27 | 1.9%(+3.89)#1,103 |
| 28. | Romney | 5.7% | 1.2%(+4.43)#28 | 1.9%(+3.75)#1,164 |
| 29. | St Meinrad | 5.6% | 1.2%(+4.42)#29 | 1.9%(+3.75)#1,167 |
| 30. | Campbellsburg | 5.5% | 1.2%(+4.23)#30 | 1.9%(+3.56)#1,246 |
| 31. | Covington | 5.3% | 1.2%(+4.07)#31 | 1.9%(+3.40)#1,314 |
| 32. | Fairland | 5.3% | 1.2%(+4.04)#32 | 1.9%(+3.36)#1,327 |
| 33. | Petersburg | 5.1% | 1.2%(+3.84)#33 | 1.9%(+3.16)#1,436 |
| 34. | New Ross | 4.9% | 1.2%(+3.66)#34 | 1.9%(+2.99)#1,540 |
| 35. | Edwardsport | 4.7% | 1.2%(+3.50)#35 | 1.9%(+2.83)#1,631 |
| 36. | Whiting | 4.7% | 1.2%(+3.50)#36 | 1.9%(+2.82)#1,633 |
| 37. | Ossian | 4.7% | 1.2%(+3.44)#37 | 1.9%(+2.77)#1,661 |
| 38. | Burnettsville | 4.6% | 1.2%(+3.35)#38 | 1.9%(+2.68)#1,735 |
| 39. | New Paris | 4.4% | 1.2%(+3.22)#39 | 1.9%(+2.55)#1,820 |
| 40. | Livonia | 4.4% | 1.2%(+3.22)#40 | 1.9%(+2.55)#1,831 |
| 41. | Paragon | 4.1% | 1.2%(+2.91)#41 | 1.9%(+2.23)#2,101 |
| 42. | Thorntown | 4.1% | 1.2%(+2.90)#42 | 1.9%(+2.23)#2,112 |
| 43. | Porter | 4.1% | 1.2%(+2.87)#43 | 1.9%(+2.19)#2,136 |
| 44. | Earl Park | 4.1% | 1.2%(+2.86)#44 | 1.9%(+2.18)#2,149 |
| 45. | Hillsboro | 4.0% | 1.2%(+2.81)#45 | 1.9%(+2.14)#2,185 |
| 46. | North Webster | 4.0% | 1.2%(+2.74)#46 | 1.9%(+2.07)#2,257 |
| 47. | Columbia City | 3.9% | 1.2%(+2.71)#47 | 1.9%(+2.03)#2,295 |
| 48. | New Whiteland | 3.8% | 1.2%(+2.61)#48 | 1.9%(+1.94)#2,410 |
| 49. | Mecca | 3.8% | 1.2%(+2.56)#49 | 1.9%(+1.88)#2,478 |
| 50. | Stilesville | 3.7% | 1.2%(+2.45)#50 | 1.9%(+1.78)#2,618 |
| 51. | Rochester | 3.7% | 1.2%(+2.43)#51 | 1.9%(+1.76)#2,642 |
| 52. | Waynetown | 3.6% | 1.2%(+2.38)#52 | 1.9%(+1.70)#2,710 |
| 53. | Wheatfield | 3.5% | 1.2%(+2.31)#53 | 1.9%(+1.63)#2,791 |
| 54. | Poneto | 3.5% | 1.2%(+2.26)#54 | 1.9%(+1.59)#2,851 |
| 55. | Lake Of The Woods | 3.4% | 1.2%(+2.18)#55 | 1.9%(+1.50)#2,966 |
| 56. | New Pekin | 3.4% | 1.2%(+2.16)#56 | 1.9%(+1.49)#2,986 |
| 57. | Sunman | 3.4% | 1.2%(+2.13)#57 | 1.9%(+1.46)#3,026 |
| 58. | Redkey | 3.3% | 1.2%(+2.07)#58 | 1.9%(+1.40)#3,131 |
| 59. | Mentone | 3.3% | 1.2%(+2.03)#59 | 1.9%(+1.36)#3,182 |
| 60. | Mooreland | 3.2% | 1.2%(+2.02)#60 | 1.9%(+1.34)#3,199 |
| 61. | Michigantown | 3.2% | 1.2%(+2.01)#61 | 1.9%(+1.34)#3,203 |
| 62. | Washington | 3.2% | 1.2%(+1.96)#62 | 1.9%(+1.28)#3,303 |
| 63. | Greendale | 3.2% | 1.2%(+1.94)#63 | 1.9%(+1.27)#3,346 |
| 64. | Newport | 3.1% | 1.2%(+1.92)#64 | 1.9%(+1.25)#3,379 |
| 65. | Russiaville | 3.1% | 1.2%(+1.89)#65 | 1.9%(+1.22)#3,443 |
| 66. | Morocco | 3.1% | 1.2%(+1.89)#66 | 1.9%(+1.21)#3,448 |
| 67. | Lakes Of The Four Seasons | 3.1% | 1.2%(+1.88)#67 | 1.9%(+1.20)#3,463 |
| 68. | Smithville Sanders | 3.0% | 1.2%(+1.78)#68 | 1.9%(+1.10)#3,663 |
| 69. | Melody Hill | 3.0% | 1.2%(+1.77)#69 | 1.9%(+1.10)#3,671 |
| 70. | Painted Hills | 3.0% | 1.2%(+1.74)#70 | 1.9%(+1.06)#3,740 |
| 71. | Corydon | 2.9% | 1.2%(+1.72)#71 | 1.9%(+1.04)#3,765 |
| 72. | Pendleton | 2.9% | 1.2%(+1.68)#72 | 1.9%(+1.00)#3,852 |
| 73. | Veedersburg | 2.9% | 1.2%(+1.67)#73 | 1.9%(+0.993)#3,874 |
| 74. | Long Beach | 2.9% | 1.2%(+1.64)#74 | 1.9%(+0.964)#3,948 |
| 75. | Highland | 2.8% | 1.2%(+1.61)#75 | 1.9%(+0.936)#4,012 |
| 76. | Attica | 2.8% | 1.2%(+1.59)#76 | 1.9%(+0.920)#4,042 |
| 77. | Lawrenceburg | 2.8% | 1.2%(+1.58)#77 | 1.9%(+0.908)#4,068 |
| 78. | Delphi | 2.8% | 1.2%(+1.58)#78 | 1.9%(+0.905)#4,074 |
| 79. | Wingate | 2.8% | 1.2%(+1.57)#79 | 1.9%(+0.899)#4,098 |
| 80. | Mulberry | 2.7% | 1.2%(+1.51)#80 | 1.9%(+0.838)#4,255 |
| 81. | Waveland | 2.7% | 1.2%(+1.51)#81 | 1.9%(+0.834)#4,272 |
| 82. | Milford | 2.7% | 1.2%(+1.50)#82 | 1.9%(+0.831)#4,275 |
| 83. | Rome City | 2.7% | 1.2%(+1.49)#83 | 1.9%(+0.817)#4,305 |
| 84. | Daleville | 2.7% | 1.2%(+1.46)#84 | 1.9%(+0.788)#4,389 |
| 85. | Notre Dame | 2.7% | 1.2%(+1.44)#85 | 1.9%(+0.771)#4,426 |
| 86. | Lake Holiday | 2.6% | 1.2%(+1.41)#86 | 1.9%(+0.733)#4,528 |
| 87. | Munster | 2.6% | 1.2%(+1.39)#87 | 1.9%(+0.719)#4,566 |
| 88. | Wynnedale | 2.6% | 1.2%(+1.38)#88 | 1.9%(+0.710)#4,593 |
| 89. | Rockport | 2.6% | 1.2%(+1.38)#89 | 1.9%(+0.705)#4,604 |
| 90. | Boonville | 2.6% | 1.2%(+1.36)#90 | 1.9%(+0.684)#4,665 |
| 91. | St John | 2.6% | 1.2%(+1.35)#91 | 1.9%(+0.676)#4,693 |
| 92. | Westwood | 2.6% | 1.2%(+1.33)#92 | 1.9%(+0.655)#4,763 |
| 93. | New Carlisle | 2.5% | 1.2%(+1.32)#93 | 1.9%(+0.651)#4,776 |
| 94. | Everton | 2.5% | 1.2%(+1.32)#94 | 1.9%(+0.647)#4,786 |
| 95. | Summitville | 2.5% | 1.2%(+1.28)#95 | 1.9%(+0.607)#4,892 |
| 96. | Schererville | 2.5% | 1.2%(+1.24)#96 | 1.9%(+0.569)#5,025 |
| 97. | Tipton | 2.5% | 1.2%(+1.24)#97 | 1.9%(+0.563)#5,039 |
| 98. | Dayton | 2.5% | 1.2%(+1.23)#98 | 1.9%(+0.562)#5,041 |
| 99. | Carlisle | 2.4% | 1.2%(+1.22)#99 | 1.9%(+0.551)#5,080 |
| 100. | Kewanna | 2.4% | 1.2%(+1.22)#100 | 1.9%(+0.549)#5,085 |
Common Questions
What are the Top 10 Cities with the Highest Percentage of Population Employed in Information in Indiana?
Top 10 Cities with the Highest Percentage of Population Employed in Information in Indiana are:
#1
28.6%
#2
13.8%
#3
13.2%
#4
11.1%
#5
10.0%
#6
9.7%
#7
9.6%
#8
8.2%
#9
7.8%
#10
6.6%
What city has the Highest Percentage of Population Employed in Information in Indiana?
Mauckport has the Highest Percentage of Population Employed in Information in Indiana with 28.6%.
What is the Percentage of Population Employed in Information in the State of Indiana?
Percentage of Population Employed in Information in Indiana is 1.2%.
What is the Percentage of Population Employed in Information in the United States?
Percentage of Population Employed in Information in the United States is 1.9%.