Cities with the Highest Percentage of Population Employed in Information in Michigan
RELATED REPORTS & OPTIONS
Information & Technology
Michigan
Compare Cities
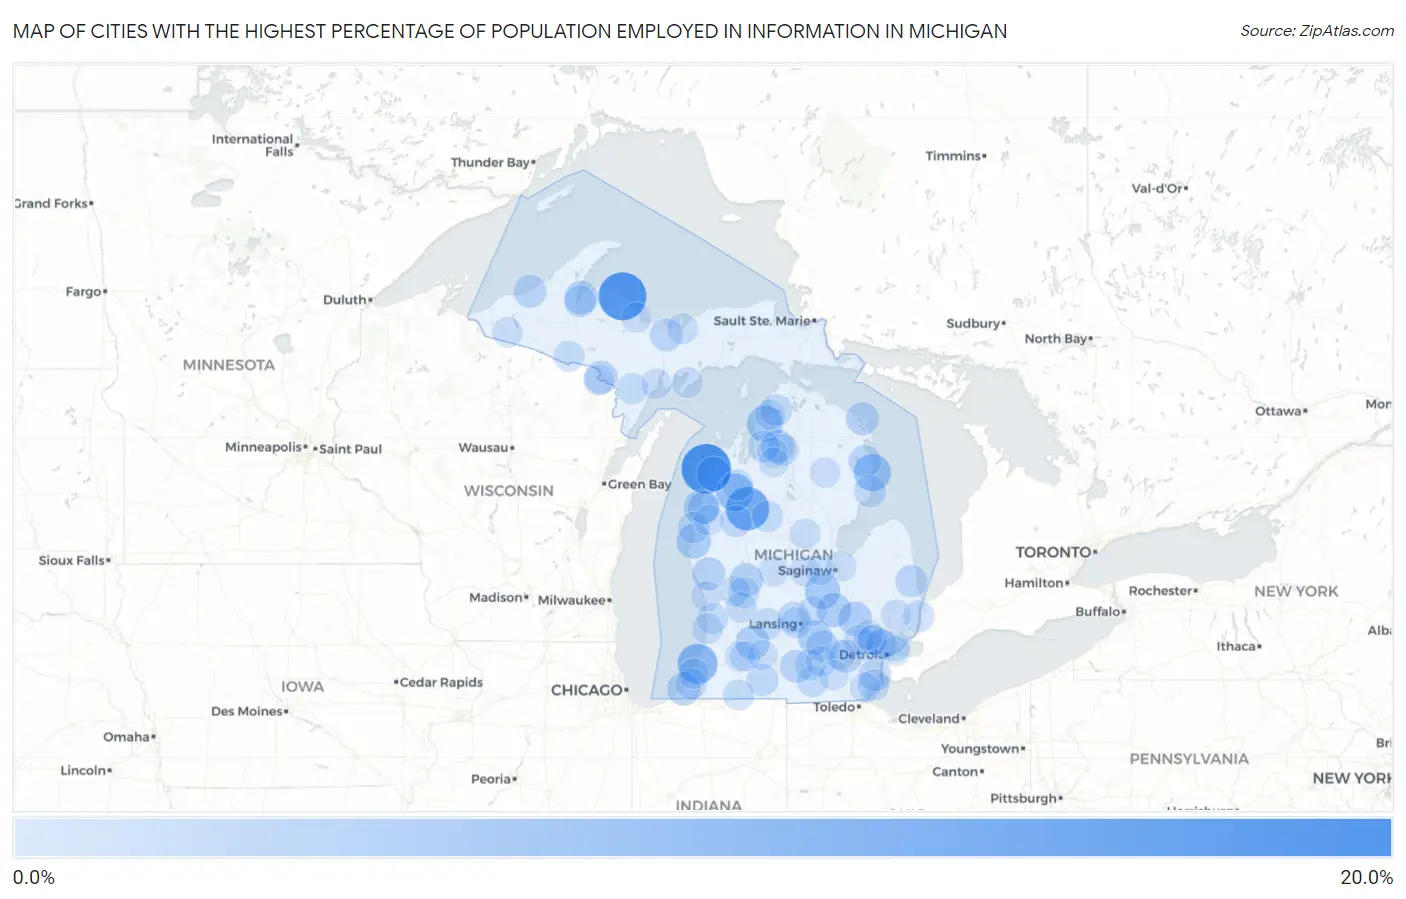
Map of Cities with the Highest Percentage of Population Employed in Information in Michigan
0.0%
20.0%
Cities with the Highest Percentage of Population Employed in Information in Michigan
| City | % Employed | vs State | vs National | |
| 1. | Crystal Downs Country Club | 20.0% | 1.2%(+18.8)#1 | 1.9%(+18.1)#109 |
| 2. | Big Bay | 18.5% | 1.2%(+17.3)#2 | 1.9%(+16.6)#125 |
| 3. | Wedgewood | 14.3% | 1.2%(+13.1)#3 | 1.9%(+12.4)#210 |
| 4. | Lake Michigan Beach | 10.9% | 1.2%(+9.66)#4 | 1.9%(+8.96)#338 |
| 5. | Mesick | 9.0% | 1.2%(+7.82)#5 | 1.9%(+7.12)#478 |
| 6. | Harrisville | 8.5% | 1.2%(+7.28)#6 | 1.9%(+6.59)#525 |
| 7. | Ironton | 7.7% | 1.2%(+6.49)#7 | 1.9%(+5.79)#621 |
| 8. | Skanee | 7.7% | 1.2%(+6.49)#8 | 1.9%(+5.79)#623 |
| 9. | Oakley | 7.1% | 1.2%(+5.88)#9 | 1.9%(+5.18)#749 |
| 10. | Oak Hill | 6.5% | 1.2%(+5.28)#10 | 1.9%(+4.58)#884 |
| 11. | Hartland | 6.4% | 1.2%(+5.20)#11 | 1.9%(+4.51)#903 |
| 12. | Dansville | 6.3% | 1.2%(+5.09)#12 | 1.9%(+4.40)#935 |
| 13. | Pentwater | 6.3% | 1.2%(+5.07)#13 | 1.9%(+4.38)#939 |
| 14. | Durand | 6.2% | 1.2%(+5.01)#14 | 1.9%(+4.31)#963 |
| 15. | Beulah | 6.1% | 1.2%(+4.92)#15 | 1.9%(+4.22)#987 |
| 16. | Falmouth | 5.9% | 1.2%(+4.74)#16 | 1.9%(+4.04)#1,051 |
| 17. | Holly | 5.8% | 1.2%(+4.62)#17 | 1.9%(+3.92)#1,093 |
| 18. | Delton | 5.7% | 1.2%(+4.50)#18 | 1.9%(+3.81)#1,138 |
| 19. | Chassell | 5.5% | 1.2%(+4.28)#19 | 1.9%(+3.58)#1,233 |
| 20. | Zeba | 5.4% | 1.2%(+4.15)#20 | 1.9%(+3.46)#1,288 |
| 21. | Shorewood Tower Hills Harbert | 5.2% | 1.2%(+3.95)#21 | 1.9%(+3.26)#1,378 |
| 22. | Sand Lake | 5.1% | 1.2%(+3.93)#22 | 1.9%(+3.23)#1,394 |
| 23. | Alba | 5.1% | 1.2%(+3.90)#23 | 1.9%(+3.20)#1,414 |
| 24. | Twin Lake | 4.9% | 1.2%(+3.74)#24 | 1.9%(+3.05)#1,512 |
| 25. | Presque Isle Harbor | 4.8% | 1.2%(+3.64)#25 | 1.9%(+2.95)#1,567 |
| 26. | Barton Hills | 4.8% | 1.2%(+3.62)#26 | 1.9%(+2.92)#1,580 |
| 27. | Iron Mountain | 4.8% | 1.2%(+3.61)#27 | 1.9%(+2.91)#1,585 |
| 28. | Concord | 4.6% | 1.2%(+3.35)#28 | 1.9%(+2.66)#1,741 |
| 29. | Ontonagon | 4.5% | 1.2%(+3.33)#29 | 1.9%(+2.64)#1,763 |
| 30. | Rockwood | 4.5% | 1.2%(+3.28)#30 | 1.9%(+2.58)#1,794 |
| 31. | Chatham | 4.4% | 1.2%(+3.24)#31 | 1.9%(+2.55)#1,830 |
| 32. | Lost Lake Woods | 4.3% | 1.2%(+3.08)#32 | 1.9%(+2.39)#1,958 |
| 33. | Mass | 4.3% | 1.2%(+3.08)#33 | 1.9%(+2.39)#1,960 |
| 34. | Croswell | 4.2% | 1.2%(+2.98)#34 | 1.9%(+2.28)#2,056 |
| 35. | Stronach | 4.2% | 1.2%(+2.96)#35 | 1.9%(+2.27)#2,071 |
| 36. | Stockbridge | 4.0% | 1.2%(+2.83)#36 | 1.9%(+2.14)#2,189 |
| 37. | Lakes Of The North | 3.9% | 1.2%(+2.74)#37 | 1.9%(+2.04)#2,290 |
| 38. | Oscoda | 3.9% | 1.2%(+2.69)#38 | 1.9%(+2.00)#2,346 |
| 39. | Wacousta | 3.8% | 1.2%(+2.62)#39 | 1.9%(+1.93)#2,420 |
| 40. | L Anse | 3.8% | 1.2%(+2.62)#40 | 1.9%(+1.93)#2,422 |
| 41. | Harbor Springs | 3.8% | 1.2%(+2.56)#41 | 1.9%(+1.86)#2,508 |
| 42. | Sherwood | 3.7% | 1.2%(+2.50)#42 | 1.9%(+1.81)#2,576 |
| 43. | Luther | 3.7% | 1.2%(+2.50)#43 | 1.9%(+1.81)#2,580 |
| 44. | Stony Point | 3.7% | 1.2%(+2.49)#44 | 1.9%(+1.79)#2,604 |
| 45. | Ludington | 3.5% | 1.2%(+2.32)#45 | 1.9%(+1.63)#2,800 |
| 46. | Marion | 3.5% | 1.2%(+2.32)#46 | 1.9%(+1.62)#2,812 |
| 47. | Bellaire | 3.5% | 1.2%(+2.29)#47 | 1.9%(+1.59)#2,849 |
| 48. | Woodland | 3.5% | 1.2%(+2.27)#48 | 1.9%(+1.57)#2,875 |
| 49. | St Clair | 3.4% | 1.2%(+2.20)#49 | 1.9%(+1.51)#2,958 |
| 50. | Buckley | 3.4% | 1.2%(+2.16)#50 | 1.9%(+1.46)#3,019 |
| 51. | Addison | 3.2% | 1.2%(+2.04)#51 | 1.9%(+1.34)#3,202 |
| 52. | Powers | 3.2% | 1.2%(+2.02)#52 | 1.9%(+1.33)#3,227 |
| 53. | Rockford | 3.2% | 1.2%(+2.01)#53 | 1.9%(+1.31)#3,247 |
| 54. | Beechwood | 3.2% | 1.2%(+2.00)#54 | 1.9%(+1.30)#3,271 |
| 55. | Vandercook Lake | 3.2% | 1.2%(+1.97)#55 | 1.9%(+1.27)#3,329 |
| 56. | Waverly | 3.1% | 1.2%(+1.91)#56 | 1.9%(+1.21)#3,449 |
| 57. | Bingham Farms | 3.1% | 1.2%(+1.90)#57 | 1.9%(+1.20)#3,469 |
| 58. | East Grand Rapids | 3.1% | 1.2%(+1.86)#58 | 1.9%(+1.16)#3,533 |
| 59. | Iron River | 3.0% | 1.2%(+1.84)#59 | 1.9%(+1.14)#3,581 |
| 60. | White Pigeon | 3.0% | 1.2%(+1.83)#60 | 1.9%(+1.14)#3,589 |
| 61. | Baroda | 3.0% | 1.2%(+1.82)#61 | 1.9%(+1.13)#3,618 |
| 62. | Saugatuck | 2.9% | 1.2%(+1.75)#62 | 1.9%(+1.05)#3,759 |
| 63. | Munising | 2.9% | 1.2%(+1.74)#63 | 1.9%(+1.04)#3,781 |
| 64. | Armada | 2.9% | 1.2%(+1.69)#64 | 1.9%(+0.997)#3,868 |
| 65. | Ferndale | 2.9% | 1.2%(+1.67)#65 | 1.9%(+0.977)#3,917 |
| 66. | Grass Lake | 2.9% | 1.2%(+1.67)#66 | 1.9%(+0.976)#3,920 |
| 67. | Garden | 2.9% | 1.2%(+1.65)#67 | 1.9%(+0.959)#3,966 |
| 68. | Breckenridge | 2.8% | 1.2%(+1.60)#68 | 1.9%(+0.902)#4,085 |
| 69. | Farmington | 2.8% | 1.2%(+1.60)#69 | 1.9%(+0.901)#4,089 |
| 70. | Fair Plain | 2.7% | 1.2%(+1.55)#70 | 1.9%(+0.850)#4,217 |
| 71. | Beaverton | 2.7% | 1.2%(+1.54)#71 | 1.9%(+0.848)#4,226 |
| 72. | Brimley | 2.7% | 1.2%(+1.54)#72 | 1.9%(+0.841)#4,244 |
| 73. | Fountain | 2.7% | 1.2%(+1.50)#73 | 1.9%(+0.804)#4,344 |
| 74. | Bay Shore | 2.7% | 1.2%(+1.49)#74 | 1.9%(+0.795)#4,367 |
| 75. | Escanaba | 2.7% | 1.2%(+1.49)#75 | 1.9%(+0.790)#4,385 |
| 76. | Westwood | 2.6% | 1.2%(+1.44)#76 | 1.9%(+0.745)#4,499 |
| 77. | Robin Glen Indiantown | 2.6% | 1.2%(+1.44)#77 | 1.9%(+0.743)#4,506 |
| 78. | Grosse Pointe Woods | 2.6% | 1.2%(+1.42)#78 | 1.9%(+0.723)#4,556 |
| 79. | Mio | 2.6% | 1.2%(+1.40)#79 | 1.9%(+0.699)#4,617 |
| 80. | Marenisco | 2.6% | 1.2%(+1.40)#80 | 1.9%(+0.699)#4,619 |
| 81. | Edmore | 2.6% | 1.2%(+1.36)#81 | 1.9%(+0.661)#4,747 |
| 82. | Kingsford | 2.6% | 1.2%(+1.36)#82 | 1.9%(+0.659)#4,753 |
| 83. | Trowbridge Park | 2.5% | 1.2%(+1.33)#83 | 1.9%(+0.635)#4,816 |
| 84. | Pleasant Ridge | 2.5% | 1.2%(+1.32)#84 | 1.9%(+0.626)#4,832 |
| 85. | Wixom | 2.5% | 1.2%(+1.32)#85 | 1.9%(+0.625)#4,836 |
| 86. | South Monroe | 2.5% | 1.2%(+1.32)#86 | 1.9%(+0.621)#4,848 |
| 87. | Dexter | 2.5% | 1.2%(+1.27)#87 | 1.9%(+0.575)#4,997 |
| 88. | Eastwood | 2.5% | 1.2%(+1.26)#88 | 1.9%(+0.563)#5,036 |
| 89. | Sparta | 2.5% | 1.2%(+1.26)#89 | 1.9%(+0.559)#5,049 |
| 90. | Ferrysburg | 2.4% | 1.2%(+1.24)#90 | 1.9%(+0.546)#5,093 |
| 91. | Grosse Pointe | 2.4% | 1.2%(+1.20)#91 | 1.9%(+0.506)#5,197 |
| 92. | Orchard Lake Village | 2.4% | 1.2%(+1.19)#92 | 1.9%(+0.493)#5,239 |
| 93. | Hemlock | 2.4% | 1.2%(+1.16)#93 | 1.9%(+0.465)#5,330 |
| 94. | Springfield | 2.4% | 1.2%(+1.15)#94 | 1.9%(+0.452)#5,372 |
| 95. | Clinton | 2.3% | 1.2%(+1.14)#95 | 1.9%(+0.441)#5,412 |
| 96. | Atlantic Mine | 2.3% | 1.2%(+1.13)#96 | 1.9%(+0.436)#5,431 |
| 97. | Mancelona | 2.3% | 1.2%(+1.13)#97 | 1.9%(+0.434)#5,441 |
| 98. | Laingsburg | 2.3% | 1.2%(+1.11)#98 | 1.9%(+0.413)#5,516 |
| 99. | Manistee Lake | 2.3% | 1.2%(+1.11)#99 | 1.9%(+0.409)#5,527 |
| 100. | Franklin | 2.3% | 1.2%(+1.08)#100 | 1.9%(+0.386)#5,609 |
Common Questions
What are the Top 10 Cities with the Highest Percentage of Population Employed in Information in Michigan?
Top 10 Cities with the Highest Percentage of Population Employed in Information in Michigan are:
#1
20.0%
#2
18.5%
#3
14.3%
#4
10.9%
#5
9.0%
#6
8.5%
#7
7.7%
#8
7.1%
#9
6.5%
#10
6.3%
What city has the Highest Percentage of Population Employed in Information in Michigan?
Crystal Downs Country Club has the Highest Percentage of Population Employed in Information in Michigan with 20.0%.
What is the Percentage of Population Employed in Information in the State of Michigan?
Percentage of Population Employed in Information in Michigan is 1.2%.
What is the Percentage of Population Employed in Information in the United States?
Percentage of Population Employed in Information in the United States is 1.9%.