Cities with the Highest Percentage of Population Employed in Information in North Carolina
RELATED REPORTS & OPTIONS
Information & Technology
North Carolina
Compare Cities
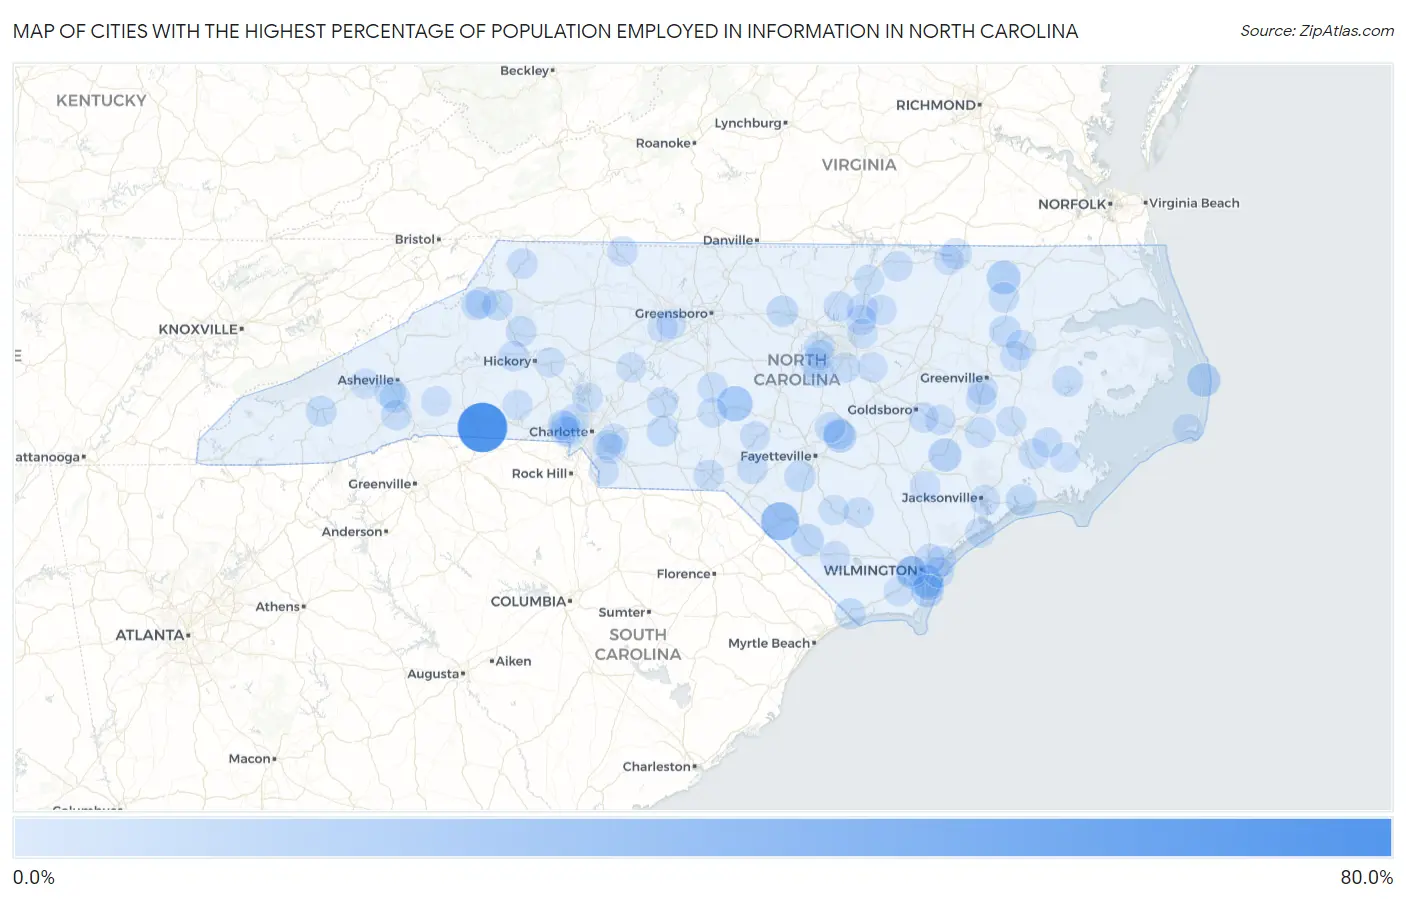
Map of Cities with the Highest Percentage of Population Employed in Information in North Carolina
0.0%
80.0%
Cities with the Highest Percentage of Population Employed in Information in North Carolina
| City | % Employed | vs State | vs National | |
| 1. | Henrietta | 62.5% | 1.7%(+60.8)#1 | 1.9%(+60.6)#12 |
| 2. | Raynham | 26.7% | 1.7%(+25.0)#2 | 1.9%(+24.8)#70 |
| 3. | Jackson Springs | 20.4% | 1.7%(+18.7)#3 | 1.9%(+18.5)#102 |
| 4. | Robbins | 17.9% | 1.7%(+16.2)#4 | 1.9%(+16.0)#136 |
| 5. | Governors | 13.5% | 1.7%(+11.8)#5 | 1.9%(+11.6)#234 |
| 6. | Woodland | 13.5% | 1.7%(+11.8)#6 | 1.9%(+11.6)#235 |
| 7. | Rodanthe | 12.5% | 1.7%(+10.8)#7 | 1.9%(+10.6)#272 |
| 8. | Silver Lake | 11.9% | 1.7%(+10.3)#8 | 1.9%(+10.0)#293 |
| 9. | Pink Hill | 11.6% | 1.7%(+9.98)#9 | 1.9%(+9.75)#306 |
| 10. | Belville | 10.8% | 1.7%(+9.15)#10 | 1.9%(+8.92)#341 |
| 11. | Falcon | 10.7% | 1.7%(+9.05)#11 | 1.9%(+8.82)#347 |
| 12. | Sea Breeze | 10.0% | 1.7%(+8.37)#12 | 1.9%(+8.13)#386 |
| 13. | Boardman | 10.0% | 1.7%(+8.33)#13 | 1.9%(+8.10)#392 |
| 14. | Cypress Landing | 8.2% | 1.7%(+6.55)#14 | 1.9%(+6.32)#553 |
| 15. | Seven Devils | 7.2% | 1.7%(+5.52)#15 | 1.9%(+5.28)#725 |
| 16. | Hamilton | 7.1% | 1.7%(+5.48)#16 | 1.9%(+5.24)#732 |
| 17. | Efland | 7.0% | 1.7%(+5.34)#17 | 1.9%(+5.11)#771 |
| 18. | Parkton | 6.6% | 1.7%(+4.90)#18 | 1.9%(+4.67)#870 |
| 19. | Peletier | 6.5% | 1.7%(+4.79)#19 | 1.9%(+4.55)#889 |
| 20. | Godwin | 6.2% | 1.7%(+4.58)#20 | 1.9%(+4.35)#951 |
| 21. | Aquadale | 6.2% | 1.7%(+4.56)#21 | 1.9%(+4.33)#958 |
| 22. | Bent Creek | 6.2% | 1.7%(+4.50)#22 | 1.9%(+4.27)#974 |
| 23. | Carolina Shores | 5.7% | 1.7%(+4.04)#23 | 1.9%(+3.80)#1,139 |
| 24. | Blowing Rock | 5.4% | 1.7%(+3.76)#24 | 1.9%(+3.53)#1,256 |
| 25. | Sylva | 5.4% | 1.7%(+3.75)#25 | 1.9%(+3.52)#1,260 |
| 26. | Avery Creek | 5.1% | 1.7%(+3.46)#26 | 1.9%(+3.23)#1,389 |
| 27. | New London | 5.0% | 1.7%(+3.36)#27 | 1.9%(+3.13)#1,455 |
| 28. | Pantego | 5.0% | 1.7%(+3.28)#28 | 1.9%(+3.05)#1,506 |
| 29. | Gaston | 4.9% | 1.7%(+3.28)#29 | 1.9%(+3.05)#1,508 |
| 30. | Cedar Rock | 4.9% | 1.7%(+3.20)#30 | 1.9%(+2.97)#1,553 |
| 31. | Spout Springs | 4.9% | 1.7%(+3.20)#31 | 1.9%(+2.96)#1,557 |
| 32. | Deercroft | 4.8% | 1.7%(+3.16)#32 | 1.9%(+2.93)#1,577 |
| 33. | Myrtle Grove | 4.7% | 1.7%(+3.04)#33 | 1.9%(+2.81)#1,639 |
| 34. | Arrowhead Beach | 4.7% | 1.7%(+3.00)#34 | 1.9%(+2.77)#1,660 |
| 35. | Dover | 4.7% | 1.7%(+3.00)#35 | 1.9%(+2.76)#1,664 |
| 36. | Ayden | 4.5% | 1.7%(+2.83)#36 | 1.9%(+2.60)#1,785 |
| 37. | White Lake | 4.5% | 1.7%(+2.79)#37 | 1.9%(+2.56)#1,812 |
| 38. | Linden | 4.4% | 1.7%(+2.78)#38 | 1.9%(+2.55)#1,829 |
| 39. | Cordova | 4.4% | 1.7%(+2.74)#39 | 1.9%(+2.51)#1,859 |
| 40. | Horse Shoe | 4.4% | 1.7%(+2.69)#40 | 1.9%(+2.46)#1,901 |
| 41. | Franklinton | 4.4% | 1.7%(+2.69)#41 | 1.9%(+2.46)#1,903 |
| 42. | Kelford | 4.3% | 1.7%(+2.64)#42 | 1.9%(+2.41)#1,934 |
| 43. | Fairfield Harbour | 4.3% | 1.7%(+2.59)#43 | 1.9%(+2.36)#1,979 |
| 44. | Flat Rock | 4.2% | 1.7%(+2.56)#44 | 1.9%(+2.33)#2,011 |
| 45. | Holly Springs | 4.2% | 1.7%(+2.56)#45 | 1.9%(+2.33)#2,012 |
| 46. | Rutherford College | 4.2% | 1.7%(+2.56)#46 | 1.9%(+2.32)#2,020 |
| 47. | Apex | 4.2% | 1.7%(+2.52)#47 | 1.9%(+2.29)#2,048 |
| 48. | Louisburg | 4.1% | 1.7%(+2.43)#48 | 1.9%(+2.20)#2,125 |
| 49. | Jefferson | 4.1% | 1.7%(+2.41)#49 | 1.9%(+2.18)#2,156 |
| 50. | Midway | 4.0% | 1.7%(+2.38)#50 | 1.9%(+2.15)#2,177 |
| 51. | Bear Grass | 4.0% | 1.7%(+2.33)#51 | 1.9%(+2.10)#2,223 |
| 52. | Youngsville | 4.0% | 1.7%(+2.30)#52 | 1.9%(+2.06)#2,260 |
| 53. | Wrightsville Beach | 3.9% | 1.7%(+2.28)#53 | 1.9%(+2.05)#2,287 |
| 54. | Porters Neck | 3.9% | 1.7%(+2.27)#54 | 1.9%(+2.03)#2,299 |
| 55. | Creedmoor | 3.9% | 1.7%(+2.24)#55 | 1.9%(+2.01)#2,328 |
| 56. | Belmont | 3.9% | 1.7%(+2.22)#56 | 1.9%(+1.99)#2,356 |
| 57. | Whiteville | 3.9% | 1.7%(+2.20)#57 | 1.9%(+1.96)#2,393 |
| 58. | La Grange | 3.8% | 1.7%(+2.18)#58 | 1.9%(+1.95)#2,402 |
| 59. | Briar Chapel | 3.8% | 1.7%(+2.17)#59 | 1.9%(+1.94)#2,411 |
| 60. | Williamston | 3.8% | 1.7%(+2.13)#60 | 1.9%(+1.90)#2,448 |
| 61. | Elroy | 3.8% | 1.7%(+2.10)#61 | 1.9%(+1.87)#2,497 |
| 62. | Warrenton | 3.7% | 1.7%(+2.04)#62 | 1.9%(+1.81)#2,574 |
| 63. | Northchase | 3.7% | 1.7%(+2.01)#63 | 1.9%(+1.78)#2,613 |
| 64. | Garner | 3.7% | 1.7%(+2.00)#64 | 1.9%(+1.76)#2,635 |
| 65. | Southern Pines | 3.5% | 1.7%(+1.86)#65 | 1.9%(+1.63)#2,798 |
| 66. | Sugar Mountain | 3.5% | 1.7%(+1.83)#66 | 1.9%(+1.60)#2,842 |
| 67. | Dublin | 3.5% | 1.7%(+1.81)#67 | 1.9%(+1.57)#2,868 |
| 68. | Mcadenville | 3.5% | 1.7%(+1.80)#68 | 1.9%(+1.56)#2,887 |
| 69. | Grantsboro | 3.4% | 1.7%(+1.75)#69 | 1.9%(+1.52)#2,940 |
| 70. | Greenevers | 3.4% | 1.7%(+1.74)#70 | 1.9%(+1.51)#2,959 |
| 71. | Jacksonville | 3.4% | 1.7%(+1.72)#71 | 1.9%(+1.49)#2,983 |
| 72. | Winterville | 3.3% | 1.7%(+1.66)#72 | 1.9%(+1.43)#3,076 |
| 73. | Mint Hill | 3.3% | 1.7%(+1.65)#73 | 1.9%(+1.41)#3,101 |
| 74. | South Henderson | 3.3% | 1.7%(+1.64)#74 | 1.9%(+1.41)#3,104 |
| 75. | Leland | 3.3% | 1.7%(+1.64)#75 | 1.9%(+1.41)#3,108 |
| 76. | Fallston | 3.3% | 1.7%(+1.63)#76 | 1.9%(+1.39)#3,135 |
| 77. | Cramerton | 3.2% | 1.7%(+1.56)#77 | 1.9%(+1.33)#3,216 |
| 78. | North Topsail Beach | 3.2% | 1.7%(+1.56)#78 | 1.9%(+1.33)#3,222 |
| 79. | Seagrove | 3.2% | 1.7%(+1.53)#79 | 1.9%(+1.29)#3,282 |
| 80. | Archer Lodge | 3.1% | 1.7%(+1.48)#80 | 1.9%(+1.25)#3,381 |
| 81. | Canton | 3.1% | 1.7%(+1.47)#81 | 1.9%(+1.23)#3,408 |
| 82. | Mount Holly | 3.1% | 1.7%(+1.41)#82 | 1.9%(+1.18)#3,498 |
| 83. | Stallings | 3.1% | 1.7%(+1.41)#83 | 1.9%(+1.17)#3,518 |
| 84. | Bolivia | 3.0% | 1.7%(+1.36)#84 | 1.9%(+1.13)#3,604 |
| 85. | Wallburg | 3.0% | 1.7%(+1.32)#85 | 1.9%(+1.09)#3,688 |
| 86. | Cary | 3.0% | 1.7%(+1.31)#86 | 1.9%(+1.08)#3,712 |
| 87. | Frisco | 3.0% | 1.7%(+1.30)#87 | 1.9%(+1.07)#3,725 |
| 88. | Oriental | 3.0% | 1.7%(+1.29)#88 | 1.9%(+1.06)#3,754 |
| 89. | Waxhaw | 2.9% | 1.7%(+1.26)#89 | 1.9%(+1.03)#3,798 |
| 90. | Biscoe | 2.9% | 1.7%(+1.25)#90 | 1.9%(+1.02)#3,808 |
| 91. | Cornelius | 2.9% | 1.7%(+1.25)#91 | 1.9%(+1.02)#3,826 |
| 92. | Morrisville | 2.9% | 1.7%(+1.21)#92 | 1.9%(+0.974)#3,929 |
| 93. | South Rosemary | 2.9% | 1.7%(+1.20)#93 | 1.9%(+0.966)#3,943 |
| 94. | Salisbury | 2.9% | 1.7%(+1.19)#94 | 1.9%(+0.959)#3,953 |
| 95. | Vanceboro | 2.9% | 1.7%(+1.19)#95 | 1.9%(+0.959)#3,956 |
| 96. | Conover | 2.8% | 1.7%(+1.18)#96 | 1.9%(+0.947)#3,991 |
| 97. | Matthews | 2.8% | 1.7%(+1.18)#97 | 1.9%(+0.945)#3,994 |
| 98. | Lake Lure | 2.8% | 1.7%(+1.16)#98 | 1.9%(+0.930)#4,021 |
| 99. | Rolesville | 2.8% | 1.7%(+1.15)#99 | 1.9%(+0.921)#4,041 |
| 100. | Lowell | 2.8% | 1.7%(+1.14)#100 | 1.9%(+0.903)#4,082 |
Common Questions
What are the Top 10 Cities with the Highest Percentage of Population Employed in Information in North Carolina?
Top 10 Cities with the Highest Percentage of Population Employed in Information in North Carolina are:
#1
62.5%
#2
26.7%
#3
17.9%
#4
13.5%
#5
12.5%
#6
11.9%
#7
11.6%
#8
10.8%
#9
10.7%
#10
10.0%
What city has the Highest Percentage of Population Employed in Information in North Carolina?
Henrietta has the Highest Percentage of Population Employed in Information in North Carolina with 62.5%.
What is the Percentage of Population Employed in Information in the State of North Carolina?
Percentage of Population Employed in Information in North Carolina is 1.7%.
What is the Percentage of Population Employed in Information in the United States?
Percentage of Population Employed in Information in the United States is 1.9%.