Cities with the Highest Percentage of Population Employed in Information in Virginia
RELATED REPORTS & OPTIONS
Information & Technology
Virginia
Compare Cities
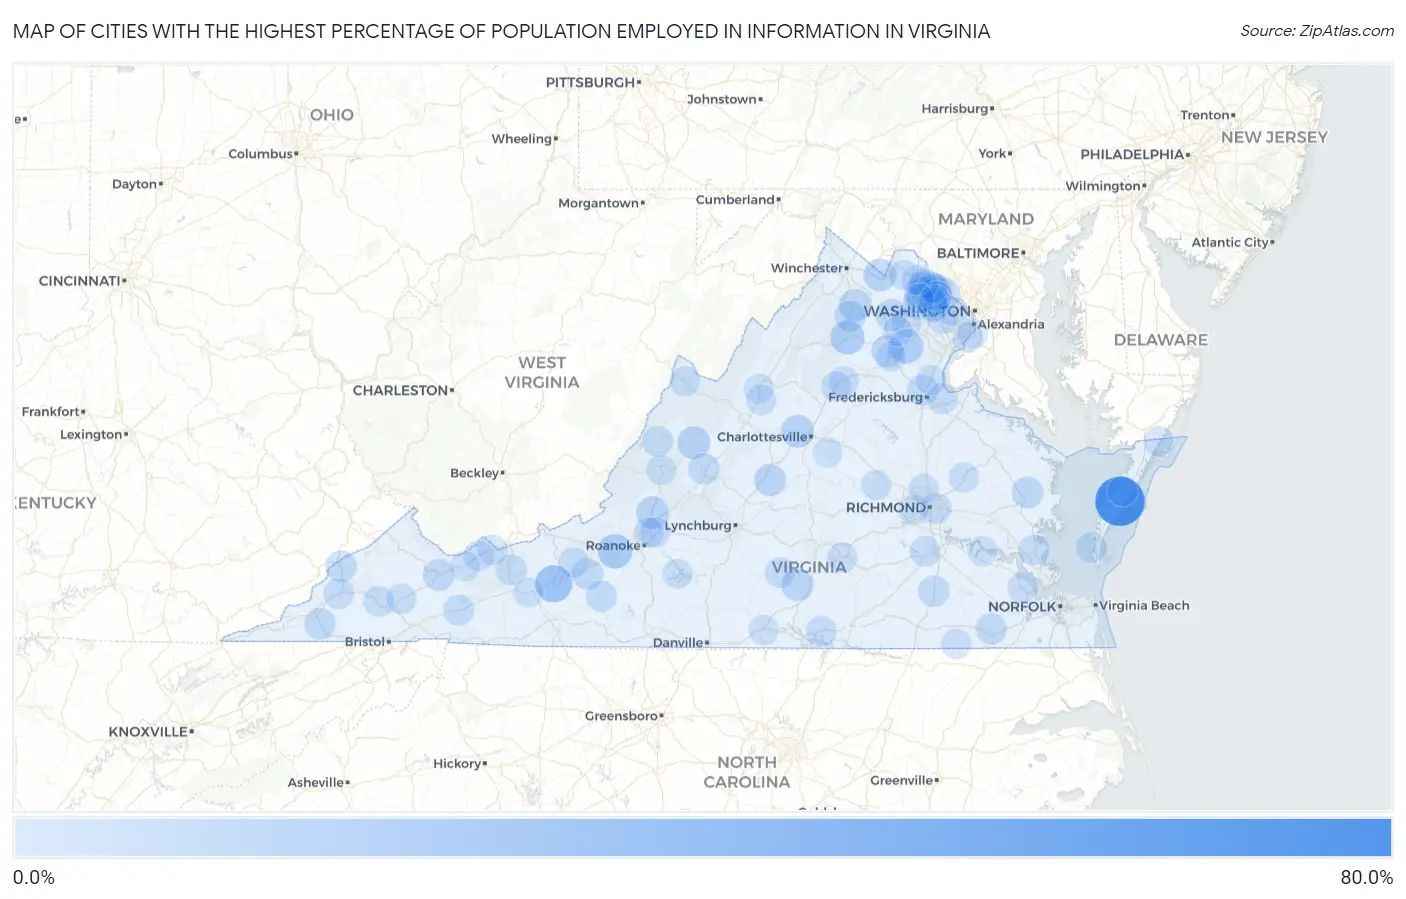
Map of Cities with the Highest Percentage of Population Employed in Information in Virginia
0.0%
80.0%
Cities with the Highest Percentage of Population Employed in Information in Virginia
| City | % Employed | vs State | vs National | |
| 1. | Mappsburg | 75.0% | 1.8%(+73.2)#1 | 1.9%(+73.1)#8 |
| 2. | Eagle Rock | 41.2% | 1.8%(+39.4)#2 | 1.9%(+39.3)#32 |
| 3. | Falls Mills | 37.1% | 1.8%(+35.3)#3 | 1.9%(+35.2)#39 |
| 4. | Draper | 27.8% | 1.8%(+26.0)#4 | 1.9%(+25.9)#62 |
| 5. | Lafayette | 18.4% | 1.8%(+16.6)#5 | 1.9%(+16.5)#126 |
| 6. | Catlett | 17.6% | 1.8%(+15.8)#6 | 1.9%(+15.7)#140 |
| 7. | Washington | 17.6% | 1.8%(+15.8)#7 | 1.9%(+15.7)#141 |
| 8. | Ivy | 13.1% | 1.8%(+11.3)#8 | 1.9%(+11.2)#246 |
| 9. | Fincastle | 12.7% | 1.8%(+10.8)#9 | 1.9%(+10.8)#265 |
| 10. | Earlysville | 12.6% | 1.8%(+10.8)#10 | 1.9%(+10.7)#267 |
| 11. | Shenandoah Retreat | 12.6% | 1.8%(+10.8)#11 | 1.9%(+10.7)#269 |
| 12. | Goshen | 12.5% | 1.8%(+10.7)#12 | 1.9%(+10.6)#271 |
| 13. | Hiltons | 11.1% | 1.8%(+9.30)#13 | 1.9%(+9.21)#324 |
| 14. | Skyland Estates | 11.0% | 1.8%(+9.19)#14 | 1.9%(+9.10)#333 |
| 15. | Drakes Branch | 10.5% | 1.8%(+8.72)#15 | 1.9%(+8.63)#358 |
| 16. | Shipman | 10.5% | 1.8%(+8.65)#16 | 1.9%(+8.56)#362 |
| 17. | Opal | 9.7% | 1.8%(+7.88)#17 | 1.9%(+7.79)#423 |
| 18. | Urbanna | 9.6% | 1.8%(+7.81)#18 | 1.9%(+7.72)#429 |
| 19. | Claypool Hill | 9.3% | 1.8%(+7.46)#19 | 1.9%(+7.37)#454 |
| 20. | Arcola | 9.2% | 1.8%(+7.44)#20 | 1.9%(+7.35)#456 |
| 21. | The Plains | 8.7% | 1.8%(+6.92)#21 | 1.9%(+6.83)#509 |
| 22. | Duffield | 8.3% | 1.8%(+6.53)#22 | 1.9%(+6.43)#541 |
| 23. | Pound | 8.2% | 1.8%(+6.39)#23 | 1.9%(+6.30)#555 |
| 24. | East Lexington | 8.2% | 1.8%(+6.36)#24 | 1.9%(+6.27)#559 |
| 25. | Riner | 8.1% | 1.8%(+6.26)#25 | 1.9%(+6.17)#573 |
| 26. | Stony Creek | 7.8% | 1.8%(+6.02)#26 | 1.9%(+5.93)#601 |
| 27. | Southern Gateway | 7.8% | 1.8%(+5.97)#27 | 1.9%(+5.88)#611 |
| 28. | Chester Gap | 7.7% | 1.8%(+5.85)#28 | 1.9%(+5.76)#628 |
| 29. | Camptown | 7.6% | 1.8%(+5.83)#29 | 1.9%(+5.74)#630 |
| 30. | Mcmullin | 6.8% | 1.8%(+4.95)#30 | 1.9%(+4.86)#822 |
| 31. | Floyd | 6.6% | 1.8%(+4.76)#31 | 1.9%(+4.67)#867 |
| 32. | Passapatanzy | 6.0% | 1.8%(+4.23)#32 | 1.9%(+4.14)#1,019 |
| 33. | Bland | 6.0% | 1.8%(+4.17)#33 | 1.9%(+4.08)#1,044 |
| 34. | Castlewood | 5.9% | 1.8%(+4.07)#34 | 1.9%(+3.98)#1,065 |
| 35. | One Loudoun | 5.8% | 1.8%(+4.02)#35 | 1.9%(+3.93)#1,090 |
| 36. | Lowes Island | 5.8% | 1.8%(+4.01)#36 | 1.9%(+3.92)#1,092 |
| 37. | Cape Charles | 5.7% | 1.8%(+3.92)#37 | 1.9%(+3.83)#1,128 |
| 38. | Matoaca | 5.7% | 1.8%(+3.88)#38 | 1.9%(+3.79)#1,143 |
| 39. | Norton | 5.6% | 1.8%(+3.84)#39 | 1.9%(+3.75)#1,166 |
| 40. | Floris | 5.6% | 1.8%(+3.77)#40 | 1.9%(+3.68)#1,196 |
| 41. | Hot Springs | 5.6% | 1.8%(+3.75)#41 | 1.9%(+3.66)#1,206 |
| 42. | University Center | 5.4% | 1.8%(+3.64)#42 | 1.9%(+3.55)#1,249 |
| 43. | Great Falls | 5.3% | 1.8%(+3.51)#43 | 1.9%(+3.42)#1,308 |
| 44. | Phenix | 5.3% | 1.8%(+3.49)#44 | 1.9%(+3.40)#1,310 |
| 45. | Yorktown | 5.3% | 1.8%(+3.49)#45 | 1.9%(+3.40)#1,312 |
| 46. | Montrose | 5.3% | 1.8%(+3.47)#46 | 1.9%(+3.38)#1,322 |
| 47. | Brightwood | 5.2% | 1.8%(+3.43)#47 | 1.9%(+3.34)#1,347 |
| 48. | Boydton | 5.1% | 1.8%(+3.34)#48 | 1.9%(+3.25)#1,383 |
| 49. | Broadlands | 5.1% | 1.8%(+3.29)#49 | 1.9%(+3.20)#1,409 |
| 50. | Springville | 5.0% | 1.8%(+3.22)#50 | 1.9%(+3.13)#1,454 |
| 51. | Bluefield | 4.9% | 1.8%(+3.11)#51 | 1.9%(+3.02)#1,524 |
| 52. | Smithfield | 4.9% | 1.8%(+3.10)#52 | 1.9%(+3.01)#1,530 |
| 53. | Goochland | 4.9% | 1.8%(+3.09)#53 | 1.9%(+3.00)#1,534 |
| 54. | George Mason | 4.8% | 1.8%(+2.99)#54 | 1.9%(+2.90)#1,594 |
| 55. | Laymantown | 4.8% | 1.8%(+2.97)#55 | 1.9%(+2.88)#1,599 |
| 56. | Lebanon | 4.6% | 1.8%(+2.82)#56 | 1.9%(+2.73)#1,694 |
| 57. | Moorefield | 4.6% | 1.8%(+2.82)#57 | 1.9%(+2.73)#1,700 |
| 58. | Captains Cove | 4.6% | 1.8%(+2.79)#58 | 1.9%(+2.70)#1,724 |
| 59. | Boykins | 4.5% | 1.8%(+2.66)#59 | 1.9%(+2.57)#1,802 |
| 60. | Bealeton | 4.4% | 1.8%(+2.63)#60 | 1.9%(+2.54)#1,833 |
| 61. | Franklin Farm | 4.4% | 1.8%(+2.58)#61 | 1.9%(+2.49)#1,871 |
| 62. | Ashburn | 4.4% | 1.8%(+2.58)#62 | 1.9%(+2.49)#1,872 |
| 63. | Sugarland Run | 4.4% | 1.8%(+2.56)#63 | 1.9%(+2.47)#1,893 |
| 64. | Fairlawn | 4.2% | 1.8%(+2.42)#64 | 1.9%(+2.33)#2,009 |
| 65. | Cascades | 4.2% | 1.8%(+2.39)#65 | 1.9%(+2.30)#2,045 |
| 66. | Monterey | 4.2% | 1.8%(+2.36)#66 | 1.9%(+2.27)#2,072 |
| 67. | Central Garage | 4.1% | 1.8%(+2.29)#67 | 1.9%(+2.20)#2,130 |
| 68. | Cloverdale | 4.1% | 1.8%(+2.25)#68 | 1.9%(+2.16)#2,166 |
| 69. | Hamilton | 4.0% | 1.8%(+2.22)#69 | 1.9%(+2.13)#2,195 |
| 70. | Burkeville | 4.0% | 1.8%(+2.19)#70 | 1.9%(+2.10)#2,218 |
| 71. | Weyers Cave | 4.0% | 1.8%(+2.15)#71 | 1.9%(+2.06)#2,259 |
| 72. | Madison | 4.0% | 1.8%(+2.15)#72 | 1.9%(+2.06)#2,272 |
| 73. | Dunn Loring | 4.0% | 1.8%(+2.14)#73 | 1.9%(+2.05)#2,274 |
| 74. | Navy | 3.9% | 1.8%(+2.14)#74 | 1.9%(+2.05)#2,277 |
| 75. | Mount Vernon | 3.9% | 1.8%(+2.07)#75 | 1.9%(+1.98)#2,365 |
| 76. | Fort Hunt | 3.9% | 1.8%(+2.05)#76 | 1.9%(+1.96)#2,397 |
| 77. | Loudoun Valley Estates | 3.8% | 1.8%(+2.01)#77 | 1.9%(+1.92)#2,432 |
| 78. | North Shore | 3.8% | 1.8%(+1.98)#78 | 1.9%(+1.89)#2,459 |
| 79. | Iron Gate | 3.8% | 1.8%(+1.98)#79 | 1.9%(+1.89)#2,464 |
| 80. | Melfa | 3.8% | 1.8%(+1.98)#80 | 1.9%(+1.89)#2,472 |
| 81. | Belmont | 3.8% | 1.8%(+1.95)#81 | 1.9%(+1.86)#2,505 |
| 82. | Countryside | 3.7% | 1.8%(+1.88)#82 | 1.9%(+1.79)#2,609 |
| 83. | Lansdowne | 3.7% | 1.8%(+1.85)#83 | 1.9%(+1.76)#2,637 |
| 84. | Riverdale | 3.6% | 1.8%(+1.83)#84 | 1.9%(+1.74)#2,660 |
| 85. | Union Mill | 3.6% | 1.8%(+1.75)#85 | 1.9%(+1.66)#2,757 |
| 86. | Mount Crawford | 3.6% | 1.8%(+1.75)#86 | 1.9%(+1.66)#2,758 |
| 87. | Stafford Courthouse | 3.5% | 1.8%(+1.73)#87 | 1.9%(+1.64)#2,785 |
| 88. | Mcnair | 3.5% | 1.8%(+1.71)#88 | 1.9%(+1.62)#2,808 |
| 89. | Dranesville | 3.5% | 1.8%(+1.71)#89 | 1.9%(+1.62)#2,819 |
| 90. | Herndon | 3.5% | 1.8%(+1.70)#90 | 1.9%(+1.61)#2,831 |
| 91. | Bon Air | 3.5% | 1.8%(+1.67)#91 | 1.9%(+1.58)#2,855 |
| 92. | Haymarket | 3.5% | 1.8%(+1.67)#92 | 1.9%(+1.58)#2,860 |
| 93. | Brambleton | 3.5% | 1.8%(+1.65)#93 | 1.9%(+1.56)#2,885 |
| 94. | Leesburg | 3.3% | 1.8%(+1.54)#94 | 1.9%(+1.45)#3,049 |
| 95. | New Baltimore | 3.3% | 1.8%(+1.53)#95 | 1.9%(+1.44)#3,054 |
| 96. | Fort Chiswell | 3.3% | 1.8%(+1.52)#96 | 1.9%(+1.43)#3,083 |
| 97. | Tazewell | 3.3% | 1.8%(+1.52)#97 | 1.9%(+1.43)#3,087 |
| 98. | Glen Allen | 3.3% | 1.8%(+1.50)#98 | 1.9%(+1.41)#3,113 |
| 99. | Claremont | 3.3% | 1.8%(+1.49)#99 | 1.9%(+1.40)#3,124 |
| 100. | Lake Monticello | 3.3% | 1.8%(+1.48)#100 | 1.9%(+1.39)#3,144 |
Common Questions
What are the Top 10 Cities with the Highest Percentage of Population Employed in Information in Virginia?
Top 10 Cities with the Highest Percentage of Population Employed in Information in Virginia are:
#1
75.0%
#2
27.8%
#3
18.4%
#4
17.6%
#5
17.6%
#6
13.1%
#7
12.7%
#8
12.6%
#9
12.5%
#10
11.0%
What city has the Highest Percentage of Population Employed in Information in Virginia?
Mappsburg has the Highest Percentage of Population Employed in Information in Virginia with 75.0%.
What is the Percentage of Population Employed in Information in the State of Virginia?
Percentage of Population Employed in Information in Virginia is 1.8%.
What is the Percentage of Population Employed in Information in the United States?
Percentage of Population Employed in Information in the United States is 1.9%.