Cities with the Highest Percentage of Population Employed in Information in Colorado
RELATED REPORTS & OPTIONS
Information & Technology
Colorado
Compare Cities
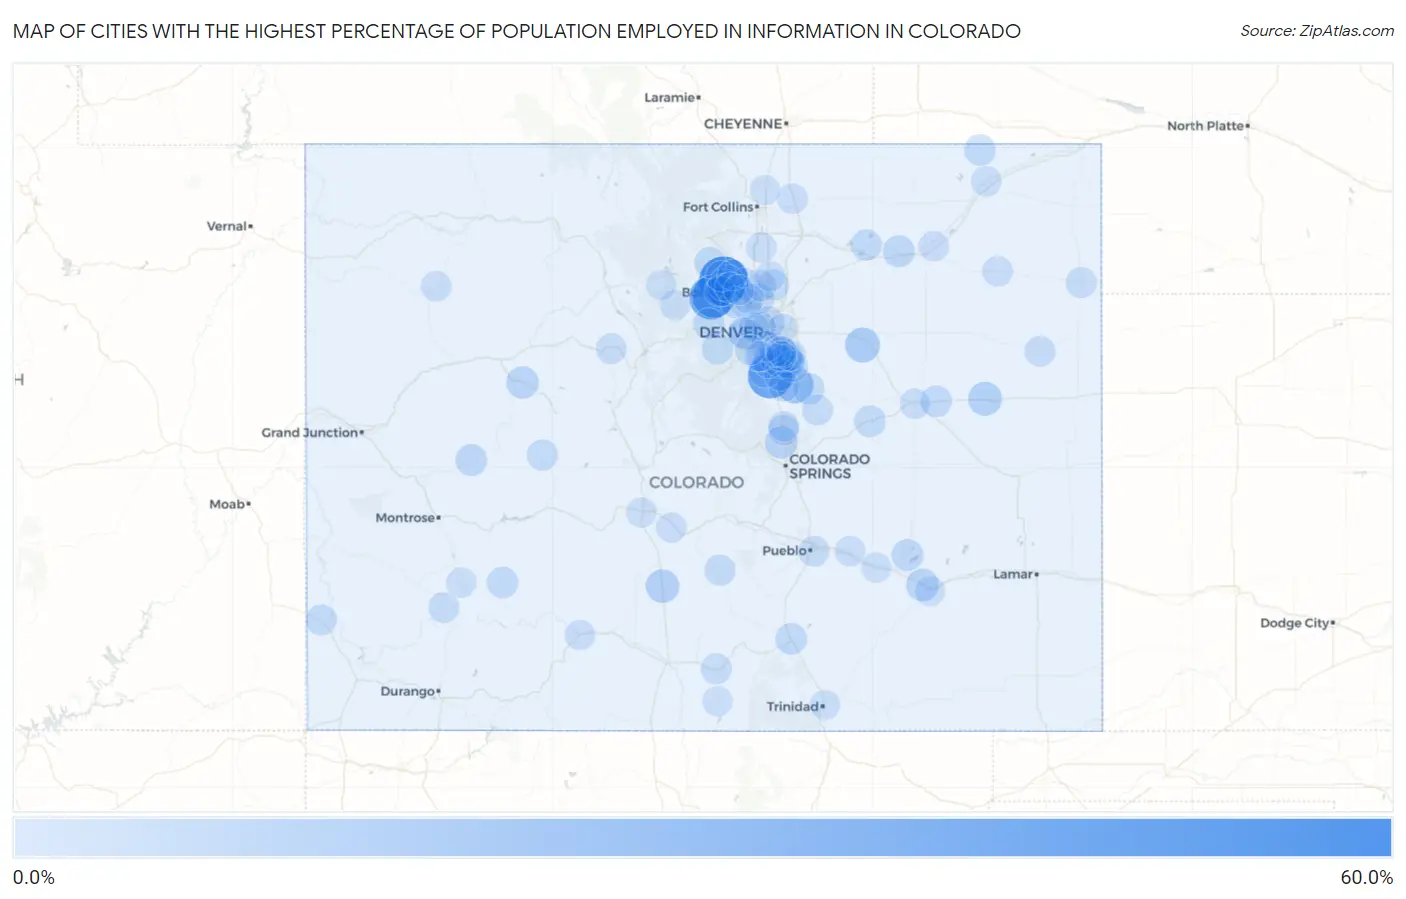
Map of Cities with the Highest Percentage of Population Employed in Information in Colorado
0.0%
60.0%
Cities with the Highest Percentage of Population Employed in Information in Colorado
| City | % Employed | vs State | vs National | |
| 1. | Glendale | 57.1% | 2.7%(+54.5)#1 | 1.9%(+55.2)#14 |
| 2. | Sedalia | 42.1% | 2.7%(+39.4)#2 | 1.9%(+40.2)#31 |
| 3. | Bonanza Mountain Estates | 40.6% | 2.7%(+37.9)#3 | 1.9%(+38.7)#34 |
| 4. | St Ann Highlands | 38.6% | 2.7%(+35.9)#4 | 1.9%(+36.7)#36 |
| 5. | Franktown | 21.2% | 2.7%(+18.5)#5 | 1.9%(+19.3)#97 |
| 6. | Peoria | 15.6% | 2.7%(+13.0)#6 | 1.9%(+13.7)#175 |
| 7. | Flagler | 12.5% | 2.7%(+9.83)#7 | 1.9%(+10.6)#270 |
| 8. | Moffat | 12.1% | 2.7%(+9.45)#8 | 1.9%(+10.2)#287 |
| 9. | Grand View Estates | 10.0% | 2.7%(+7.28)#9 | 1.9%(+8.06)#400 |
| 10. | Louviers | 9.7% | 2.7%(+7.05)#10 | 1.9%(+7.82)#420 |
| 11. | Swink | 9.7% | 2.7%(+7.01)#11 | 1.9%(+7.79)#422 |
| 12. | Stepping Stone | 9.5% | 2.7%(+6.87)#12 | 1.9%(+7.65)#433 |
| 13. | Air Force Academy | 9.4% | 2.7%(+6.75)#13 | 1.9%(+7.53)#444 |
| 14. | Catherine | 9.2% | 2.7%(+6.50)#14 | 1.9%(+7.28)#463 |
| 15. | Lazy Acres | 8.8% | 2.7%(+6.17)#15 | 1.9%(+6.94)#498 |
| 16. | Acres Green | 8.8% | 2.7%(+6.12)#16 | 1.9%(+6.89)#502 |
| 17. | Mountain Meadows | 8.2% | 2.7%(+5.49)#17 | 1.9%(+6.26)#561 |
| 18. | West Pleasant View | 8.1% | 2.7%(+5.45)#18 | 1.9%(+6.22)#565 |
| 19. | Morgan Heights | 7.8% | 2.7%(+5.10)#19 | 1.9%(+5.88)#609 |
| 20. | Ordway | 7.5% | 2.7%(+4.83)#20 | 1.9%(+5.61)#654 |
| 21. | Lone Tree | 7.4% | 2.7%(+4.75)#21 | 1.9%(+5.53)#672 |
| 22. | North Washington | 7.4% | 2.7%(+4.73)#22 | 1.9%(+5.51)#681 |
| 23. | Stonegate | 7.2% | 2.7%(+4.50)#23 | 1.9%(+5.27)#727 |
| 24. | Paonia | 7.1% | 2.7%(+4.44)#24 | 1.9%(+5.21)#744 |
| 25. | Simla | 6.9% | 2.7%(+4.27)#25 | 1.9%(+5.05)#784 |
| 26. | Sunshine | 6.9% | 2.7%(+4.18)#26 | 1.9%(+4.96)#804 |
| 27. | Mountain View | 6.7% | 2.7%(+4.03)#27 | 1.9%(+4.80)#828 |
| 28. | Walsenburg | 6.7% | 2.7%(+3.99)#28 | 1.9%(+4.76)#843 |
| 29. | Dove Valley | 6.6% | 2.7%(+3.95)#29 | 1.9%(+4.72)#855 |
| 30. | Eldorado Springs | 6.5% | 2.7%(+3.83)#30 | 1.9%(+4.61)#880 |
| 31. | Genoa | 6.5% | 2.7%(+3.78)#31 | 1.9%(+4.55)#891 |
| 32. | Elizabeth | 6.3% | 2.7%(+3.64)#32 | 1.9%(+4.41)#930 |
| 33. | Castle Pines | 6.3% | 2.7%(+3.62)#33 | 1.9%(+4.40)#937 |
| 34. | Peetz | 6.2% | 2.7%(+3.58)#34 | 1.9%(+4.35)#948 |
| 35. | Lake City | 6.1% | 2.7%(+3.43)#35 | 1.9%(+4.20)#992 |
| 36. | Upper Bear Creek | 6.0% | 2.7%(+3.37)#36 | 1.9%(+4.15)#1,014 |
| 37. | Parker | 6.0% | 2.7%(+3.36)#37 | 1.9%(+4.13)#1,022 |
| 38. | Gunbarrel | 5.8% | 2.7%(+3.14)#38 | 1.9%(+3.91)#1,096 |
| 39. | Foxfield | 5.7% | 2.7%(+3.05)#39 | 1.9%(+3.82)#1,129 |
| 40. | Mount Crested Butte | 5.7% | 2.7%(+3.03)#40 | 1.9%(+3.80)#1,140 |
| 41. | Allenspark | 5.7% | 2.7%(+2.99)#41 | 1.9%(+3.76)#1,157 |
| 42. | Black Hawk | 5.6% | 2.7%(+2.88)#42 | 1.9%(+3.66)#1,208 |
| 43. | Orchard | 5.6% | 2.7%(+2.88)#43 | 1.9%(+3.66)#1,211 |
| 44. | Highlands Ranch | 5.5% | 2.7%(+2.81)#44 | 1.9%(+3.58)#1,231 |
| 45. | Silver Cliff | 5.4% | 2.7%(+2.71)#45 | 1.9%(+3.48)#1,273 |
| 46. | Dove Creek | 5.3% | 2.7%(+2.64)#46 | 1.9%(+3.42)#1,307 |
| 47. | Dacono | 5.2% | 2.7%(+2.58)#47 | 1.9%(+3.35)#1,342 |
| 48. | Fort Garland | 5.2% | 2.7%(+2.48)#48 | 1.9%(+3.26)#1,379 |
| 49. | Superior | 5.0% | 2.7%(+2.30)#49 | 1.9%(+3.07)#1,488 |
| 50. | Wray | 4.9% | 2.7%(+2.24)#50 | 1.9%(+3.02)#1,528 |
| 51. | Monument | 4.8% | 2.7%(+2.14)#51 | 1.9%(+2.92)#1,582 |
| 52. | Blende | 4.8% | 2.7%(+2.10)#52 | 1.9%(+2.88)#1,601 |
| 53. | Ophir | 4.8% | 2.7%(+2.09)#53 | 1.9%(+2.86)#1,613 |
| 54. | Kirk | 4.7% | 2.7%(+1.98)#54 | 1.9%(+2.75)#1,680 |
| 55. | Sugarloaf | 4.6% | 2.7%(+1.97)#55 | 1.9%(+2.74)#1,687 |
| 56. | Elbert | 4.6% | 2.7%(+1.96)#56 | 1.9%(+2.73)#1,695 |
| 57. | Broomfield | 4.6% | 2.7%(+1.95)#57 | 1.9%(+2.73)#1,698 |
| 58. | Centennial | 4.4% | 2.7%(+1.69)#58 | 1.9%(+2.47)#1,894 |
| 59. | Vail | 4.3% | 2.7%(+1.66)#59 | 1.9%(+2.43)#1,923 |
| 60. | Louisville | 4.3% | 2.7%(+1.64)#60 | 1.9%(+2.41)#1,938 |
| 61. | Cherry Hills Village | 4.2% | 2.7%(+1.58)#61 | 1.9%(+2.35)#1,992 |
| 62. | Castle Rock | 4.2% | 2.7%(+1.50)#62 | 1.9%(+2.27)#2,062 |
| 63. | Greenwood Village | 4.2% | 2.7%(+1.49)#63 | 1.9%(+2.26)#2,088 |
| 64. | Jamestown | 4.1% | 2.7%(+1.47)#64 | 1.9%(+2.25)#2,093 |
| 65. | Woodmoor | 4.1% | 2.7%(+1.41)#65 | 1.9%(+2.18)#2,144 |
| 66. | Otis | 4.0% | 2.7%(+1.29)#66 | 1.9%(+2.06)#2,266 |
| 67. | Pierce | 3.9% | 2.7%(+1.22)#67 | 1.9%(+2.00)#2,351 |
| 68. | Hillrose | 3.8% | 2.7%(+1.17)#68 | 1.9%(+1.95)#2,406 |
| 69. | Meeker | 3.8% | 2.7%(+1.14)#69 | 1.9%(+1.92)#2,434 |
| 70. | Limon | 3.8% | 2.7%(+1.11)#70 | 1.9%(+1.89)#2,466 |
| 71. | Altona | 3.7% | 2.7%(+1.05)#71 | 1.9%(+1.83)#2,544 |
| 72. | Boone | 3.7% | 2.7%(+1.03)#72 | 1.9%(+1.81)#2,579 |
| 73. | Berthoud | 3.7% | 2.7%(+0.982)#73 | 1.9%(+1.76)#2,645 |
| 74. | South Fork | 3.6% | 2.7%(+0.963)#74 | 1.9%(+1.74)#2,671 |
| 75. | Sierra Ridge | 3.6% | 2.7%(+0.926)#75 | 1.9%(+1.70)#2,714 |
| 76. | Iliff | 3.6% | 2.7%(+0.898)#76 | 1.9%(+1.67)#2,749 |
| 77. | Four Square Mile | 3.5% | 2.7%(+0.873)#77 | 1.9%(+1.65)#2,774 |
| 78. | Howard | 3.5% | 2.7%(+0.865)#78 | 1.9%(+1.64)#2,787 |
| 79. | Englewood | 3.5% | 2.7%(+0.861)#79 | 1.9%(+1.64)#2,790 |
| 80. | Erie | 3.5% | 2.7%(+0.788)#80 | 1.9%(+1.56)#2,886 |
| 81. | Denver | 3.4% | 2.7%(+0.716)#81 | 1.9%(+1.49)#2,980 |
| 82. | Fowler | 3.3% | 2.7%(+0.660)#82 | 1.9%(+1.43)#3,064 |
| 83. | Golden | 3.3% | 2.7%(+0.657)#83 | 1.9%(+1.43)#3,077 |
| 84. | Frederick | 3.3% | 2.7%(+0.630)#84 | 1.9%(+1.41)#3,115 |
| 85. | La Junta | 3.3% | 2.7%(+0.625)#85 | 1.9%(+1.40)#3,122 |
| 86. | Pine Brook Hill | 3.2% | 2.7%(+0.576)#86 | 1.9%(+1.35)#3,192 |
| 87. | Ouray | 3.2% | 2.7%(+0.565)#87 | 1.9%(+1.34)#3,204 |
| 88. | Wellington | 3.2% | 2.7%(+0.546)#88 | 1.9%(+1.32)#3,243 |
| 89. | Littleton | 3.2% | 2.7%(+0.534)#89 | 1.9%(+1.31)#3,256 |
| 90. | Wheat Ridge | 3.2% | 2.7%(+0.507)#90 | 1.9%(+1.28)#3,308 |
| 91. | Columbine | 3.2% | 2.7%(+0.497)#91 | 1.9%(+1.27)#3,335 |
| 92. | Fraser | 3.1% | 2.7%(+0.475)#92 | 1.9%(+1.25)#3,382 |
| 93. | Cherry Creek | 3.1% | 2.7%(+0.473)#93 | 1.9%(+1.25)#3,387 |
| 94. | Poncha Springs | 3.1% | 2.7%(+0.463)#94 | 1.9%(+1.24)#3,401 |
| 95. | Inverness | 3.1% | 2.7%(+0.443)#95 | 1.9%(+1.22)#3,439 |
| 96. | Granby | 3.1% | 2.7%(+0.439)#96 | 1.9%(+1.21)#3,447 |
| 97. | San Luis | 3.1% | 2.7%(+0.428)#97 | 1.9%(+1.20)#3,465 |
| 98. | Boulder | 3.0% | 2.7%(+0.325)#98 | 1.9%(+1.10)#3,668 |
| 99. | Dakota Ridge | 3.0% | 2.7%(+0.301)#99 | 1.9%(+1.08)#3,717 |
| 100. | Trinidad | 2.9% | 2.7%(+0.244)#100 | 1.9%(+1.02)#3,816 |
Common Questions
What are the Top 10 Cities with the Highest Percentage of Population Employed in Information in Colorado?
Top 10 Cities with the Highest Percentage of Population Employed in Information in Colorado are:
#1
57.1%
#2
42.1%
#3
40.6%
#4
38.6%
#5
21.2%
#6
15.6%
#7
12.5%
#8
12.1%
#9
10.0%
#10
9.7%
What city has the Highest Percentage of Population Employed in Information in Colorado?
Glendale has the Highest Percentage of Population Employed in Information in Colorado with 57.1%.
What is the Percentage of Population Employed in Information in the State of Colorado?
Percentage of Population Employed in Information in Colorado is 2.7%.
What is the Percentage of Population Employed in Information in the United States?
Percentage of Population Employed in Information in the United States is 1.9%.