Cities with the Highest Percentage of Population Employed in Information in Alabama
RELATED REPORTS & OPTIONS
Information & Technology
Alabama
Compare Cities
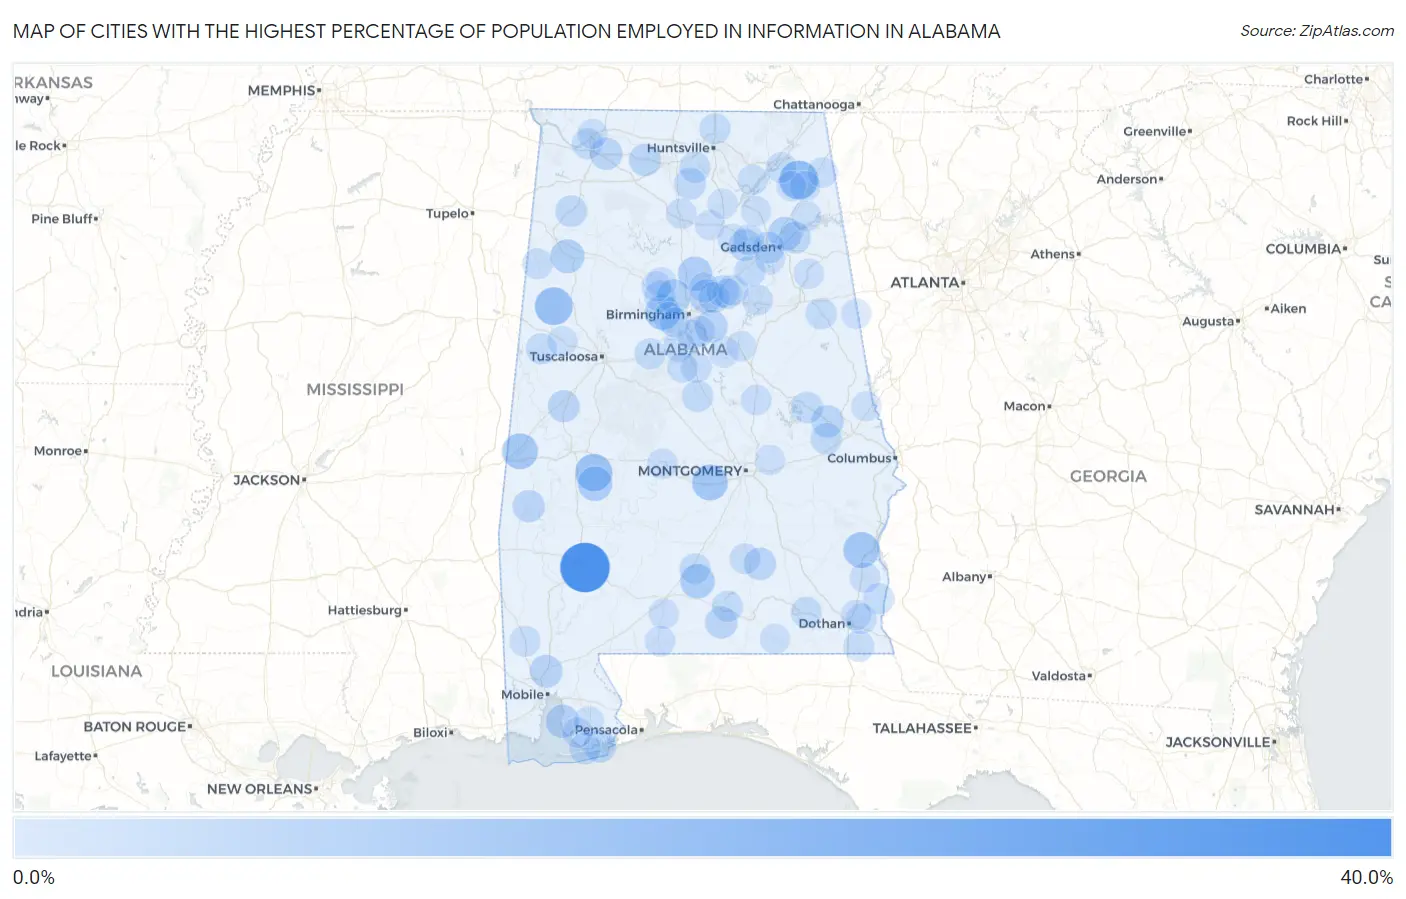
Map of Cities with the Highest Percentage of Population Employed in Information in Alabama
0.0%
40.0%
Cities with the Highest Percentage of Population Employed in Information in Alabama
| City | % Employed | vs State | vs National | |
| 1. | Whatley | 30.3% | 1.3%(+29.0)#1 | 1.9%(+28.4)#53 |
| 2. | Rainsville | 14.3% | 1.3%(+13.0)#2 | 1.9%(+12.4)#209 |
| 3. | Kennedy | 12.9% | 1.3%(+11.6)#3 | 1.9%(+11.0)#254 |
| 4. | Dayton | 11.8% | 1.3%(+10.5)#4 | 1.9%(+9.87)#303 |
| 5. | Bakerhill | 9.9% | 1.3%(+8.63)#5 | 1.9%(+8.01)#403 |
| 6. | Lowndesboro | 9.8% | 1.3%(+8.52)#6 | 1.9%(+7.91)#409 |
| 7. | York | 9.8% | 1.3%(+8.50)#7 | 1.9%(+7.89)#411 |
| 8. | Mount Olive Cdp Jefferson County | 9.4% | 1.3%(+8.11)#8 | 1.9%(+7.49)#446 |
| 9. | Sylvan Springs | 8.6% | 1.3%(+7.32)#9 | 1.9%(+6.71)#516 |
| 10. | Thomaston | 8.1% | 1.3%(+6.86)#10 | 1.9%(+6.24)#563 |
| 11. | Mckenzie | 8.0% | 1.3%(+6.70)#11 | 1.9%(+6.08)#585 |
| 12. | Trafford | 7.6% | 1.3%(+6.35)#12 | 1.9%(+5.73)#632 |
| 13. | Cardiff | 7.1% | 1.3%(+5.86)#13 | 1.9%(+5.24)#739 |
| 14. | Lookout Mountain | 7.1% | 1.3%(+5.80)#14 | 1.9%(+5.18)#747 |
| 15. | Gu Win | 7.0% | 1.3%(+5.76)#15 | 1.9%(+5.14)#759 |
| 16. | Grayson Valley | 6.9% | 1.3%(+5.59)#16 | 1.9%(+4.97)#803 |
| 17. | Point Clear | 6.3% | 1.3%(+5.01)#17 | 1.9%(+4.40)#938 |
| 18. | Satsuma | 5.6% | 1.3%(+4.28)#18 | 1.9%(+3.66)#1,205 |
| 19. | Shoal Creek | 5.5% | 1.3%(+4.20)#19 | 1.9%(+3.59)#1,230 |
| 20. | Orange Beach | 5.2% | 1.3%(+3.93)#20 | 1.9%(+3.32)#1,353 |
| 21. | Waverly | 5.1% | 1.3%(+3.85)#21 | 1.9%(+3.23)#1,396 |
| 22. | Leighton | 5.1% | 1.3%(+3.80)#22 | 1.9%(+3.19)#1,422 |
| 23. | Glenwood | 5.0% | 1.3%(+3.72)#23 | 1.9%(+3.10)#1,471 |
| 24. | Carolina | 5.0% | 1.3%(+3.68)#24 | 1.9%(+3.06)#1,499 |
| 25. | Butler | 4.8% | 1.3%(+3.55)#25 | 1.9%(+2.93)#1,573 |
| 26. | Hillsboro | 4.8% | 1.3%(+3.54)#26 | 1.9%(+2.92)#1,579 |
| 27. | Eutaw | 4.6% | 1.3%(+3.32)#27 | 1.9%(+2.70)#1,721 |
| 28. | Altoona | 4.5% | 1.3%(+3.26)#28 | 1.9%(+2.65)#1,746 |
| 29. | Coats Bend | 4.5% | 1.3%(+3.18)#29 | 1.9%(+2.57)#1,809 |
| 30. | Somerville | 4.3% | 1.3%(+3.07)#30 | 1.9%(+2.45)#1,908 |
| 31. | Argo | 4.3% | 1.3%(+3.02)#31 | 1.9%(+2.40)#1,942 |
| 32. | Attalla | 4.2% | 1.3%(+2.94)#32 | 1.9%(+2.32)#2,024 |
| 33. | Hackleburg | 4.2% | 1.3%(+2.89)#33 | 1.9%(+2.27)#2,065 |
| 34. | Loachapoka | 3.9% | 1.3%(+2.66)#34 | 1.9%(+2.04)#2,294 |
| 35. | Thorsby | 3.9% | 1.3%(+2.64)#35 | 1.9%(+2.03)#2,306 |
| 36. | Dadeville | 3.9% | 1.3%(+2.64)#36 | 1.9%(+2.02)#2,312 |
| 37. | West Jefferson | 3.9% | 1.3%(+2.61)#37 | 1.9%(+1.99)#2,358 |
| 38. | Gulf Shores | 3.8% | 1.3%(+2.50)#38 | 1.9%(+1.88)#2,476 |
| 39. | Sheffield | 3.5% | 1.3%(+2.26)#39 | 1.9%(+1.64)#2,786 |
| 40. | Ashville | 3.5% | 1.3%(+2.24)#40 | 1.9%(+1.62)#2,803 |
| 41. | Triana | 3.3% | 1.3%(+2.07)#41 | 1.9%(+1.45)#3,042 |
| 42. | Hollis Crossroads | 3.3% | 1.3%(+2.07)#42 | 1.9%(+1.45)#3,045 |
| 43. | Heath | 3.3% | 1.3%(+2.02)#43 | 1.9%(+1.40)#3,126 |
| 44. | Haleburg | 3.3% | 1.3%(+2.00)#44 | 1.9%(+1.38)#3,152 |
| 45. | Carrollton | 3.3% | 1.3%(+1.97)#45 | 1.9%(+1.35)#3,187 |
| 46. | Meridianville | 3.2% | 1.3%(+1.92)#46 | 1.9%(+1.30)#3,264 |
| 47. | Woodstock | 3.2% | 1.3%(+1.90)#47 | 1.9%(+1.28)#3,315 |
| 48. | Level Plains | 3.2% | 1.3%(+1.89)#48 | 1.9%(+1.27)#3,327 |
| 49. | Mccalla | 3.2% | 1.3%(+1.89)#49 | 1.9%(+1.27)#3,334 |
| 50. | Walnut Grove | 3.2% | 1.3%(+1.89)#50 | 1.9%(+1.27)#3,341 |
| 51. | Helena | 3.2% | 1.3%(+1.88)#51 | 1.9%(+1.27)#3,351 |
| 52. | Trussville | 3.1% | 1.3%(+1.86)#52 | 1.9%(+1.25)#3,388 |
| 53. | Georgiana | 3.1% | 1.3%(+1.84)#53 | 1.9%(+1.22)#3,437 |
| 54. | Pleasant Grove | 3.1% | 1.3%(+1.83)#54 | 1.9%(+1.22)#3,440 |
| 55. | Rutledge | 3.0% | 1.3%(+1.69)#55 | 1.9%(+1.07)#3,727 |
| 56. | Citronelle | 2.9% | 1.3%(+1.62)#56 | 1.9%(+0.999)#3,865 |
| 57. | Sulligent | 2.8% | 1.3%(+1.57)#57 | 1.9%(+0.951)#3,982 |
| 58. | Odenville | 2.8% | 1.3%(+1.53)#58 | 1.9%(+0.912)#4,054 |
| 59. | Calera | 2.8% | 1.3%(+1.49)#59 | 1.9%(+0.872)#4,161 |
| 60. | Riverside | 2.7% | 1.3%(+1.47)#60 | 1.9%(+0.850)#4,216 |
| 61. | Cottonwood | 2.7% | 1.3%(+1.38)#61 | 1.9%(+0.762)#4,453 |
| 62. | Section | 2.6% | 1.3%(+1.34)#62 | 1.9%(+0.725)#4,549 |
| 63. | Rockford | 2.6% | 1.3%(+1.34)#63 | 1.9%(+0.719)#4,561 |
| 64. | South Vinemont | 2.6% | 1.3%(+1.30)#64 | 1.9%(+0.680)#4,681 |
| 65. | Webb | 2.6% | 1.3%(+1.30)#65 | 1.9%(+0.680)#4,683 |
| 66. | Pine Ridge | 2.6% | 1.3%(+1.29)#66 | 1.9%(+0.674)#4,700 |
| 67. | East Brewton | 2.5% | 1.3%(+1.25)#67 | 1.9%(+0.636)#4,811 |
| 68. | Kinsey | 2.5% | 1.3%(+1.21)#68 | 1.9%(+0.588)#4,950 |
| 69. | Montevallo | 2.5% | 1.3%(+1.17)#69 | 1.9%(+0.554)#5,069 |
| 70. | Sumiton | 2.4% | 1.3%(+1.15)#70 | 1.9%(+0.537)#5,122 |
| 71. | Hoover | 2.4% | 1.3%(+1.11)#71 | 1.9%(+0.491)#5,247 |
| 72. | Abbeville | 2.4% | 1.3%(+1.10)#72 | 1.9%(+0.486)#5,261 |
| 73. | Selma | 2.4% | 1.3%(+1.10)#73 | 1.9%(+0.481)#5,298 |
| 74. | Grant | 2.4% | 1.3%(+1.09)#74 | 1.9%(+0.468)#5,318 |
| 75. | Jacksonville | 2.3% | 1.3%(+1.03)#75 | 1.9%(+0.412)#5,518 |
| 76. | Magnolia Springs | 2.3% | 1.3%(+1.03)#76 | 1.9%(+0.412)#5,519 |
| 77. | Castleberry | 2.3% | 1.3%(+1.03)#77 | 1.9%(+0.409)#5,528 |
| 78. | Valley Head | 2.3% | 1.3%(+1.00)#78 | 1.9%(+0.383)#5,621 |
| 79. | Meadowbrook | 2.3% | 1.3%(+0.996)#79 | 1.9%(+0.379)#5,633 |
| 80. | Holly Pond | 2.2% | 1.3%(+0.955)#80 | 1.9%(+0.338)#5,782 |
| 81. | Eagle Point | 2.2% | 1.3%(+0.936)#81 | 1.9%(+0.319)#5,852 |
| 82. | Wilsonville | 2.1% | 1.3%(+0.864)#82 | 1.9%(+0.246)#6,099 |
| 83. | Midfield | 2.1% | 1.3%(+0.858)#83 | 1.9%(+0.240)#6,119 |
| 84. | Gordo | 2.1% | 1.3%(+0.853)#84 | 1.9%(+0.236)#6,131 |
| 85. | Samson | 2.1% | 1.3%(+0.851)#85 | 1.9%(+0.233)#6,146 |
| 86. | Albertville | 2.1% | 1.3%(+0.851)#86 | 1.9%(+0.233)#6,147 |
| 87. | Sand Rock | 2.1% | 1.3%(+0.847)#87 | 1.9%(+0.229)#6,168 |
| 88. | Emerald Mountain | 2.1% | 1.3%(+0.836)#88 | 1.9%(+0.218)#6,196 |
| 89. | Margaret | 2.1% | 1.3%(+0.830)#89 | 1.9%(+0.213)#6,215 |
| 90. | Childersburg | 2.1% | 1.3%(+0.825)#90 | 1.9%(+0.208)#6,231 |
| 91. | Ranburne | 2.1% | 1.3%(+0.785)#91 | 1.9%(+0.168)#6,407 |
| 92. | Florence | 2.0% | 1.3%(+0.764)#92 | 1.9%(+0.146)#6,471 |
| 93. | Susan Moore | 2.0% | 1.3%(+0.756)#93 | 1.9%(+0.139)#6,507 |
| 94. | Rainbow City | 2.0% | 1.3%(+0.751)#94 | 1.9%(+0.134)#6,525 |
| 95. | Dora | 2.0% | 1.3%(+0.751)#95 | 1.9%(+0.134)#6,527 |
| 96. | Fyffe | 2.0% | 1.3%(+0.723)#96 | 1.9%(+0.106)#6,634 |
| 97. | Arab | 2.0% | 1.3%(+0.704)#97 | 1.9%(+0.087)#6,718 |
| 98. | Pinson | 2.0% | 1.3%(+0.693)#98 | 1.9%(+0.075)#6,758 |
| 99. | Huguley | 1.9% | 1.3%(+0.636)#99 | 1.9%(+0.019)#7,001 |
| 100. | Summerdale | 1.9% | 1.3%(+0.634)#100 | 1.9%(+0.017)#7,014 |
Common Questions
What are the Top 10 Cities with the Highest Percentage of Population Employed in Information in Alabama?
Top 10 Cities with the Highest Percentage of Population Employed in Information in Alabama are:
#1
30.3%
#2
14.3%
#3
12.9%
#4
11.8%
#5
9.9%
#6
9.8%
#7
9.8%
#8
8.6%
#9
8.1%
#10
8.0%
What city has the Highest Percentage of Population Employed in Information in Alabama?
Whatley has the Highest Percentage of Population Employed in Information in Alabama with 30.3%.
What is the Percentage of Population Employed in Information in the State of Alabama?
Percentage of Population Employed in Information in Alabama is 1.3%.
What is the Percentage of Population Employed in Information in the United States?
Percentage of Population Employed in Information in the United States is 1.9%.