Cities with the Highest Percentage of Population Employed in Information in South Carolina
RELATED REPORTS & OPTIONS
Information & Technology
South Carolina
Compare Cities
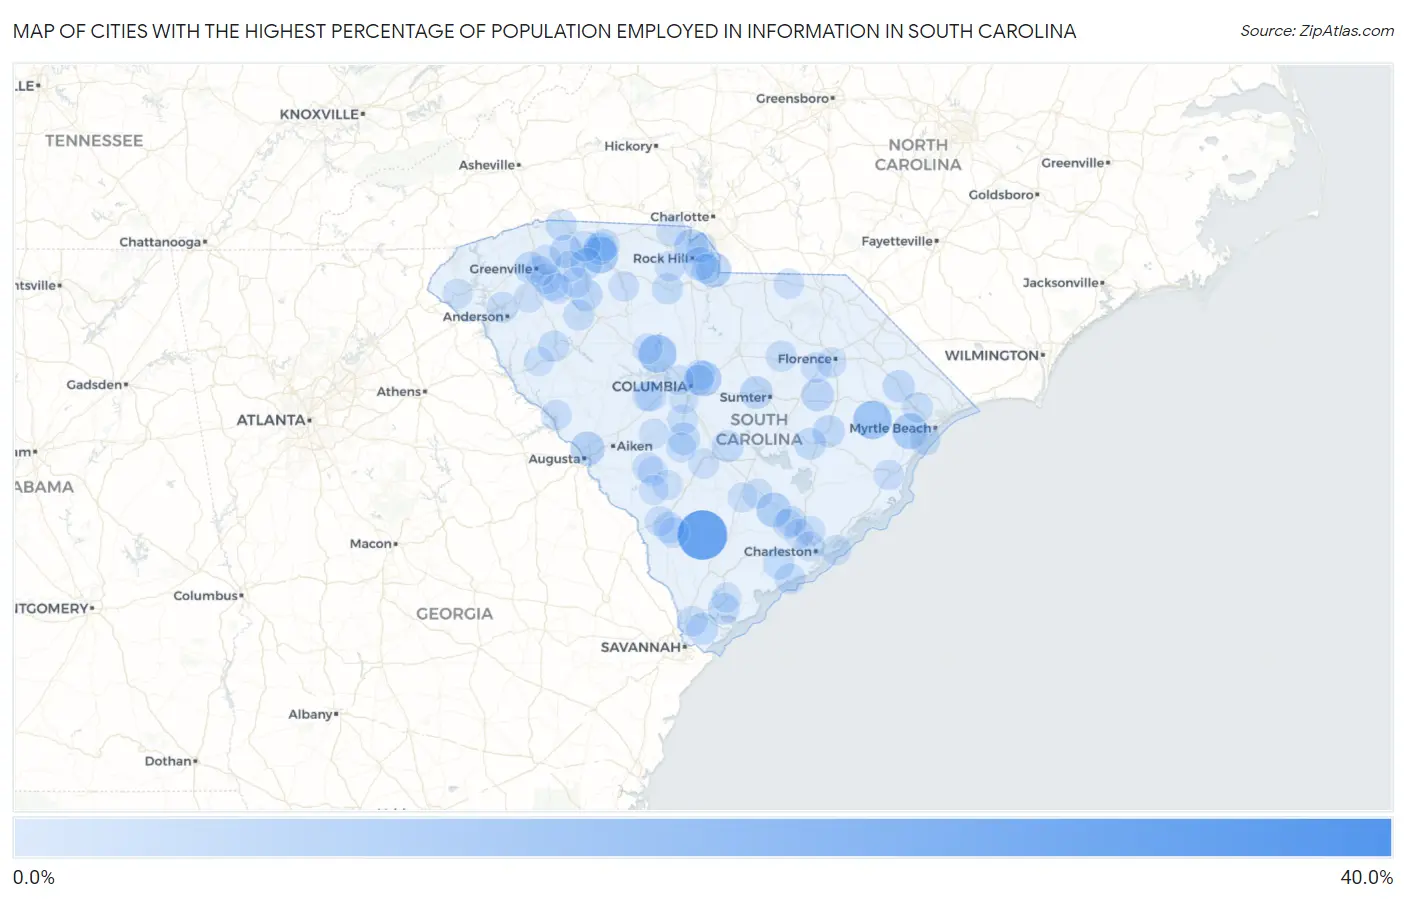
Map of Cities with the Highest Percentage of Population Employed in Information in South Carolina
0.0%
40.0%
Cities with the Highest Percentage of Population Employed in Information in South Carolina
| City | % Employed | vs State | vs National | |
| 1. | Zion | 34.5% | 1.5%(+33.0)#1 | 1.9%(+32.6)#48 |
| 2. | Islandton | 26.7% | 1.5%(+25.2)#2 | 1.9%(+24.8)#69 |
| 3. | Hemingway | 12.3% | 1.5%(+10.8)#3 | 1.9%(+10.4)#281 |
| 4. | Peak | 11.8% | 1.5%(+10.3)#4 | 1.9%(+9.87)#302 |
| 5. | Drayton | 11.3% | 1.5%(+9.78)#5 | 1.9%(+9.37)#319 |
| 6. | Glendale | 9.8% | 1.5%(+8.33)#6 | 1.9%(+7.92)#408 |
| 7. | Bucksport | 9.1% | 1.5%(+7.60)#7 | 1.9%(+7.19)#468 |
| 8. | Woodfield | 8.3% | 1.5%(+6.82)#8 | 1.9%(+6.41)#545 |
| 9. | Van Wyck | 8.0% | 1.5%(+6.47)#9 | 1.9%(+6.06)#589 |
| 10. | Ridgeville | 7.6% | 1.5%(+6.11)#10 | 1.9%(+5.70)#637 |
| 11. | Belvedere | 7.2% | 1.5%(+5.73)#11 | 1.9%(+5.32)#716 |
| 12. | Lobeco | 7.1% | 1.5%(+5.59)#12 | 1.9%(+5.18)#750 |
| 13. | India Hook | 6.8% | 1.5%(+5.35)#13 | 1.9%(+4.95)#806 |
| 14. | Helena | 6.4% | 1.5%(+4.89)#14 | 1.9%(+4.48)#909 |
| 15. | Lesslie | 5.8% | 1.5%(+4.29)#15 | 1.9%(+3.88)#1,106 |
| 16. | Lyman | 5.5% | 1.5%(+3.98)#16 | 1.9%(+3.57)#1,240 |
| 17. | Daviston | 5.4% | 1.5%(+3.89)#17 | 1.9%(+3.48)#1,275 |
| 18. | Olanta | 5.2% | 1.5%(+3.71)#18 | 1.9%(+3.30)#1,362 |
| 19. | Cherryvale | 5.2% | 1.5%(+3.68)#19 | 1.9%(+3.28)#1,367 |
| 20. | Olympia | 5.1% | 1.5%(+3.61)#20 | 1.9%(+3.20)#1,417 |
| 21. | Converse | 4.9% | 1.5%(+3.37)#21 | 1.9%(+2.96)#1,556 |
| 22. | Keowee Key | 4.8% | 1.5%(+3.33)#22 | 1.9%(+2.92)#1,583 |
| 23. | Kingstree | 4.8% | 1.5%(+3.26)#23 | 1.9%(+2.85)#1,618 |
| 24. | North | 4.7% | 1.5%(+3.24)#24 | 1.9%(+2.84)#1,626 |
| 25. | Debordieu Colony | 4.7% | 1.5%(+3.23)#25 | 1.9%(+2.82)#1,635 |
| 26. | Enoree | 4.5% | 1.5%(+3.03)#26 | 1.9%(+2.62)#1,767 |
| 27. | Aynor | 4.4% | 1.5%(+2.95)#27 | 1.9%(+2.54)#1,837 |
| 28. | Cameron | 4.3% | 1.5%(+2.78)#28 | 1.9%(+2.37)#1,970 |
| 29. | Greeleyville | 4.1% | 1.5%(+2.65)#29 | 1.9%(+2.24)#2,098 |
| 30. | Daufuskie Island | 4.1% | 1.5%(+2.63)#30 | 1.9%(+2.22)#2,115 |
| 31. | Cowpens | 4.0% | 1.5%(+2.53)#31 | 1.9%(+2.12)#2,205 |
| 32. | Bluffton | 3.9% | 1.5%(+2.41)#32 | 1.9%(+2.00)#2,350 |
| 33. | Parker | 3.9% | 1.5%(+2.40)#33 | 1.9%(+1.99)#2,359 |
| 34. | Port Royal | 3.8% | 1.5%(+2.35)#34 | 1.9%(+1.94)#2,414 |
| 35. | Roebuck | 3.8% | 1.5%(+2.28)#35 | 1.9%(+1.87)#2,498 |
| 36. | Clemson University | 3.8% | 1.5%(+2.28)#36 | 1.9%(+1.87)#2,502 |
| 37. | Baxter | 3.6% | 1.5%(+2.11)#37 | 1.9%(+1.70)#2,713 |
| 38. | Wyboo | 3.6% | 1.5%(+2.06)#38 | 1.9%(+1.65)#2,767 |
| 39. | Ben Avon | 3.5% | 1.5%(+1.99)#39 | 1.9%(+1.58)#2,859 |
| 40. | Landrum | 3.5% | 1.5%(+1.98)#40 | 1.9%(+1.57)#2,871 |
| 41. | Hodges | 3.4% | 1.5%(+1.90)#41 | 1.9%(+1.49)#2,977 |
| 42. | Fairfax | 3.4% | 1.5%(+1.86)#42 | 1.9%(+1.45)#3,039 |
| 43. | Meggett | 3.3% | 1.5%(+1.81)#43 | 1.9%(+1.40)#3,130 |
| 44. | Gayle Mill | 3.3% | 1.5%(+1.80)#44 | 1.9%(+1.39)#3,137 |
| 45. | Bishopville | 3.2% | 1.5%(+1.72)#45 | 1.9%(+1.31)#3,253 |
| 46. | Laurens | 3.0% | 1.5%(+1.56)#46 | 1.9%(+1.15)#3,570 |
| 47. | Northlake | 3.0% | 1.5%(+1.56)#47 | 1.9%(+1.15)#3,571 |
| 48. | White Knoll | 2.9% | 1.5%(+1.45)#48 | 1.9%(+1.04)#3,780 |
| 49. | Edmund | 2.9% | 1.5%(+1.43)#49 | 1.9%(+1.02)#3,814 |
| 50. | Reidville | 2.9% | 1.5%(+1.41)#50 | 1.9%(+1.00)#3,848 |
| 51. | Simpsonville | 2.9% | 1.5%(+1.41)#51 | 1.9%(+1.00)#3,853 |
| 52. | Seabrook Island | 2.9% | 1.5%(+1.38)#52 | 1.9%(+0.972)#3,934 |
| 53. | Surfside Beach | 2.8% | 1.5%(+1.27)#53 | 1.9%(+0.859)#4,191 |
| 54. | Conway | 2.7% | 1.5%(+1.25)#54 | 1.9%(+0.837)#4,261 |
| 55. | Valley Falls | 2.7% | 1.5%(+1.18)#55 | 1.9%(+0.775)#4,417 |
| 56. | Dentsville | 2.7% | 1.5%(+1.17)#56 | 1.9%(+0.761)#4,457 |
| 57. | Woodruff | 2.6% | 1.5%(+1.15)#57 | 1.9%(+0.744)#4,504 |
| 58. | Brunson | 2.6% | 1.5%(+1.14)#58 | 1.9%(+0.733)#4,534 |
| 59. | Swansea | 2.6% | 1.5%(+1.09)#59 | 1.9%(+0.680)#4,682 |
| 60. | Parksville | 2.6% | 1.5%(+1.07)#60 | 1.9%(+0.666)#4,737 |
| 61. | Timmonsville | 2.6% | 1.5%(+1.07)#61 | 1.9%(+0.660)#4,751 |
| 62. | Union | 2.5% | 1.5%(+1.05)#62 | 1.9%(+0.637)#4,808 |
| 63. | Mcconnells | 2.5% | 1.5%(+1.03)#63 | 1.9%(+0.617)#4,860 |
| 64. | Gilbert | 2.5% | 1.5%(+1.02)#64 | 1.9%(+0.611)#4,879 |
| 65. | Hardeeville | 2.5% | 1.5%(+0.984)#65 | 1.9%(+0.575)#5,003 |
| 66. | Clover | 2.4% | 1.5%(+0.960)#66 | 1.9%(+0.551)#5,077 |
| 67. | Hanahan | 2.4% | 1.5%(+0.954)#67 | 1.9%(+0.544)#5,099 |
| 68. | Mauldin | 2.4% | 1.5%(+0.911)#68 | 1.9%(+0.502)#5,208 |
| 69. | Fountain Inn | 2.4% | 1.5%(+0.894)#69 | 1.9%(+0.485)#5,270 |
| 70. | Cordova | 2.4% | 1.5%(+0.892)#70 | 1.9%(+0.483)#5,285 |
| 71. | Georgetown | 2.4% | 1.5%(+0.875)#71 | 1.9%(+0.466)#5,328 |
| 72. | Forest Acres | 2.3% | 1.5%(+0.848)#72 | 1.9%(+0.439)#5,427 |
| 73. | Williston | 2.3% | 1.5%(+0.844)#73 | 1.9%(+0.435)#5,434 |
| 74. | Pomaria | 2.3% | 1.5%(+0.836)#74 | 1.9%(+0.427)#5,475 |
| 75. | Greenville | 2.3% | 1.5%(+0.792)#75 | 1.9%(+0.382)#5,622 |
| 76. | Summit | 2.3% | 1.5%(+0.769)#76 | 1.9%(+0.360)#5,703 |
| 77. | Lincolnville | 2.3% | 1.5%(+0.763)#77 | 1.9%(+0.354)#5,724 |
| 78. | Ruby | 2.2% | 1.5%(+0.750)#78 | 1.9%(+0.340)#5,771 |
| 79. | Allendale | 2.2% | 1.5%(+0.727)#79 | 1.9%(+0.318)#5,856 |
| 80. | Isle Of Palms | 2.2% | 1.5%(+0.666)#80 | 1.9%(+0.257)#6,063 |
| 81. | Pine Ridge | 2.1% | 1.5%(+0.615)#81 | 1.9%(+0.206)#6,246 |
| 82. | Summerville | 2.1% | 1.5%(+0.596)#82 | 1.9%(+0.187)#6,323 |
| 83. | Elko | 2.1% | 1.5%(+0.594)#83 | 1.9%(+0.185)#6,338 |
| 84. | Abbeville | 2.1% | 1.5%(+0.584)#84 | 1.9%(+0.175)#6,378 |
| 85. | Westminster | 2.1% | 1.5%(+0.577)#85 | 1.9%(+0.168)#6,403 |
| 86. | Wagener | 2.0% | 1.5%(+0.543)#86 | 1.9%(+0.134)#6,522 |
| 87. | Pelzer | 2.0% | 1.5%(+0.538)#87 | 1.9%(+0.129)#6,542 |
| 88. | Hilda | 2.0% | 1.5%(+0.524)#88 | 1.9%(+0.115)#6,596 |
| 89. | Charleston | 2.0% | 1.5%(+0.516)#89 | 1.9%(+0.107)#6,625 |
| 90. | Harleyville | 2.0% | 1.5%(+0.516)#90 | 1.9%(+0.107)#6,630 |
| 91. | Florence | 2.0% | 1.5%(+0.514)#91 | 1.9%(+0.104)#6,646 |
| 92. | Livingston | 2.0% | 1.5%(+0.472)#92 | 1.9%(+0.062)#6,821 |
| 93. | North Charleston | 1.9% | 1.5%(+0.457)#93 | 1.9%(+0.047)#6,884 |
| 94. | Fort Mill | 1.9% | 1.5%(+0.429)#94 | 1.9%(+0.020)#6,997 |
| 95. | Barnwell | 1.9% | 1.5%(+0.416)#95 | 1.9%(+0.006)#7,054 |
| 96. | Beaufort | 1.9% | 1.5%(+0.413)#96 | 1.9%(+0.004)#7,073 |
| 97. | St George | 1.9% | 1.5%(+0.413)#97 | 1.9%(+0.003)#7,076 |
| 98. | Taylors | 1.9% | 1.5%(+0.403)#98 | 1.9%(-0.006)#7,113 |
| 99. | Seven Oaks | 1.9% | 1.5%(+0.400)#99 | 1.9%(-0.009)#7,124 |
| 100. | Catawba | 1.9% | 1.5%(+0.398)#100 | 1.9%(-0.012)#7,133 |
Common Questions
What are the Top 10 Cities with the Highest Percentage of Population Employed in Information in South Carolina?
Top 10 Cities with the Highest Percentage of Population Employed in Information in South Carolina are:
#1
26.7%
#2
12.3%
#3
11.8%
#4
9.8%
#5
9.1%
#6
8.3%
#7
8.0%
#8
7.6%
#9
7.2%
#10
6.8%
What city has the Highest Percentage of Population Employed in Information in South Carolina?
Islandton has the Highest Percentage of Population Employed in Information in South Carolina with 26.7%.
What is the Percentage of Population Employed in Information in the State of South Carolina?
Percentage of Population Employed in Information in South Carolina is 1.5%.
What is the Percentage of Population Employed in Information in the United States?
Percentage of Population Employed in Information in the United States is 1.9%.