Cities with the Highest Percentage of Population Employed in Information in the United States
RELATED REPORTS & OPTIONS
Information & Technology
United States
Compare Cities
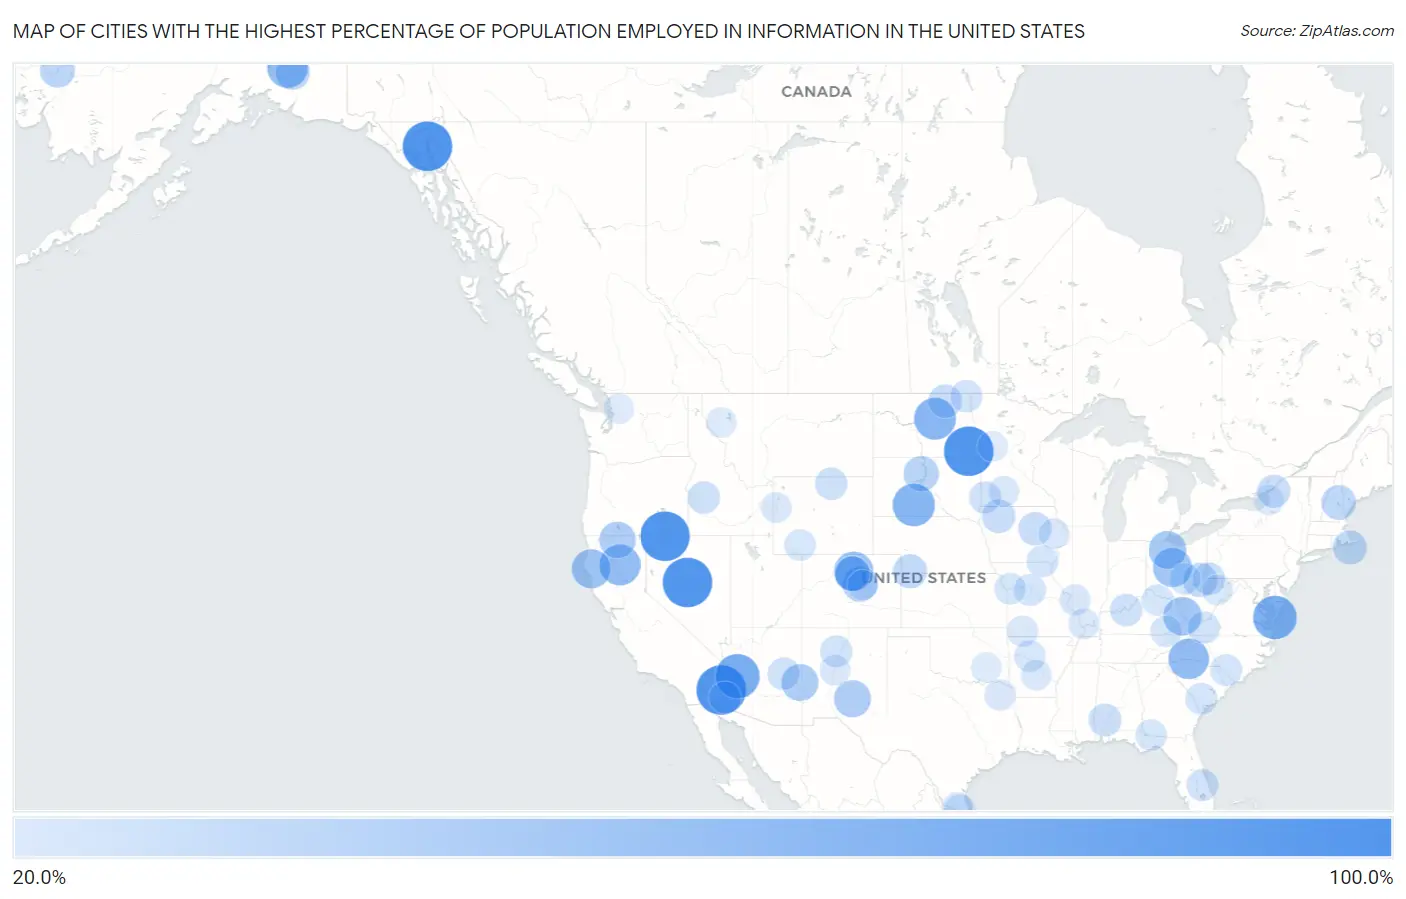
Map of Cities with the Highest Percentage of Population Employed in Information in the United States
0.0%
100.0%
Cities with the Highest Percentage of Population Employed in Information in the United States
| City | % Employed | vs State | vs National | |
| 1. | Palo Verde | 100.0% | 2.9%(+97.1)#1 | 1.9%(+98.1)#1 |
| 2. | Mud Bay | 100.0% | 1.7%(+98.3)#1 | 1.9%(+98.1)#2 |
| 3. | Deer Canyon | 100.0% | 1.4%(+98.6)#1 | 1.9%(+98.1)#3 |
| 4. | De Lamere | 100.0% | 1.1%(+98.9)#1 | 1.9%(+98.1)#4 |
| 5. | Austin | 100.0% | 1.5%(+98.5)#1 | 1.9%(+98.1)#5 |
| 6. | Denio | 100.0% | 1.5%(+98.5)#2 | 1.9%(+98.1)#6 |
| 7. | Alamo Lake | 77.8% | 1.7%(+76.1)#1 | 1.9%(+75.9)#7 |
| 8. | Mappsburg | 75.0% | 1.8%(+73.2)#1 | 1.9%(+73.1)#8 |
| 9. | Corn Creek | 70.0% | 1.5%(+68.5)#1 | 1.9%(+68.1)#9 |
| 10. | Heimdal | 67.7% | 1.1%(+66.6)#2 | 1.9%(+65.8)#10 |
| 11. | Manton | 63.6% | 2.9%(+60.7)#2 | 1.9%(+61.7)#11 |
| 12. | Henrietta | 62.5% | 1.7%(+60.8)#1 | 1.9%(+60.6)#12 |
| 13. | Willow Creek | 62.5% | 1.7%(+60.8)#2 | 1.9%(+60.6)#13 |
| 14. | Glendale | 57.1% | 2.7%(+54.5)#1 | 1.9%(+55.2)#14 |
| 15. | Myers Flat | 56.0% | 2.9%(+53.0)#3 | 1.9%(+54.1)#15 |
| 16. | Kilbourne | 55.6% | 1.4%(+54.1)#1 | 1.9%(+53.7)#16 |
| 17. | Newbury | 54.5% | 1.7%(+52.9)#1 | 1.9%(+52.6)#17 |
| 18. | Belfry | 53.3% | 1.4%(+52.0)#1 | 1.9%(+51.4)#18 |
| 19. | Lewis | 51.3% | 1.2%(+50.1)#1 | 1.9%(+49.4)#19 |
| 20. | Kansas | 50.7% | 1.4%(+49.3)#2 | 1.9%(+48.8)#20 |
| 21. | Sundance | 50.0% | 1.8%(+48.2)#1 | 1.9%(+48.1)#21 |
| 22. | Hillside Colony | 49.2% | 1.6%(+47.6)#1 | 1.9%(+47.3)#22 |
| 23. | Mayhill | 47.8% | 1.4%(+46.4)#2 | 1.9%(+45.9)#23 |
| 24. | Alpine | 47.1% | 1.7%(+45.4)#2 | 1.9%(+45.2)#24 |
| 25. | Abington | 46.9% | 1.2%(+45.6)#2 | 1.9%(+45.0)#25 |
| 26. | Mount Hebron | 45.7% | 2.9%(+42.7)#4 | 1.9%(+43.8)#26 |
| 27. | Bivins | 45.5% | 1.6%(+43.9)#1 | 1.9%(+43.6)#27 |
| 28. | Morris Chapel | 45.3% | 1.6%(+43.7)#1 | 1.9%(+43.4)#28 |
| 29. | West Dummerston | 44.4% | 1.8%(+42.7)#1 | 1.9%(+42.5)#29 |
| 30. | Keats | 43.9% | 1.7%(+42.2)#2 | 1.9%(+42.0)#30 |
| 31. | Sedalia | 42.1% | 2.7%(+39.4)#2 | 1.9%(+40.2)#31 |
| 32. | Eagle Rock | 41.2% | 1.8%(+39.4)#2 | 1.9%(+39.3)#32 |
| 33. | La Plant | 40.9% | 1.5%(+39.4)#2 | 1.9%(+39.0)#33 |
| 34. | Bonanza Mountain Estates | 40.6% | 2.7%(+37.9)#3 | 1.9%(+38.7)#34 |
| 35. | Russian Mission | 40.0% | 1.7%(+38.3)#3 | 1.9%(+38.1)#35 |
| 36. | St Ann Highlands | 38.6% | 2.7%(+35.9)#4 | 1.9%(+36.7)#36 |
| 37. | Kenny Lake | 37.7% | 1.7%(+36.0)#4 | 1.9%(+35.8)#37 |
| 38. | Melvin Village | 37.5% | 2.0%(+35.5)#1 | 1.9%(+35.6)#38 |
| 39. | Falls Mills | 37.1% | 1.8%(+35.3)#3 | 1.9%(+35.2)#39 |
| 40. | Max | 36.1% | 1.6%(+34.6)#1 | 1.9%(+34.2)#40 |
| 41. | Edgartown | 35.9% | 2.1%(+33.8)#1 | 1.9%(+34.0)#41 |
| 42. | Antioch | 35.7% | 1.4%(+34.3)#3 | 1.9%(+33.8)#42 |
| 43. | Pleasantville | 35.5% | 1.2%(+34.3)#3 | 1.9%(+33.6)#43 |
| 44. | Merritt | 35.3% | 1.7%(+33.6)#1 | 1.9%(+33.4)#44 |
| 45. | Los Héroes | 35.0% | 1.6%(+33.4)#1 | 1.9%(+33.1)#45 |
| 46. | South Mount Vernon | 34.7% | 1.4%(+33.3)#4 | 1.9%(+32.8)#46 |
| 47. | Laurel Heights | 34.6% | 2.6%(+32.0)#1 | 1.9%(+32.7)#47 |
| 48. | Zion | 34.5% | 1.5%(+33.0)#1 | 1.9%(+32.6)#48 |
| 49. | Rossie | 33.3% | 1.4%(+31.9)#1 | 1.9%(+31.4)#49 |
| 50. | Calio | 33.3% | 1.1%(+32.2)#3 | 1.9%(+31.4)#50 |
| 51. | Morrison | 32.7% | 1.4%(+31.2)#2 | 1.9%(+30.8)#51 |
| 52. | Redwood | 31.1% | 2.8%(+28.2)#1 | 1.9%(+29.2)#52 |
| 53. | Whatley | 30.3% | 1.3%(+29.0)#1 | 1.9%(+28.4)#53 |
| 54. | Hundred | 29.5% | 1.5%(+28.0)#1 | 1.9%(+27.6)#54 |
| 55. | Oceanville | 29.4% | 2.6%(+26.9)#2 | 1.9%(+27.5)#55 |
| 56. | Pottersville | 29.4% | 2.6%(+26.8)#3 | 1.9%(+27.5)#56 |
| 57. | Big Horn | 29.2% | 1.5%(+27.6)#1 | 1.9%(+27.3)#57 |
| 58. | Mauckport | 28.6% | 1.2%(+27.3)#4 | 1.9%(+26.7)#58 |
| 59. | Placerville | 28.6% | 1.6%(+27.0)#1 | 1.9%(+26.7)#59 |
| 60. | Clay Springs | 28.4% | 1.7%(+26.7)#3 | 1.9%(+26.5)#60 |
| 61. | Bathgate | 28.0% | 1.1%(+26.9)#4 | 1.9%(+26.1)#61 |
| 62. | Draper | 27.8% | 1.8%(+26.0)#4 | 1.9%(+25.9)#62 |
| 63. | Williams Canyon | 27.8% | 2.9%(+24.9)#5 | 1.9%(+25.9)#63 |
| 64. | Hatfield | 27.8% | 1.4%(+26.3)#1 | 1.9%(+25.9)#64 |
| 65. | Martinez Lake | 27.6% | 1.7%(+25.9)#4 | 1.9%(+25.7)#65 |
| 66. | Jacksonville Cdp Centre County | 27.5% | 1.5%(+26.0)#1 | 1.9%(+25.6)#66 |
| 67. | Yeehaw Junction | 26.9% | 1.6%(+25.3)#1 | 1.9%(+25.0)#67 |
| 68. | Ponderosa | 26.9% | 1.4%(+25.5)#3 | 1.9%(+25.0)#68 |
| 69. | Islandton | 26.7% | 1.5%(+25.2)#2 | 1.9%(+24.8)#69 |
| 70. | Raynham | 26.7% | 1.7%(+25.0)#2 | 1.9%(+24.8)#70 |
| 71. | Arrow Rock | 26.7% | 1.6%(+25.0)#1 | 1.9%(+24.8)#71 |
| 72. | Cantril | 26.2% | 1.4%(+24.7)#3 | 1.9%(+24.3)#72 |
| 73. | Laotto | 25.6% | 1.2%(+24.4)#5 | 1.9%(+23.7)#73 |
| 74. | Rose Farm | 25.0% | 1.4%(+23.6)#5 | 1.9%(+23.1)#74 |
| 75. | Oak Grove | 25.0% | 1.2%(+23.8)#1 | 1.9%(+23.1)#75 |
| 76. | Arrowhead Springs | 25.0% | 1.5%(+23.5)#2 | 1.9%(+23.1)#76 |
| 77. | River Bend | 25.0% | 1.6%(+23.4)#2 | 1.9%(+23.1)#77 |
| 78. | Mount Olivet | 24.5% | 1.4%(+23.1)#2 | 1.9%(+22.6)#78 |
| 79. | Attapulgus | 24.4% | 2.2%(+22.2)#1 | 1.9%(+22.5)#79 |
| 80. | South Wallins | 24.4% | 1.4%(+23.0)#3 | 1.9%(+22.5)#80 |
| 81. | Mccord Bend | 24.1% | 1.6%(+22.5)#3 | 1.9%(+22.2)#81 |
| 82. | Scott Afb | 23.3% | 1.7%(+21.6)#2 | 1.9%(+21.4)#82 |
| 83. | Miller S Cove | 23.3% | 1.6%(+21.7)#2 | 1.9%(+21.4)#83 |
| 84. | Relampago | 23.1% | 1.6%(+21.5)#3 | 1.9%(+21.2)#84 |
| 85. | Cobden | 23.1% | 1.4%(+21.6)#2 | 1.9%(+21.2)#85 |
| 86. | Tow | 22.9% | 1.6%(+21.3)#4 | 1.9%(+21.0)#86 |
| 87. | South Park | 22.8% | 1.5%(+21.3)#3 | 1.9%(+20.9)#87 |
| 88. | Pulaski | 22.5% | 1.7%(+20.8)#3 | 1.9%(+20.6)#88 |
| 89. | Muniz | 22.5% | 1.6%(+20.9)#5 | 1.9%(+20.6)#89 |
| 90. | Madrone | 22.4% | 1.4%(+21.0)#4 | 1.9%(+20.5)#90 |
| 91. | Montrose | 22.0% | 1.5%(+20.5)#2 | 1.9%(+20.1)#91 |
| 92. | Prattsville | 22.0% | 1.2%(+20.8)#2 | 1.9%(+20.1)#92 |
| 93. | Stone City | 21.8% | 1.4%(+20.4)#4 | 1.9%(+19.9)#93 |
| 94. | Camas | 21.4% | 1.6%(+19.9)#2 | 1.9%(+19.5)#94 |
| 95. | Oso | 21.2% | 2.4%(+18.8)#1 | 1.9%(+19.3)#95 |
| 96. | Henderson | 21.2% | 2.8%(+18.4)#2 | 1.9%(+19.3)#96 |
| 97. | Franktown | 21.2% | 2.7%(+18.5)#5 | 1.9%(+19.3)#97 |
| 98. | Richville | 21.1% | 1.4%(+19.6)#3 | 1.9%(+19.2)#98 |
| 99. | Ashland | 21.1% | 1.5%(+19.6)#1 | 1.9%(+19.2)#99 |
| 100. | Running Y Ranch | 20.9% | 1.5%(+19.4)#1 | 1.9%(+19.0)#100 |
Common Questions
What are the Top 10 Cities with the Highest Percentage of Population Employed in Information in the United States?
Top 10 Cities with the Highest Percentage of Population Employed in Information in the United States are:
What city has the Highest Percentage of Population Employed in Information in the United States?
Palo Verde has the Highest Percentage of Population Employed in Information in the United States with 100.0%.
What is the Percentage of Population Employed in Information in the United States?
Percentage of Population Employed in Information in the United States is 1.9%.