Cities with the Highest Percentage of Population Employed in Information in South Dakota
RELATED REPORTS & OPTIONS
Information & Technology
South Dakota
Compare Cities
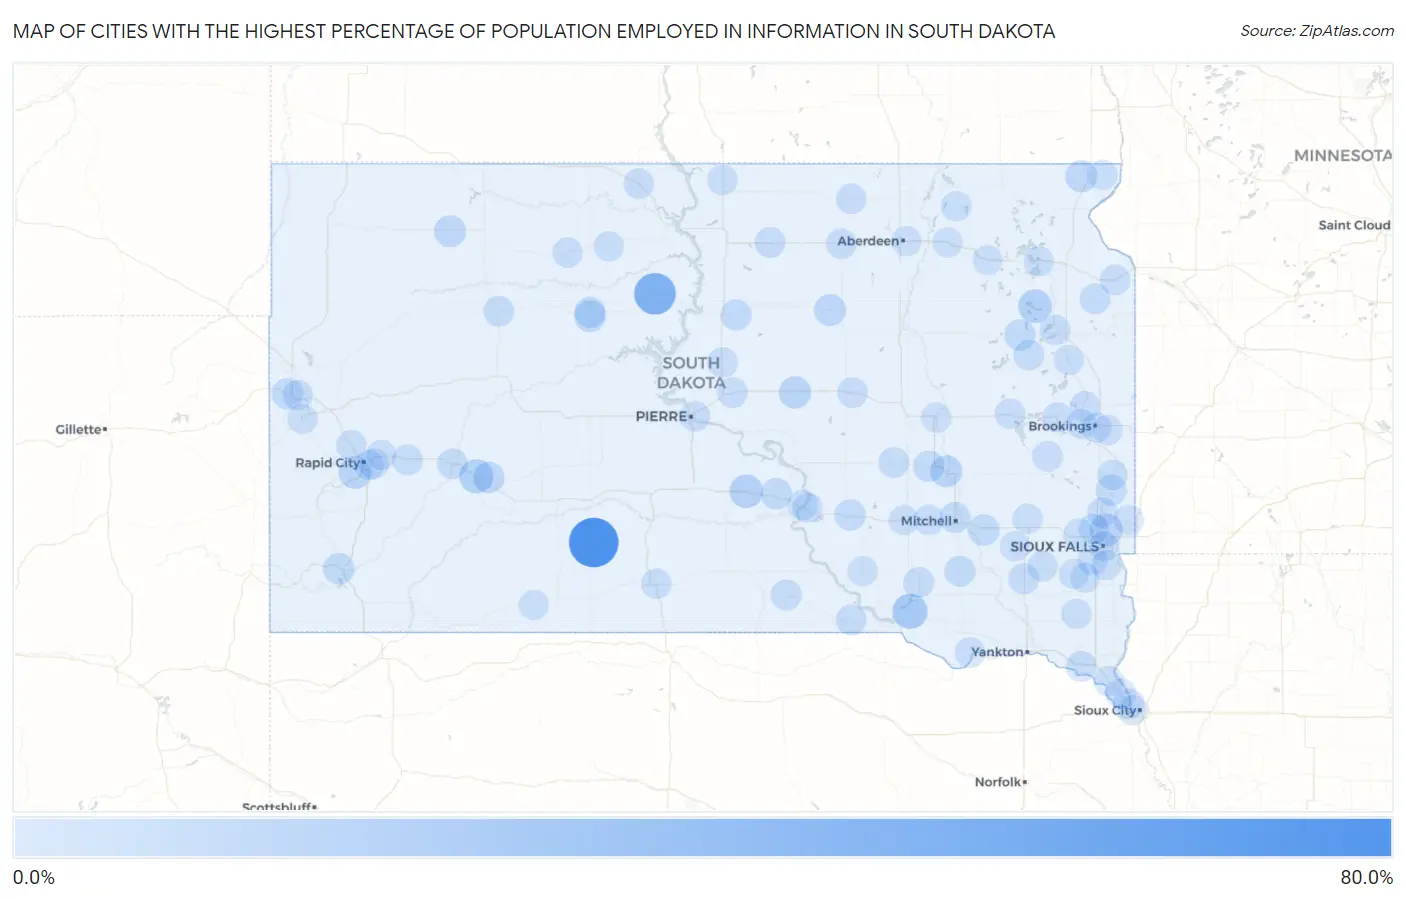
Map of Cities with the Highest Percentage of Population Employed in Information in South Dakota
0.0%
80.0%
Cities with the Highest Percentage of Population Employed in Information in South Dakota
| City | % Employed | vs State | vs National | |
| 1. | Corn Creek | 70.0% | 1.5%(+68.5)#1 | 1.9%(+68.1)#9 |
| 2. | La Plant | 40.9% | 1.5%(+39.4)#2 | 1.9%(+39.0)#33 |
| 3. | Ravinia | 18.2% | 1.5%(+16.7)#3 | 1.9%(+16.3)#131 |
| 4. | Wakpala | 14.3% | 1.5%(+12.8)#4 | 1.9%(+12.4)#211 |
| 5. | Wall | 14.0% | 1.5%(+12.6)#5 | 1.9%(+12.1)#220 |
| 6. | Florence | 12.8% | 1.5%(+11.3)#6 | 1.9%(+10.9)#259 |
| 7. | Kennebec | 12.0% | 1.5%(+10.5)#7 | 1.9%(+10.1)#288 |
| 8. | Renner Corner | 9.7% | 1.5%(+8.22)#8 | 1.9%(+7.81)#421 |
| 9. | Colonial Pine Hills | 9.7% | 1.5%(+8.16)#9 | 1.9%(+7.75)#427 |
| 10. | Highmore | 8.3% | 1.5%(+6.78)#10 | 1.9%(+6.37)#548 |
| 11. | Forestburg | 7.4% | 1.5%(+5.92)#11 | 1.9%(+5.51)#684 |
| 12. | Faulkton | 7.1% | 1.5%(+5.63)#12 | 1.9%(+5.22)#742 |
| 13. | New Effington | 7.1% | 1.5%(+5.57)#13 | 1.9%(+5.16)#754 |
| 14. | Bison | 6.7% | 1.5%(+5.24)#14 | 1.9%(+4.83)#825 |
| 15. | Eagle Butte | 6.5% | 1.5%(+5.02)#15 | 1.9%(+4.61)#879 |
| 16. | Quinn | 6.5% | 1.5%(+4.96)#16 | 1.9%(+4.55)#893 |
| 17. | Alexandria | 6.0% | 1.5%(+4.56)#17 | 1.9%(+4.15)#1,015 |
| 18. | Oahe Acres | 5.4% | 1.5%(+3.95)#18 | 1.9%(+3.54)#1,251 |
| 19. | Hot Springs | 5.4% | 1.5%(+3.90)#19 | 1.9%(+3.49)#1,267 |
| 20. | North Spearfish | 5.3% | 1.5%(+3.77)#20 | 1.9%(+3.36)#1,326 |
| 21. | Henry | 5.2% | 1.5%(+3.72)#21 | 1.9%(+3.31)#1,357 |
| 22. | Reliance | 5.1% | 1.5%(+3.64)#22 | 1.9%(+3.23)#1,398 |
| 23. | Kimball | 4.9% | 1.5%(+3.40)#23 | 1.9%(+2.99)#1,542 |
| 24. | Woonsocket | 4.8% | 1.5%(+3.34)#24 | 1.9%(+2.94)#1,572 |
| 25. | Trent | 4.2% | 1.5%(+2.73)#25 | 1.9%(+2.32)#2,028 |
| 26. | Gettysburg | 4.2% | 1.5%(+2.70)#26 | 1.9%(+2.29)#2,050 |
| 27. | Parkston | 4.1% | 1.5%(+2.66)#27 | 1.9%(+2.25)#2,094 |
| 28. | North Eagle Butte | 4.1% | 1.5%(+2.59)#28 | 1.9%(+2.18)#2,145 |
| 29. | Mitchell | 4.0% | 1.5%(+2.54)#29 | 1.9%(+2.14)#2,192 |
| 30. | Freeman | 3.6% | 1.5%(+2.06)#30 | 1.9%(+1.65)#2,769 |
| 31. | Bonesteel | 3.4% | 1.5%(+1.88)#31 | 1.9%(+1.47)#3,008 |
| 32. | Armour | 3.3% | 1.5%(+1.84)#32 | 1.9%(+1.43)#3,066 |
| 33. | Dallas | 3.3% | 1.5%(+1.79)#33 | 1.9%(+1.38)#3,154 |
| 34. | Faith | 3.2% | 1.5%(+1.74)#34 | 1.9%(+1.33)#3,229 |
| 35. | Hazel | 3.2% | 1.5%(+1.74)#35 | 1.9%(+1.33)#3,234 |
| 36. | Wasta | 3.2% | 1.5%(+1.74)#36 | 1.9%(+1.33)#3,238 |
| 37. | Wessington Springs | 3.2% | 1.5%(+1.71)#37 | 1.9%(+1.31)#3,259 |
| 38. | Vermillion | 3.1% | 1.5%(+1.57)#38 | 1.9%(+1.16)#3,527 |
| 39. | Bowdle | 3.0% | 1.5%(+1.54)#39 | 1.9%(+1.13)#3,600 |
| 40. | Stockholm | 2.9% | 1.5%(+1.37)#40 | 1.9%(+0.959)#3,970 |
| 41. | New Underwood | 2.8% | 1.5%(+1.34)#41 | 1.9%(+0.932)#4,020 |
| 42. | North Sioux City | 2.7% | 1.5%(+1.20)#42 | 1.9%(+0.790)#4,383 |
| 43. | St Lawrence | 2.6% | 1.5%(+1.14)#43 | 1.9%(+0.733)#4,538 |
| 44. | Ipswich | 2.6% | 1.5%(+1.12)#44 | 1.9%(+0.715)#4,578 |
| 45. | Ramona | 2.6% | 1.5%(+1.09)#45 | 1.9%(+0.679)#4,689 |
| 46. | Blunt | 2.6% | 1.5%(+1.07)#46 | 1.9%(+0.666)#4,732 |
| 47. | Milbank | 2.5% | 1.5%(+1.02)#47 | 1.9%(+0.615)#4,866 |
| 48. | Pierre | 2.5% | 1.5%(+0.986)#48 | 1.9%(+0.578)#4,984 |
| 49. | Mclaughlin | 2.4% | 1.5%(+0.949)#49 | 1.9%(+0.541)#5,108 |
| 50. | Bruce | 2.4% | 1.5%(+0.872)#50 | 1.9%(+0.464)#5,335 |
| 51. | Springfield | 2.2% | 1.5%(+0.720)#51 | 1.9%(+0.312)#5,869 |
| 52. | Isabel | 2.2% | 1.5%(+0.684)#52 | 1.9%(+0.276)#6,002 |
| 53. | Herreid | 2.1% | 1.5%(+0.602)#53 | 1.9%(+0.194)#6,298 |
| 54. | Baltic | 2.1% | 1.5%(+0.579)#54 | 1.9%(+0.171)#6,391 |
| 55. | Mount Vernon | 2.1% | 1.5%(+0.564)#55 | 1.9%(+0.156)#6,444 |
| 56. | Rapid Valley | 2.0% | 1.5%(+0.551)#56 | 1.9%(+0.143)#6,483 |
| 57. | Leola | 2.0% | 1.5%(+0.500)#57 | 1.9%(+0.092)#6,704 |
| 58. | Mission | 2.0% | 1.5%(+0.498)#58 | 1.9%(+0.090)#6,709 |
| 59. | Egan | 2.0% | 1.5%(+0.490)#59 | 1.9%(+0.082)#6,739 |
| 60. | Claremont | 2.0% | 1.5%(+0.470)#60 | 1.9%(+0.062)#6,823 |
| 61. | Watertown | 1.9% | 1.5%(+0.431)#61 | 1.9%(+0.023)#6,987 |
| 62. | Arlington | 1.9% | 1.5%(+0.388)#62 | 1.9%(-0.020)#7,177 |
| 63. | Onida | 1.8% | 1.5%(+0.344)#63 | 1.9%(-0.064)#7,346 |
| 64. | Tea | 1.8% | 1.5%(+0.330)#64 | 1.9%(-0.078)#7,408 |
| 65. | Spearfish | 1.8% | 1.5%(+0.323)#65 | 1.9%(-0.085)#7,452 |
| 66. | Hartford | 1.8% | 1.5%(+0.309)#66 | 1.9%(-0.099)#7,519 |
| 67. | Crooks | 1.8% | 1.5%(+0.292)#67 | 1.9%(-0.116)#7,621 |
| 68. | Brookings | 1.8% | 1.5%(+0.289)#68 | 1.9%(-0.119)#7,631 |
| 69. | Sioux Falls | 1.8% | 1.5%(+0.285)#69 | 1.9%(-0.123)#7,650 |
| 70. | De Smet | 1.8% | 1.5%(+0.264)#70 | 1.9%(-0.144)#7,759 |
| 71. | Timber Lake | 1.7% | 1.5%(+0.252)#71 | 1.9%(-0.156)#7,818 |
| 72. | Summerset | 1.7% | 1.5%(+0.243)#72 | 1.9%(-0.165)#7,872 |
| 73. | Volga | 1.7% | 1.5%(+0.235)#73 | 1.9%(-0.173)#7,904 |
| 74. | Marion | 1.7% | 1.5%(+0.234)#74 | 1.9%(-0.174)#7,911 |
| 75. | Jefferson | 1.6% | 1.5%(+0.144)#75 | 1.9%(-0.264)#8,360 |
| 76. | Elk Point | 1.6% | 1.5%(+0.103)#76 | 1.9%(-0.305)#8,555 |
| 77. | Platte | 1.6% | 1.5%(+0.092)#77 | 1.9%(-0.316)#8,609 |
| 78. | Dakota Dunes | 1.6% | 1.5%(+0.089)#78 | 1.9%(-0.319)#8,624 |
| 79. | Huron | 1.6% | 1.5%(+0.076)#79 | 1.9%(-0.332)#8,688 |
| 80. | Aurora | 1.6% | 1.5%(+0.067)#80 | 1.9%(-0.341)#8,747 |
| 81. | Bristol | 1.5% | 1.5%(-0.009)#81 | 1.9%(-0.417)#9,144 |
| 82. | Oacoma | 1.4% | 1.5%(-0.041)#82 | 1.9%(-0.449)#9,332 |
| 83. | Harrisburg | 1.4% | 1.5%(-0.042)#83 | 1.9%(-0.450)#9,343 |
| 84. | Salem | 1.4% | 1.5%(-0.082)#84 | 1.9%(-0.490)#9,558 |
| 85. | Waubay | 1.4% | 1.5%(-0.092)#85 | 1.9%(-0.500)#9,611 |
| 86. | Chancellor | 1.4% | 1.5%(-0.111)#86 | 1.9%(-0.519)#9,734 |
| 87. | Plankinton | 1.4% | 1.5%(-0.113)#87 | 1.9%(-0.521)#9,746 |
| 88. | Centerville | 1.3% | 1.5%(-0.195)#88 | 1.9%(-0.603)#10,208 |
| 89. | Garretson | 1.3% | 1.5%(-0.202)#89 | 1.9%(-0.610)#10,243 |
| 90. | Aberdeen | 1.3% | 1.5%(-0.205)#90 | 1.9%(-0.613)#10,262 |
| 91. | Chamberlain | 1.2% | 1.5%(-0.252)#91 | 1.9%(-0.660)#10,534 |
| 92. | Groton | 1.2% | 1.5%(-0.261)#92 | 1.9%(-0.669)#10,592 |
| 93. | Martin | 1.2% | 1.5%(-0.268)#93 | 1.9%(-0.676)#10,630 |
| 94. | Rosholt | 1.2% | 1.5%(-0.286)#94 | 1.9%(-0.694)#10,740 |
| 95. | Rapid City | 1.2% | 1.5%(-0.322)#95 | 1.9%(-0.730)#10,960 |
| 96. | Lennox | 1.1% | 1.5%(-0.389)#96 | 1.9%(-0.797)#11,385 |
| 97. | Castlewood | 1.1% | 1.5%(-0.395)#97 | 1.9%(-0.803)#11,425 |
| 98. | Lead | 1.1% | 1.5%(-0.410)#98 | 1.9%(-0.818)#11,522 |
| 99. | Bridgewater | 1.1% | 1.5%(-0.415)#99 | 1.9%(-0.823)#11,554 |
| 100. | Box Elder | 1.1% | 1.5%(-0.416)#100 | 1.9%(-0.824)#11,561 |
Common Questions
What are the Top 10 Cities with the Highest Percentage of Population Employed in Information in South Dakota?
Top 10 Cities with the Highest Percentage of Population Employed in Information in South Dakota are:
#1
70.0%
#2
40.9%
#3
18.2%
#4
14.0%
#5
12.8%
#6
12.0%
#7
9.7%
#8
9.7%
#9
8.3%
#10
7.4%
What city has the Highest Percentage of Population Employed in Information in South Dakota?
Corn Creek has the Highest Percentage of Population Employed in Information in South Dakota with 70.0%.
What is the Percentage of Population Employed in Information in the State of South Dakota?
Percentage of Population Employed in Information in South Dakota is 1.5%.
What is the Percentage of Population Employed in Information in the United States?
Percentage of Population Employed in Information in the United States is 1.9%.