Cities with the Highest Percentage of Population Employed in Information in New York
RELATED REPORTS & OPTIONS
Information & Technology
New York
Compare Cities
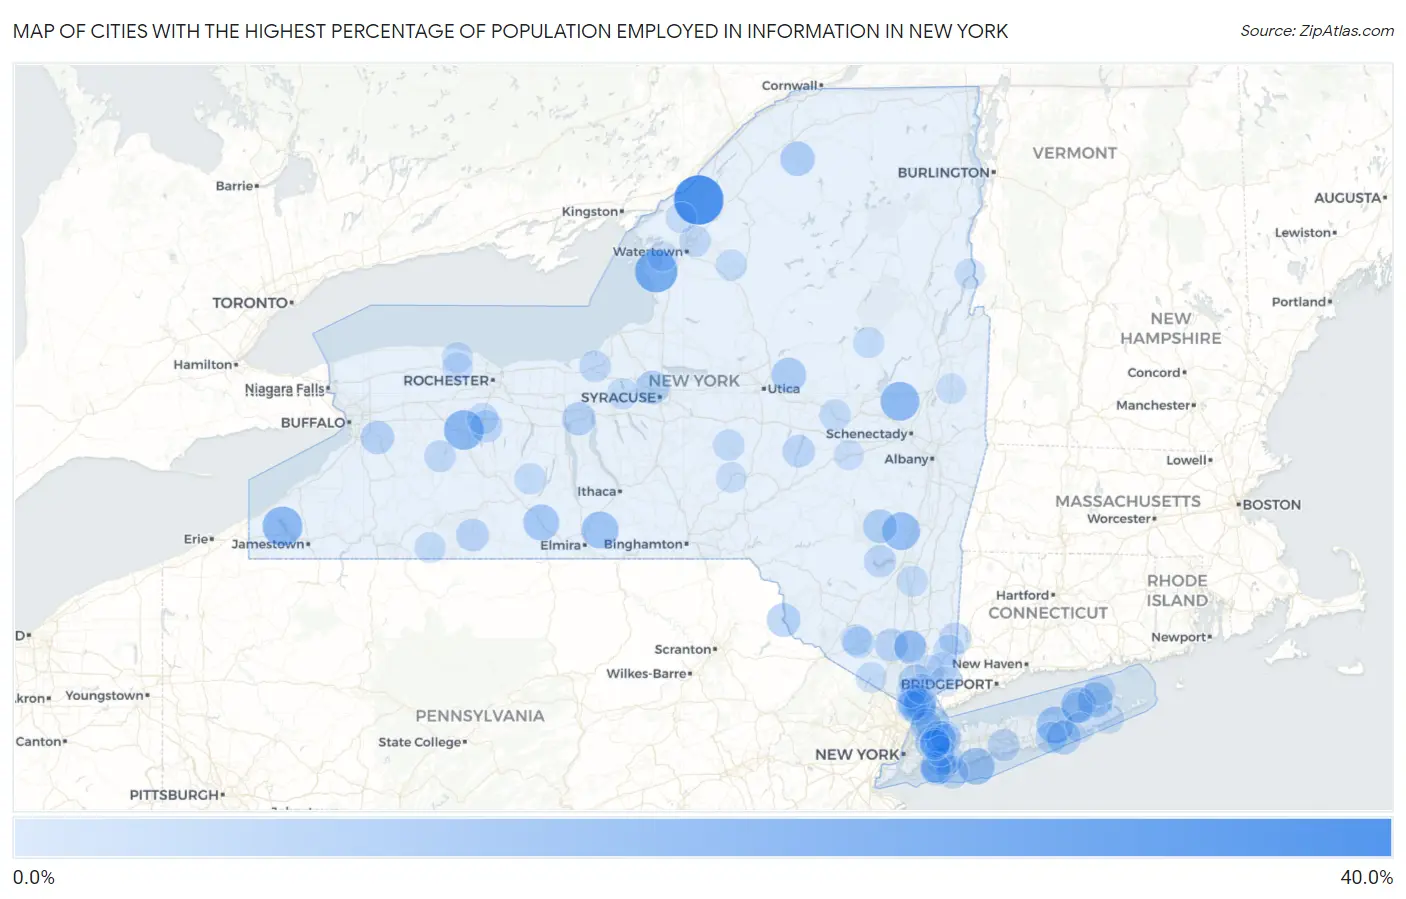
Map of Cities with the Highest Percentage of Population Employed in Information in New York
0.0%
40.0%
Cities with the Highest Percentage of Population Employed in Information in New York
| City | % Employed | vs State | vs National | |
| 1. | Redwood | 31.1% | 2.8%(+28.2)#1 | 1.9%(+29.2)#52 |
| 2. | Henderson | 21.2% | 2.8%(+18.4)#2 | 1.9%(+19.3)#96 |
| 3. | Chautauqua | 17.3% | 2.8%(+14.5)#3 | 1.9%(+15.4)#146 |
| 4. | Retsof | 17.3% | 2.8%(+14.5)#4 | 1.9%(+15.4)#148 |
| 5. | Galway | 16.4% | 2.8%(+13.6)#5 | 1.9%(+14.5)#165 |
| 6. | York | 14.9% | 2.8%(+12.0)#6 | 1.9%(+13.0)#192 |
| 7. | Palenville | 14.6% | 2.8%(+11.8)#7 | 1.9%(+12.7)#202 |
| 8. | Erin | 13.6% | 2.8%(+10.8)#8 | 1.9%(+11.7)#230 |
| 9. | Gilgo | 13.5% | 2.8%(+10.7)#9 | 1.9%(+11.6)#232 |
| 10. | Riverside | 13.5% | 2.8%(+10.6)#10 | 1.9%(+11.6)#236 |
| 11. | New Baltimore | 13.4% | 2.8%(+10.6)#11 | 1.9%(+11.5)#237 |
| 12. | Campbell | 12.3% | 2.8%(+9.45)#12 | 1.9%(+10.4)#284 |
| 13. | Peconic | 11.8% | 2.8%(+8.98)#13 | 1.9%(+9.89)#300 |
| 14. | Hewlett Bay Park | 11.7% | 2.8%(+8.90)#14 | 1.9%(+9.81)#305 |
| 15. | Shelter Island Heights | 11.3% | 2.8%(+8.52)#15 | 1.9%(+9.43)#318 |
| 16. | Newport | 10.7% | 2.8%(+7.94)#16 | 1.9%(+8.85)#343 |
| 17. | Colton | 10.4% | 2.8%(+7.64)#17 | 1.9%(+8.55)#363 |
| 18. | Harbor Hills | 10.3% | 2.8%(+7.45)#18 | 1.9%(+8.36)#369 |
| 19. | Quogue | 9.9% | 2.8%(+7.07)#19 | 1.9%(+7.98)#406 |
| 20. | Hunter | 9.6% | 2.8%(+6.78)#20 | 1.9%(+7.69)#432 |
| 21. | Dobbs Ferry | 9.5% | 2.8%(+6.71)#21 | 1.9%(+7.62)#440 |
| 22. | Liverpool | 9.5% | 2.8%(+6.65)#22 | 1.9%(+7.56)#443 |
| 23. | Narrowsburg | 9.3% | 2.8%(+6.53)#23 | 1.9%(+7.44)#449 |
| 24. | Larchmont | 9.2% | 2.8%(+6.37)#24 | 1.9%(+7.28)#462 |
| 25. | Croton On Hudson | 9.0% | 2.8%(+6.23)#25 | 1.9%(+7.14)#477 |
| 26. | Billington Heights | 9.0% | 2.8%(+6.15)#26 | 1.9%(+7.06)#484 |
| 27. | Waterloo | 8.9% | 2.8%(+6.10)#27 | 1.9%(+7.01)#489 |
| 28. | Otter Lake | 8.9% | 2.8%(+6.08)#28 | 1.9%(+6.99)#492 |
| 29. | East Durham | 8.7% | 2.8%(+5.84)#29 | 1.9%(+6.75)#514 |
| 30. | Rosendale | 8.5% | 2.8%(+5.71)#30 | 1.9%(+6.62)#523 |
| 31. | Salisbury Mills | 8.3% | 2.8%(+5.46)#31 | 1.9%(+6.37)#549 |
| 32. | Cold Spring | 8.1% | 2.8%(+5.32)#32 | 1.9%(+6.23)#564 |
| 33. | Andover | 8.1% | 2.8%(+5.25)#33 | 1.9%(+6.16)#575 |
| 34. | Grand View On Hudson | 8.0% | 2.8%(+5.24)#34 | 1.9%(+6.15)#577 |
| 35. | Tarrytown | 8.0% | 2.8%(+5.15)#35 | 1.9%(+6.06)#588 |
| 36. | Cooperstown | 7.9% | 2.8%(+5.11)#36 | 1.9%(+6.02)#592 |
| 37. | Millwood | 7.8% | 2.8%(+5.02)#37 | 1.9%(+5.93)#602 |
| 38. | Nelsonville | 7.4% | 2.8%(+4.64)#38 | 1.9%(+5.55)#667 |
| 39. | South Lima | 7.4% | 2.8%(+4.63)#39 | 1.9%(+5.54)#669 |
| 40. | Point Lookout | 7.4% | 2.8%(+4.63)#40 | 1.9%(+5.54)#671 |
| 41. | Bohemia | 7.4% | 2.8%(+4.62)#41 | 1.9%(+5.53)#674 |
| 42. | Irvington | 7.4% | 2.8%(+4.60)#42 | 1.9%(+5.51)#677 |
| 43. | Putnam Lake | 7.4% | 2.8%(+4.60)#43 | 1.9%(+5.51)#685 |
| 44. | Shokan | 7.4% | 2.8%(+4.58)#44 | 1.9%(+5.49)#687 |
| 45. | Akwesasne | 7.4% | 2.8%(+4.55)#45 | 1.9%(+5.45)#694 |
| 46. | Baxter Estates | 7.0% | 2.8%(+4.23)#46 | 1.9%(+5.14)#761 |
| 47. | Varna | 7.0% | 2.8%(+4.16)#47 | 1.9%(+5.07)#780 |
| 48. | Remsenburg Speonk | 6.9% | 2.8%(+4.09)#48 | 1.9%(+5.00)#796 |
| 49. | Calcium | 6.8% | 2.8%(+4.03)#49 | 1.9%(+4.94)#807 |
| 50. | Red Creek | 6.7% | 2.8%(+3.91)#50 | 1.9%(+4.82)#826 |
| 51. | South Hempstead | 6.7% | 2.8%(+3.90)#51 | 1.9%(+4.80)#827 |
| 52. | Rochester Institute Of Technology | 6.7% | 2.8%(+3.87)#52 | 1.9%(+4.78)#830 |
| 53. | Silver Springs | 6.7% | 2.8%(+3.86)#53 | 1.9%(+4.77)#835 |
| 54. | East Avon | 6.6% | 2.8%(+3.79)#54 | 1.9%(+4.69)#861 |
| 55. | Earlville | 6.6% | 2.8%(+3.78)#55 | 1.9%(+4.69)#862 |
| 56. | Nelliston | 6.4% | 2.8%(+3.63)#56 | 1.9%(+4.54)#895 |
| 57. | Pelham Manor | 6.3% | 2.8%(+3.54)#57 | 1.9%(+4.45)#917 |
| 58. | Prattsburgh | 6.3% | 2.8%(+3.50)#58 | 1.9%(+4.41)#933 |
| 59. | Mechanicstown | 6.3% | 2.8%(+3.47)#59 | 1.9%(+4.38)#940 |
| 60. | Castorland | 6.2% | 2.8%(+3.37)#60 | 1.9%(+4.27)#970 |
| 61. | Glenwood Landing | 6.1% | 2.8%(+3.32)#61 | 1.9%(+4.22)#984 |
| 62. | Jordan | 6.0% | 2.8%(+3.24)#62 | 1.9%(+4.14)#1,018 |
| 63. | Wells | 6.0% | 2.8%(+3.20)#63 | 1.9%(+4.11)#1,028 |
| 64. | Staatsburg | 6.0% | 2.8%(+3.18)#64 | 1.9%(+4.08)#1,037 |
| 65. | Greenwood Lake | 5.9% | 2.8%(+3.13)#65 | 1.9%(+4.04)#1,054 |
| 66. | Great Neck Gardens | 5.9% | 2.8%(+3.13)#66 | 1.9%(+4.04)#1,055 |
| 67. | Malverne | 5.9% | 2.8%(+3.11)#67 | 1.9%(+4.01)#1,060 |
| 68. | Bolivar | 5.9% | 2.8%(+3.10)#68 | 1.9%(+4.01)#1,062 |
| 69. | Lawrence | 5.9% | 2.8%(+3.06)#69 | 1.9%(+3.97)#1,079 |
| 70. | Piermont | 5.8% | 2.8%(+3.02)#70 | 1.9%(+3.93)#1,087 |
| 71. | Hamlin | 5.8% | 2.8%(+2.98)#71 | 1.9%(+3.88)#1,104 |
| 72. | Washington Heights | 5.8% | 2.8%(+2.96)#72 | 1.9%(+3.87)#1,107 |
| 73. | Port Washington | 5.8% | 2.8%(+2.95)#73 | 1.9%(+3.85)#1,119 |
| 74. | La Fargeville | 5.7% | 2.8%(+2.89)#74 | 1.9%(+3.80)#1,142 |
| 75. | Cutchogue | 5.7% | 2.8%(+2.85)#75 | 1.9%(+3.76)#1,160 |
| 76. | East Hampton | 5.6% | 2.8%(+2.79)#76 | 1.9%(+3.70)#1,188 |
| 77. | Orient | 5.6% | 2.8%(+2.76)#77 | 1.9%(+3.67)#1,201 |
| 78. | Russell Gardens | 5.6% | 2.8%(+2.76)#78 | 1.9%(+3.67)#1,203 |
| 79. | Norwich | 5.5% | 2.8%(+2.72)#79 | 1.9%(+3.63)#1,218 |
| 80. | Ticonderoga | 5.5% | 2.8%(+2.72)#80 | 1.9%(+3.63)#1,219 |
| 81. | Brewster | 5.5% | 2.8%(+2.71)#81 | 1.9%(+3.62)#1,220 |
| 82. | Flower Hill | 5.5% | 2.8%(+2.70)#82 | 1.9%(+3.60)#1,225 |
| 83. | Sparkill | 5.3% | 2.8%(+2.53)#83 | 1.9%(+3.43)#1,298 |
| 84. | Golden S Bridge | 5.3% | 2.8%(+2.48)#84 | 1.9%(+3.39)#1,316 |
| 85. | Cedarhurst | 5.3% | 2.8%(+2.44)#85 | 1.9%(+3.35)#1,341 |
| 86. | Sackets Harbor | 5.2% | 2.8%(+2.36)#86 | 1.9%(+3.27)#1,372 |
| 87. | Cobleskill | 5.1% | 2.8%(+2.33)#87 | 1.9%(+3.24)#1,388 |
| 88. | Valley Cottage | 5.1% | 2.8%(+2.31)#88 | 1.9%(+3.22)#1,403 |
| 89. | Clarkson | 5.1% | 2.8%(+2.29)#89 | 1.9%(+3.20)#1,418 |
| 90. | Yorktown Heights | 5.1% | 2.8%(+2.28)#90 | 1.9%(+3.19)#1,420 |
| 91. | Briarcliff Manor | 5.1% | 2.8%(+2.27)#91 | 1.9%(+3.18)#1,424 |
| 92. | Pelham | 5.0% | 2.8%(+2.21)#92 | 1.9%(+3.12)#1,459 |
| 93. | Schuylerville | 5.0% | 2.8%(+2.19)#93 | 1.9%(+3.10)#1,478 |
| 94. | Roslyn Harbor | 5.0% | 2.8%(+2.16)#94 | 1.9%(+3.07)#1,491 |
| 95. | New Hyde Park | 4.9% | 2.8%(+2.08)#95 | 1.9%(+2.99)#1,537 |
| 96. | Great Neck Plaza | 4.8% | 2.8%(+2.00)#96 | 1.9%(+2.91)#1,592 |
| 97. | Shinnecock Hills | 4.8% | 2.8%(+1.94)#97 | 1.9%(+2.85)#1,621 |
| 98. | Bedford | 4.7% | 2.8%(+1.92)#98 | 1.9%(+2.83)#1,629 |
| 99. | University Gardens | 4.7% | 2.8%(+1.90)#99 | 1.9%(+2.81)#1,640 |
| 100. | Gananda | 4.6% | 2.8%(+1.84)#100 | 1.9%(+2.75)#1,682 |
Common Questions
What are the Top 10 Cities with the Highest Percentage of Population Employed in Information in New York?
Top 10 Cities with the Highest Percentage of Population Employed in Information in New York are:
#1
31.1%
#2
21.2%
#3
17.3%
#4
17.3%
#5
16.4%
#6
14.6%
#7
13.6%
#8
13.5%
#9
13.5%
#10
12.3%
What city has the Highest Percentage of Population Employed in Information in New York?
Redwood has the Highest Percentage of Population Employed in Information in New York with 31.1%.
What is the Percentage of Population Employed in Information in the State of New York?
Percentage of Population Employed in Information in New York is 2.8%.
What is the Percentage of Population Employed in Information in the United States?
Percentage of Population Employed in Information in the United States is 1.9%.