Cities with the Highest Percentage of Population Employed in Information in Pennsylvania
RELATED REPORTS & OPTIONS
Information & Technology
Pennsylvania
Compare Cities
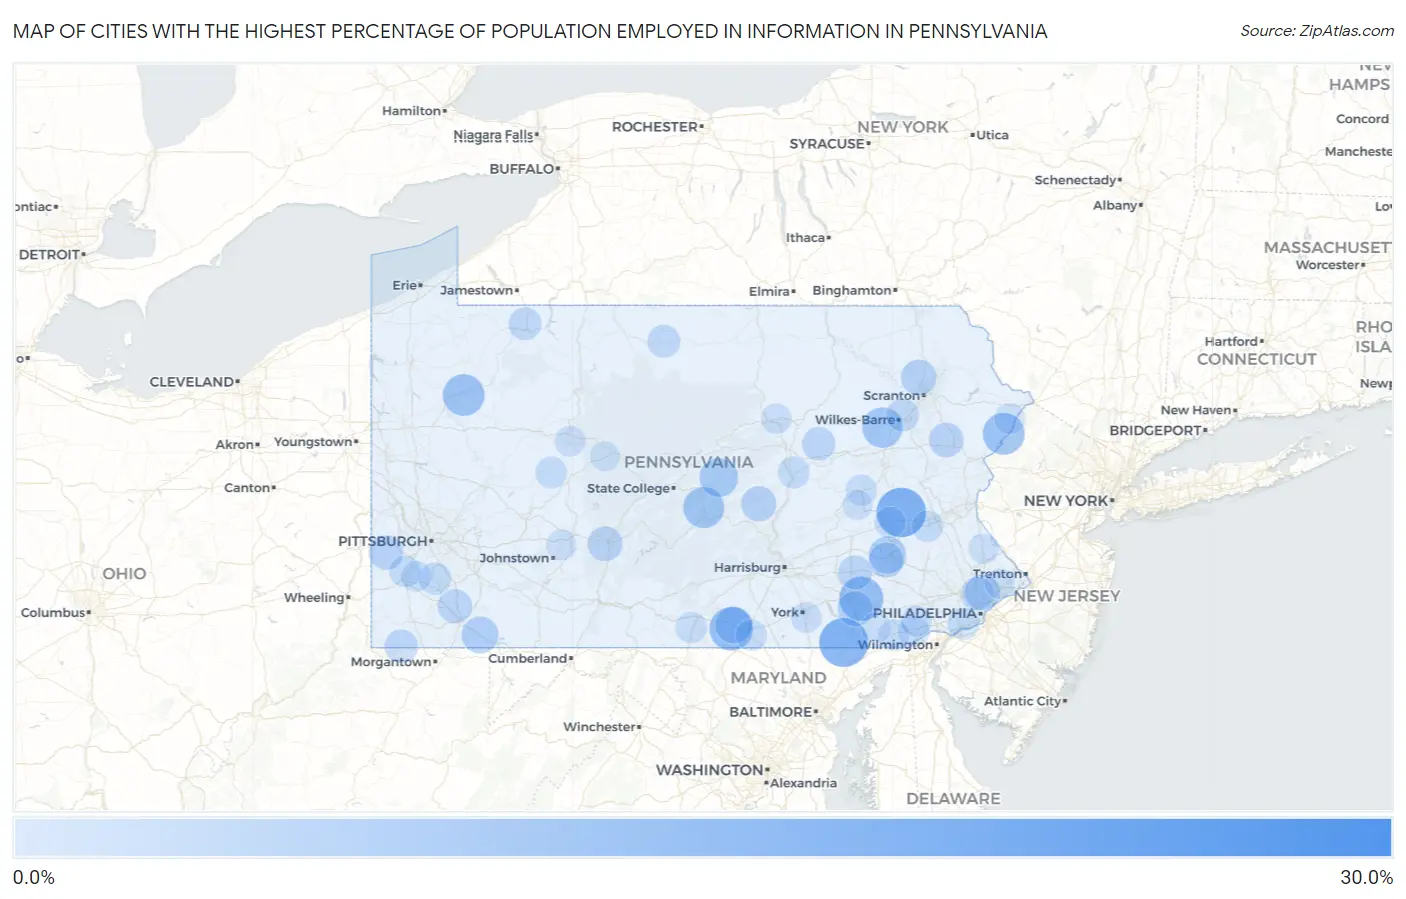
Map of Cities with the Highest Percentage of Population Employed in Information in Pennsylvania
0.0%
30.0%
Cities with the Highest Percentage of Population Employed in Information in Pennsylvania
| City | % Employed | vs State | vs National | |
| 1. | Jacksonville Cdp Centre County | 27.5% | 1.5%(+26.0)#1 | 1.9%(+25.6)#66 |
| 2. | Roseville Borough | 19.7% | 1.5%(+18.1)#2 | 1.9%(+17.8)#116 |
| 3. | Kempton | 17.9% | 1.5%(+16.3)#3 | 1.9%(+16.0)#137 |
| 4. | Susquehanna Trails | 17.5% | 1.5%(+15.9)#4 | 1.9%(+15.6)#144 |
| 5. | Venango Borough | 15.9% | 1.5%(+14.4)#5 | 1.9%(+14.0)#172 |
| 6. | East Altoona | 15.4% | 1.5%(+13.8)#6 | 1.9%(+13.5)#179 |
| 7. | Eagle | 14.5% | 1.5%(+13.0)#7 | 1.9%(+12.6)#203 |
| 8. | Witmer | 14.2% | 1.5%(+12.6)#8 | 1.9%(+12.3)#218 |
| 9. | Orrtanna | 13.6% | 1.5%(+12.1)#9 | 1.9%(+11.7)#227 |
| 10. | Conneautville Borough | 12.9% | 1.5%(+11.3)#10 | 1.9%(+11.0)#253 |
| 11. | Eagleville Cdp Centre County | 12.6% | 1.5%(+11.0)#11 | 1.9%(+10.7)#268 |
| 12. | Pocono Mountain Lake Estates | 12.5% | 1.5%(+10.9)#12 | 1.9%(+10.6)#276 |
| 13. | Woodland Heights | 12.4% | 1.5%(+10.9)#13 | 1.9%(+10.5)#277 |
| 14. | Reedsville | 11.9% | 1.5%(+10.4)#14 | 1.9%(+10.0)#296 |
| 15. | Sheatown | 11.5% | 1.5%(+9.97)#15 | 1.9%(+9.62)#310 |
| 16. | Henrietta | 10.7% | 1.5%(+9.13)#16 | 1.9%(+8.78)#351 |
| 17. | Coburn | 10.3% | 1.5%(+8.71)#17 | 1.9%(+8.36)#371 |
| 18. | Oswayo Borough | 10.0% | 1.5%(+8.45)#18 | 1.9%(+8.10)#396 |
| 19. | Cheswick Borough | 9.5% | 1.5%(+7.99)#19 | 1.9%(+7.64)#434 |
| 20. | Colony Park | 9.3% | 1.5%(+7.78)#20 | 1.9%(+7.43)#450 |
| 21. | Mcknightstown | 9.2% | 1.5%(+7.61)#21 | 1.9%(+7.26)#466 |
| 22. | Eagles Mere Borough | 9.1% | 1.5%(+7.54)#22 | 1.9%(+7.19)#474 |
| 23. | Farmington | 9.0% | 1.5%(+7.45)#23 | 1.9%(+7.10)#479 |
| 24. | Waverly | 8.3% | 1.5%(+6.76)#24 | 1.9%(+6.41)#546 |
| 25. | Wyncote | 8.2% | 1.5%(+6.63)#25 | 1.9%(+6.28)#558 |
| 26. | Willow Street | 7.9% | 1.5%(+6.36)#26 | 1.9%(+6.01)#594 |
| 27. | Lincoln Park | 7.8% | 1.5%(+6.25)#27 | 1.9%(+5.90)#605 |
| 28. | Richfield | 7.8% | 1.5%(+6.23)#28 | 1.9%(+5.88)#608 |
| 29. | Glen Osborne Borough | 7.8% | 1.5%(+6.21)#29 | 1.9%(+5.86)#613 |
| 30. | Delaware Water Gap Borough | 7.7% | 1.5%(+6.17)#30 | 1.9%(+5.82)#616 |
| 31. | Foot Of Ten | 7.7% | 1.5%(+6.12)#31 | 1.9%(+5.76)#627 |
| 32. | Bendersville Borough | 7.6% | 1.5%(+6.01)#32 | 1.9%(+5.66)#646 |
| 33. | Pocono Pines | 7.5% | 1.5%(+6.00)#33 | 1.9%(+5.65)#650 |
| 34. | Slovan | 7.4% | 1.5%(+5.86)#34 | 1.9%(+5.51)#678 |
| 35. | Newburg | 7.3% | 1.5%(+5.77)#35 | 1.9%(+5.42)#698 |
| 36. | Georgetown Cdp Luzerne County | 7.3% | 1.5%(+5.76)#36 | 1.9%(+5.41)#700 |
| 37. | York Haven Borough | 7.3% | 1.5%(+5.76)#37 | 1.9%(+5.41)#701 |
| 38. | Irvona Borough | 7.3% | 1.5%(+5.73)#38 | 1.9%(+5.38)#702 |
| 39. | Smock | 7.2% | 1.5%(+5.70)#39 | 1.9%(+5.35)#707 |
| 40. | Hopeland | 7.1% | 1.5%(+5.51)#40 | 1.9%(+5.16)#753 |
| 41. | Cross Keys | 7.0% | 1.5%(+5.42)#41 | 1.9%(+5.07)#779 |
| 42. | Doylestown Borough | 6.9% | 1.5%(+5.40)#42 | 1.9%(+5.05)#783 |
| 43. | Jacobus Borough | 6.9% | 1.5%(+5.38)#43 | 1.9%(+5.03)#790 |
| 44. | Jerseytown | 6.8% | 1.5%(+5.21)#44 | 1.9%(+4.86)#823 |
| 45. | Brave | 6.7% | 1.5%(+5.12)#45 | 1.9%(+4.77)#838 |
| 46. | Wyndmoor | 6.6% | 1.5%(+5.02)#46 | 1.9%(+4.66)#871 |
| 47. | North Warren | 6.4% | 1.5%(+4.88)#47 | 1.9%(+4.53)#896 |
| 48. | Mcdonald Borough | 6.4% | 1.5%(+4.87)#48 | 1.9%(+4.52)#901 |
| 49. | Plains | 6.3% | 1.5%(+4.71)#49 | 1.9%(+4.35)#945 |
| 50. | Sweden Valley | 6.2% | 1.5%(+4.70)#50 | 1.9%(+4.35)#949 |
| 51. | Frankfort Springs Borough | 6.1% | 1.5%(+4.51)#51 | 1.9%(+4.16)#1,008 |
| 52. | Harmony Borough | 6.0% | 1.5%(+4.50)#52 | 1.9%(+4.15)#1,017 |
| 53. | Baidland | 6.0% | 1.5%(+4.45)#53 | 1.9%(+4.10)#1,029 |
| 54. | Shanksville Borough | 5.8% | 1.5%(+4.27)#54 | 1.9%(+3.92)#1,095 |
| 55. | Girard Borough | 5.7% | 1.5%(+4.19)#55 | 1.9%(+3.84)#1,125 |
| 56. | Collingdale Borough | 5.7% | 1.5%(+4.16)#56 | 1.9%(+3.81)#1,136 |
| 57. | Sharon Hill Borough | 5.7% | 1.5%(+4.14)#57 | 1.9%(+3.79)#1,145 |
| 58. | Myerstown Borough | 5.7% | 1.5%(+4.13)#58 | 1.9%(+3.78)#1,147 |
| 59. | Mount Gretna Borough | 5.6% | 1.5%(+4.09)#59 | 1.9%(+3.74)#1,172 |
| 60. | Prospect Park | 5.6% | 1.5%(+4.08)#60 | 1.9%(+3.73)#1,179 |
| 61. | Kapp Heights | 5.6% | 1.5%(+4.07)#61 | 1.9%(+3.72)#1,183 |
| 62. | Rossiter | 5.6% | 1.5%(+4.02)#62 | 1.9%(+3.67)#1,199 |
| 63. | Ulysses Borough | 5.5% | 1.5%(+3.96)#63 | 1.9%(+3.61)#1,223 |
| 64. | Mcgovern | 5.5% | 1.5%(+3.93)#64 | 1.9%(+3.58)#1,236 |
| 65. | Breinigsville | 5.5% | 1.5%(+3.90)#65 | 1.9%(+3.55)#1,247 |
| 66. | Marion | 5.4% | 1.5%(+3.86)#66 | 1.9%(+3.51)#1,262 |
| 67. | Callery Borough | 5.3% | 1.5%(+3.79)#67 | 1.9%(+3.44)#1,296 |
| 68. | Edenburg | 5.3% | 1.5%(+3.79)#68 | 1.9%(+3.43)#1,299 |
| 69. | Camp Hill Borough | 5.3% | 1.5%(+3.77)#69 | 1.9%(+3.42)#1,304 |
| 70. | Toughkenamon | 5.2% | 1.5%(+3.69)#70 | 1.9%(+3.34)#1,346 |
| 71. | Altamont | 5.2% | 1.5%(+3.64)#71 | 1.9%(+3.29)#1,364 |
| 72. | Lincoln University | 5.2% | 1.5%(+3.62)#72 | 1.9%(+3.27)#1,375 |
| 73. | Lake Heritage | 5.1% | 1.5%(+3.60)#73 | 1.9%(+3.25)#1,382 |
| 74. | Carmichaels Borough | 5.1% | 1.5%(+3.55)#74 | 1.9%(+3.20)#1,413 |
| 75. | Unionville | 5.1% | 1.5%(+3.53)#75 | 1.9%(+3.18)#1,426 |
| 76. | Green Lane Borough | 5.1% | 1.5%(+3.50)#76 | 1.9%(+3.15)#1,440 |
| 77. | Newry Borough | 5.1% | 1.5%(+3.50)#77 | 1.9%(+3.15)#1,441 |
| 78. | Paint Borough | 5.0% | 1.5%(+3.48)#78 | 1.9%(+3.13)#1,456 |
| 79. | Birchwood Lakes | 5.0% | 1.5%(+3.45)#79 | 1.9%(+3.10)#1,464 |
| 80. | Tyler Run | 5.0% | 1.5%(+3.44)#80 | 1.9%(+3.09)#1,479 |
| 81. | Sandy | 5.0% | 1.5%(+3.40)#81 | 1.9%(+3.05)#1,504 |
| 82. | Wernersville Borough | 4.9% | 1.5%(+3.37)#82 | 1.9%(+3.02)#1,527 |
| 83. | Carnegie Borough | 4.9% | 1.5%(+3.34)#83 | 1.9%(+2.99)#1,541 |
| 84. | Homewood Borough | 4.9% | 1.5%(+3.33)#84 | 1.9%(+2.98)#1,549 |
| 85. | Kenmar | 4.8% | 1.5%(+3.28)#85 | 1.9%(+2.93)#1,574 |
| 86. | Wylandville | 4.8% | 1.5%(+3.26)#86 | 1.9%(+2.91)#1,586 |
| 87. | Harrisville Borough | 4.8% | 1.5%(+3.25)#87 | 1.9%(+2.90)#1,593 |
| 88. | Vinco | 4.8% | 1.5%(+3.22)#88 | 1.9%(+2.87)#1,606 |
| 89. | Prospect Park Borough | 4.8% | 1.5%(+3.20)#89 | 1.9%(+2.85)#1,619 |
| 90. | Benson Borough | 4.7% | 1.5%(+3.14)#90 | 1.9%(+2.79)#1,651 |
| 91. | Broad Top City Borough | 4.7% | 1.5%(+3.11)#91 | 1.9%(+2.76)#1,667 |
| 92. | Ben Avon Heights Borough | 4.7% | 1.5%(+3.10)#92 | 1.9%(+2.75)#1,677 |
| 93. | Kirkwood | 4.6% | 1.5%(+3.07)#93 | 1.9%(+2.72)#1,710 |
| 94. | Plumsteadville | 4.6% | 1.5%(+3.02)#94 | 1.9%(+2.67)#1,738 |
| 95. | Merion Station | 4.5% | 1.5%(+3.00)#95 | 1.9%(+2.65)#1,744 |
| 96. | Thornburg Borough | 4.5% | 1.5%(+2.98)#96 | 1.9%(+2.63)#1,766 |
| 97. | Feasterville | 4.5% | 1.5%(+2.97)#97 | 1.9%(+2.62)#1,770 |
| 98. | Nesquehoning Borough | 4.5% | 1.5%(+2.94)#98 | 1.9%(+2.59)#1,789 |
| 99. | Hyde | 4.5% | 1.5%(+2.93)#99 | 1.9%(+2.58)#1,795 |
| 100. | Marlin | 4.5% | 1.5%(+2.92)#100 | 1.9%(+2.57)#1,803 |
Common Questions
What are the Top 10 Cities with the Highest Percentage of Population Employed in Information in Pennsylvania?
Top 10 Cities with the Highest Percentage of Population Employed in Information in Pennsylvania are:
#1
17.9%
#2
17.5%
#3
14.2%
#4
13.6%
#5
12.5%
#6
12.4%
#7
11.9%
#8
11.5%
#9
10.3%
#10
9.3%
What city has the Highest Percentage of Population Employed in Information in Pennsylvania?
Kempton has the Highest Percentage of Population Employed in Information in Pennsylvania with 17.9%.
What is the Percentage of Population Employed in Information in the State of Pennsylvania?
Percentage of Population Employed in Information in Pennsylvania is 1.5%.
What is the Percentage of Population Employed in Information in the United States?
Percentage of Population Employed in Information in the United States is 1.9%.