Cities with the Highest Percentage of Population Employed in Information in Ohio
RELATED REPORTS & OPTIONS
Information & Technology
Ohio
Compare Cities
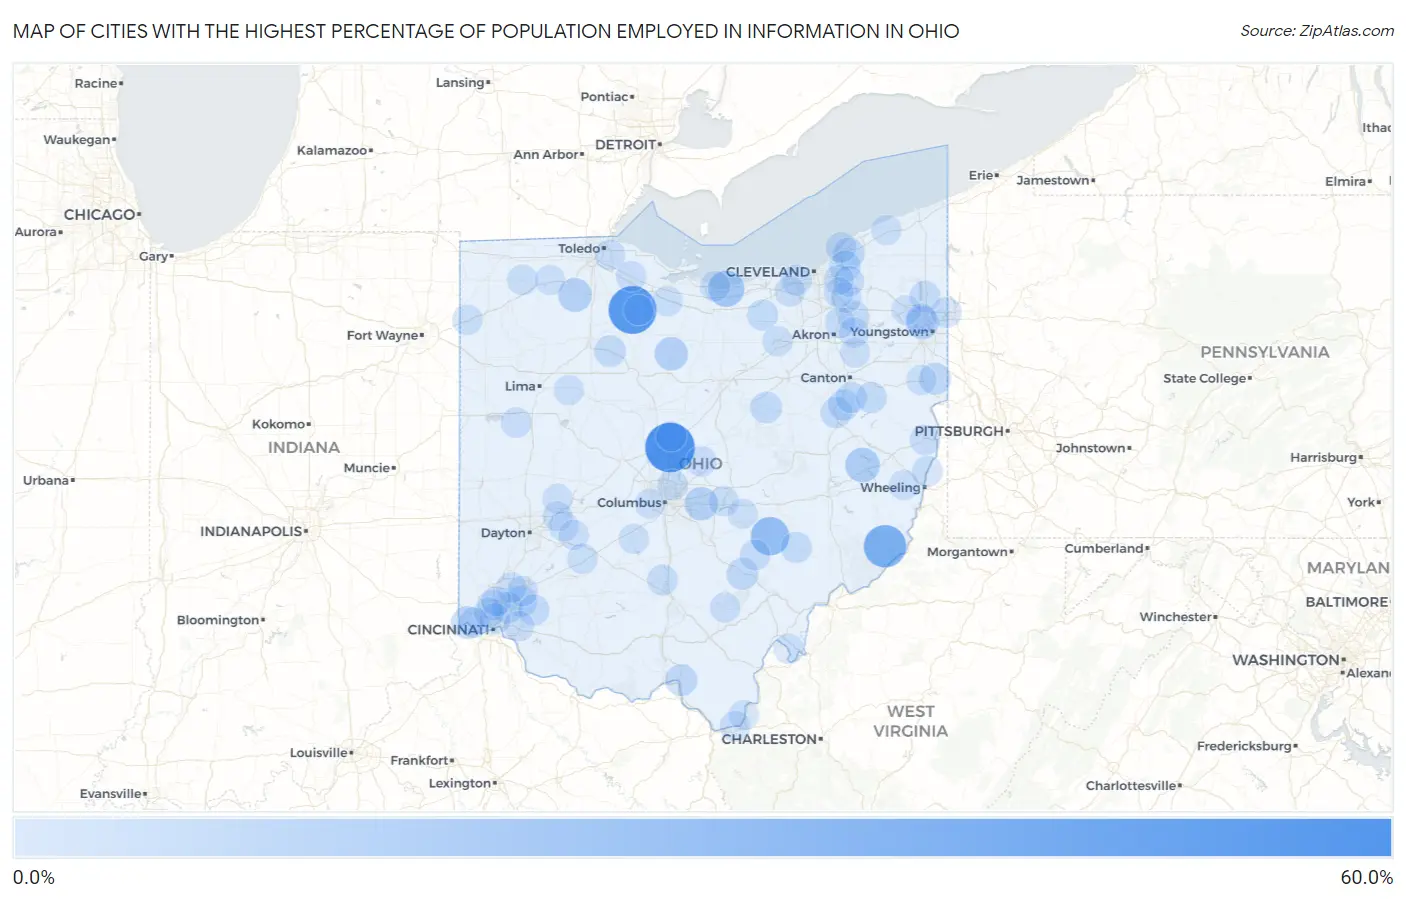
Map of Cities with the Highest Percentage of Population Employed in Information in Ohio
0.0%
60.0%
Cities with the Highest Percentage of Population Employed in Information in Ohio
| City | % Employed | vs State | vs National | |
| 1. | Kilbourne | 55.6% | 1.4%(+54.1)#1 | 1.9%(+53.7)#16 |
| 2. | Kansas | 50.7% | 1.4%(+49.3)#2 | 1.9%(+48.8)#20 |
| 3. | Antioch | 35.7% | 1.4%(+34.3)#3 | 1.9%(+33.8)#42 |
| 4. | South Mount Vernon | 34.7% | 1.4%(+33.3)#4 | 1.9%(+32.8)#46 |
| 5. | Rose Farm | 25.0% | 1.4%(+23.6)#5 | 1.9%(+23.1)#74 |
| 6. | Mitiwanga | 18.9% | 1.4%(+17.5)#6 | 1.9%(+17.0)#122 |
| 7. | Brandt | 16.7% | 1.4%(+15.2)#7 | 1.9%(+14.8)#159 |
| 8. | Freeport | 14.7% | 1.4%(+13.3)#8 | 1.9%(+12.8)#198 |
| 9. | Miller | 13.1% | 1.4%(+11.6)#9 | 1.9%(+11.2)#248 |
| 10. | Weston | 12.0% | 1.4%(+10.5)#10 | 1.9%(+10.1)#292 |
| 11. | Chatfield | 11.5% | 1.4%(+10.0)#11 | 1.9%(+9.58)#313 |
| 12. | Etna | 11.5% | 1.4%(+10.0)#12 | 1.9%(+9.57)#314 |
| 13. | Hilltop | 10.8% | 1.4%(+9.35)#13 | 1.9%(+8.88)#342 |
| 14. | Jersey | 10.5% | 1.4%(+9.09)#14 | 1.9%(+8.63)#359 |
| 15. | Lawrenceville | 10.2% | 1.4%(+8.78)#15 | 1.9%(+8.31)#374 |
| 16. | Reno Beach | 10.1% | 1.4%(+8.71)#16 | 1.9%(+8.24)#382 |
| 17. | North Bend | 9.5% | 1.4%(+8.10)#17 | 1.9%(+7.64)#435 |
| 18. | Woodsdale | 8.1% | 1.4%(+6.68)#18 | 1.9%(+6.21)#568 |
| 19. | Sciotodale | 7.7% | 1.4%(+6.28)#19 | 1.9%(+5.82)#615 |
| 20. | Guilford Lake | 7.7% | 1.4%(+6.28)#20 | 1.9%(+5.81)#617 |
| 21. | Rogers | 7.6% | 1.4%(+6.19)#21 | 1.9%(+5.72)#634 |
| 22. | Waite Hill | 7.5% | 1.4%(+6.07)#22 | 1.9%(+5.60)#657 |
| 23. | Haydenville | 7.5% | 1.4%(+6.05)#23 | 1.9%(+5.58)#664 |
| 24. | Vanlue | 7.0% | 1.4%(+5.57)#24 | 1.9%(+5.10)#773 |
| 25. | Nashville | 7.0% | 1.4%(+5.57)#25 | 1.9%(+5.10)#774 |
| 26. | Madison Place | 7.0% | 1.4%(+5.53)#26 | 1.9%(+5.07)#781 |
| 27. | Roachester | 6.6% | 1.4%(+5.21)#27 | 1.9%(+4.74)#850 |
| 28. | Gates Mills | 6.4% | 1.4%(+4.99)#28 | 1.9%(+4.52)#898 |
| 29. | Parral | 6.1% | 1.4%(+4.63)#29 | 1.9%(+4.16)#1,007 |
| 30. | Mcconnelsville | 6.1% | 1.4%(+4.62)#30 | 1.9%(+4.15)#1,013 |
| 31. | Loveland Park | 6.0% | 1.4%(+4.58)#31 | 1.9%(+4.11)#1,027 |
| 32. | Zoar | 5.9% | 1.4%(+4.51)#32 | 1.9%(+4.04)#1,052 |
| 33. | East Sparta | 5.9% | 1.4%(+4.49)#33 | 1.9%(+4.02)#1,059 |
| 34. | Blue Ash | 5.9% | 1.4%(+4.42)#34 | 1.9%(+3.95)#1,080 |
| 35. | Sugar Bush Knolls | 5.7% | 1.4%(+4.23)#35 | 1.9%(+3.76)#1,158 |
| 36. | Pheasant Run | 5.5% | 1.4%(+4.05)#36 | 1.9%(+3.58)#1,232 |
| 37. | Lake Mohawk | 5.4% | 1.4%(+3.95)#37 | 1.9%(+3.49)#1,271 |
| 38. | Goshen | 5.4% | 1.4%(+3.95)#38 | 1.9%(+3.48)#1,272 |
| 39. | Minerva Park | 5.3% | 1.4%(+3.85)#39 | 1.9%(+3.38)#1,320 |
| 40. | Tiltonsville | 5.1% | 1.4%(+3.64)#40 | 1.9%(+3.17)#1,431 |
| 41. | Cortland | 5.0% | 1.4%(+3.55)#41 | 1.9%(+3.08)#1,484 |
| 42. | Andersonville | 5.0% | 1.4%(+3.54)#42 | 1.9%(+3.07)#1,490 |
| 43. | St Bernard | 4.8% | 1.4%(+3.41)#43 | 1.9%(+2.95)#1,566 |
| 44. | Proctorville | 4.7% | 1.4%(+3.31)#44 | 1.9%(+2.84)#1,625 |
| 45. | Reminderville | 4.7% | 1.4%(+3.25)#45 | 1.9%(+2.78)#1,654 |
| 46. | Fairview Park | 4.6% | 1.4%(+3.20)#46 | 1.9%(+2.73)#1,696 |
| 47. | Maria Stein | 4.6% | 1.4%(+3.13)#47 | 1.9%(+2.67)#1,739 |
| 48. | Lakeline | 4.5% | 1.4%(+3.11)#48 | 1.9%(+2.65)#1,751 |
| 49. | Chagrin Falls | 4.5% | 1.4%(+3.07)#49 | 1.9%(+2.60)#1,778 |
| 50. | West Hill | 4.5% | 1.4%(+3.06)#50 | 1.9%(+2.60)#1,784 |
| 51. | Shawnee | 4.4% | 1.4%(+3.00)#51 | 1.9%(+2.53)#1,843 |
| 52. | North Lima | 4.4% | 1.4%(+2.99)#52 | 1.9%(+2.52)#1,851 |
| 53. | Northwood | 4.4% | 1.4%(+2.97)#53 | 1.9%(+2.50)#1,863 |
| 54. | Ridgeville Corners | 4.4% | 1.4%(+2.95)#54 | 1.9%(+2.49)#1,874 |
| 55. | Ridgewood | 4.4% | 1.4%(+2.94)#55 | 1.9%(+2.47)#1,886 |
| 56. | Kings Mills | 4.3% | 1.4%(+2.85)#56 | 1.9%(+2.38)#1,966 |
| 57. | Silver Lake | 4.2% | 1.4%(+2.80)#57 | 1.9%(+2.33)#2,005 |
| 58. | Elmore | 4.2% | 1.4%(+2.77)#58 | 1.9%(+2.31)#2,036 |
| 59. | Mack | 4.2% | 1.4%(+2.73)#59 | 1.9%(+2.27)#2,077 |
| 60. | Greenhills | 4.2% | 1.4%(+2.73)#60 | 1.9%(+2.27)#2,079 |
| 61. | Saybrook-On-The-Lake | 4.1% | 1.4%(+2.67)#61 | 1.9%(+2.21)#2,121 |
| 62. | New Knoxville | 4.1% | 1.4%(+2.66)#62 | 1.9%(+2.20)#2,131 |
| 63. | Mcarthur | 4.1% | 1.4%(+2.63)#63 | 1.9%(+2.17)#2,160 |
| 64. | Olmsted Falls | 4.0% | 1.4%(+2.54)#64 | 1.9%(+2.08)#2,250 |
| 65. | Hartford Croton | 3.9% | 1.4%(+2.48)#65 | 1.9%(+2.01)#2,324 |
| 66. | Four Bridges | 3.8% | 1.4%(+2.38)#66 | 1.9%(+1.91)#2,436 |
| 67. | Brimfield | 3.8% | 1.4%(+2.38)#67 | 1.9%(+1.91)#2,437 |
| 68. | Antwerp | 3.8% | 1.4%(+2.36)#68 | 1.9%(+1.89)#2,465 |
| 69. | Summerside | 3.8% | 1.4%(+2.35)#69 | 1.9%(+1.89)#2,474 |
| 70. | Wintersville | 3.7% | 1.4%(+2.32)#70 | 1.9%(+1.85)#2,514 |
| 71. | Niles | 3.7% | 1.4%(+2.31)#71 | 1.9%(+1.84)#2,533 |
| 72. | Hebron | 3.7% | 1.4%(+2.28)#72 | 1.9%(+1.81)#2,566 |
| 73. | Bowersville | 3.7% | 1.4%(+2.27)#73 | 1.9%(+1.81)#2,578 |
| 74. | Huron | 3.7% | 1.4%(+2.26)#74 | 1.9%(+1.79)#2,606 |
| 75. | Clyde | 3.7% | 1.4%(+2.24)#75 | 1.9%(+1.77)#2,628 |
| 76. | Lodi | 3.6% | 1.4%(+2.17)#76 | 1.9%(+1.70)#2,708 |
| 77. | Lisbon | 3.5% | 1.4%(+2.11)#77 | 1.9%(+1.65)#2,777 |
| 78. | North College Hill | 3.5% | 1.4%(+2.07)#78 | 1.9%(+1.60)#2,838 |
| 79. | Yellow Springs | 3.5% | 1.4%(+2.03)#79 | 1.9%(+1.57)#2,878 |
| 80. | North Hampton | 3.5% | 1.4%(+2.03)#80 | 1.9%(+1.57)#2,881 |
| 81. | Alger | 3.5% | 1.4%(+2.03)#81 | 1.9%(+1.56)#2,889 |
| 82. | St Clairsville | 3.4% | 1.4%(+2.00)#82 | 1.9%(+1.54)#2,913 |
| 83. | Racine | 3.4% | 1.4%(+2.00)#83 | 1.9%(+1.53)#2,920 |
| 84. | Orange | 3.4% | 1.4%(+1.96)#84 | 1.9%(+1.49)#2,973 |
| 85. | Ashley | 3.4% | 1.4%(+1.94)#85 | 1.9%(+1.48)#3,002 |
| 86. | Lincoln Village | 3.4% | 1.4%(+1.94)#86 | 1.9%(+1.47)#3,014 |
| 87. | Hartville | 3.3% | 1.4%(+1.88)#87 | 1.9%(+1.41)#3,105 |
| 88. | Athalia | 3.3% | 1.4%(+1.87)#88 | 1.9%(+1.41)#3,111 |
| 89. | Glenwillow | 3.3% | 1.4%(+1.83)#89 | 1.9%(+1.37)#3,167 |
| 90. | Bettsville | 3.2% | 1.4%(+1.78)#90 | 1.9%(+1.32)#3,244 |
| 91. | Green Meadows | 3.2% | 1.4%(+1.77)#91 | 1.9%(+1.30)#3,269 |
| 92. | Madison | 3.2% | 1.4%(+1.75)#92 | 1.9%(+1.28)#3,304 |
| 93. | Mount Sterling | 3.2% | 1.4%(+1.75)#93 | 1.9%(+1.28)#3,312 |
| 94. | Liberty Center | 3.2% | 1.4%(+1.74)#94 | 1.9%(+1.28)#3,318 |
| 95. | Springdale | 3.2% | 1.4%(+1.74)#95 | 1.9%(+1.27)#3,336 |
| 96. | Cedarville | 3.2% | 1.4%(+1.73)#96 | 1.9%(+1.26)#3,359 |
| 97. | Hamburg | 3.2% | 1.4%(+1.72)#97 | 1.9%(+1.25)#3,372 |
| 98. | Leavittsburg | 3.1% | 1.4%(+1.70)#98 | 1.9%(+1.23)#3,412 |
| 99. | Glenford | 3.1% | 1.4%(+1.69)#99 | 1.9%(+1.23)#3,425 |
| 100. | Sharon Center | 3.1% | 1.4%(+1.68)#100 | 1.9%(+1.21)#3,451 |
Common Questions
What are the Top 10 Cities with the Highest Percentage of Population Employed in Information in Ohio?
Top 10 Cities with the Highest Percentage of Population Employed in Information in Ohio are:
What city has the Highest Percentage of Population Employed in Information in Ohio?
Kilbourne has the Highest Percentage of Population Employed in Information in Ohio with 55.6%.
What is the Percentage of Population Employed in Information in the State of Ohio?
Percentage of Population Employed in Information in Ohio is 1.4%.
What is the Percentage of Population Employed in Information in the United States?
Percentage of Population Employed in Information in the United States is 1.9%.