Cities with the Highest Percentage of Population Employed in Information in Oklahoma
RELATED REPORTS & OPTIONS
Information & Technology
Oklahoma
Compare Cities
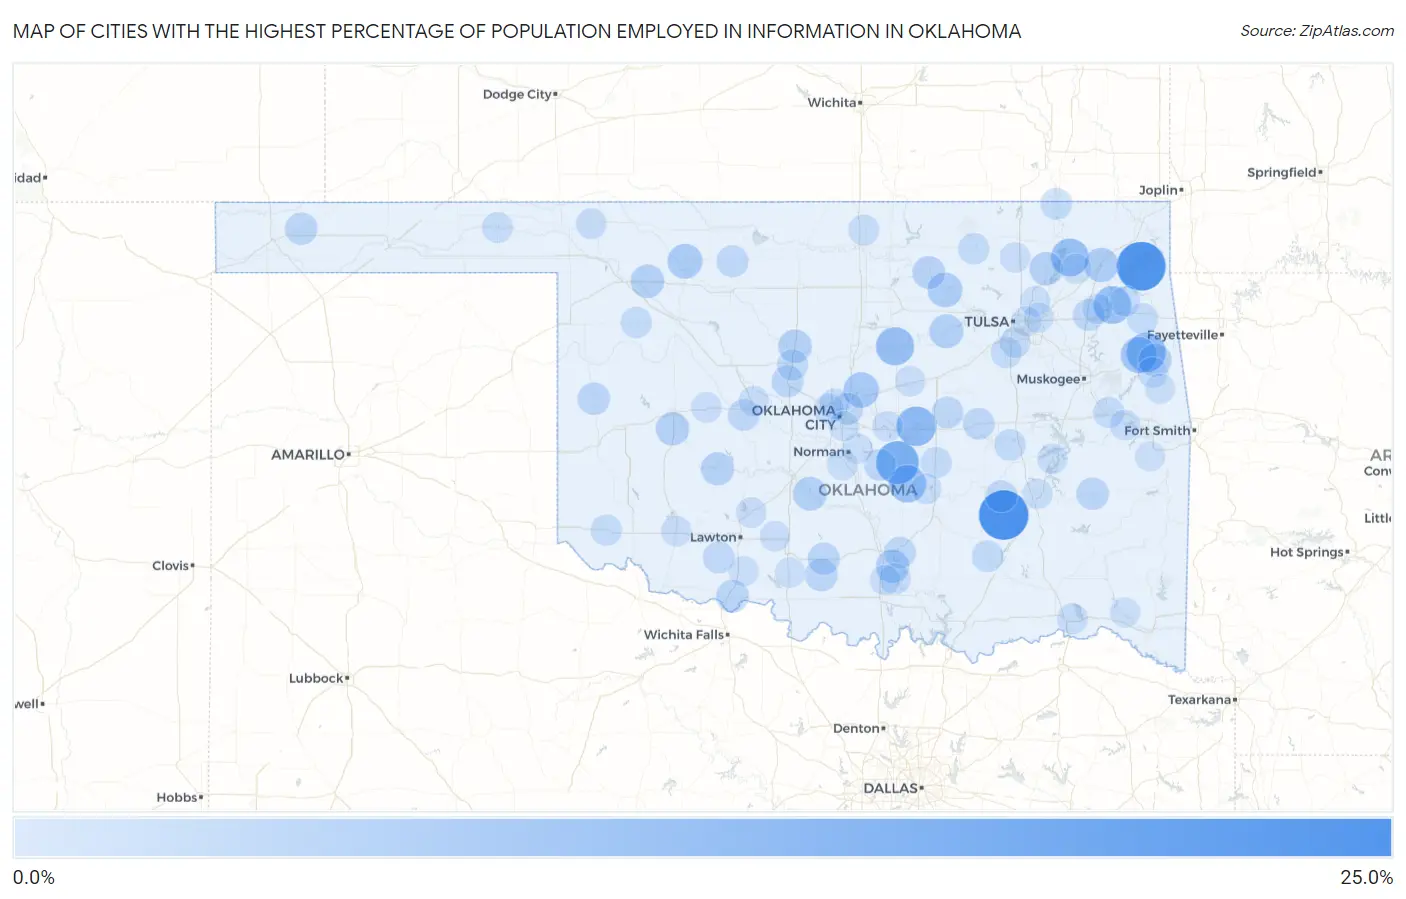
Map of Cities with the Highest Percentage of Population Employed in Information in Oklahoma
0.0%
25.0%
Cities with the Highest Percentage of Population Employed in Information in Oklahoma
| City | % Employed | vs State | vs National | |
| 1. | Ashland | 21.1% | 1.5%(+19.6)#1 | 1.9%(+19.2)#99 |
| 2. | Dennis | 20.3% | 1.5%(+18.8)#2 | 1.9%(+18.4)#103 |
| 3. | Caney Ridge | 15.4% | 1.5%(+13.9)#3 | 1.9%(+13.5)#181 |
| 4. | Macomb | 14.3% | 1.5%(+12.8)#4 | 1.9%(+12.4)#215 |
| 5. | Sparrowhawk | 11.9% | 1.5%(+10.4)#5 | 1.9%(+9.97)#297 |
| 6. | Johnson | 11.1% | 1.5%(+9.65)#6 | 1.9%(+9.21)#322 |
| 7. | Eldon | 10.9% | 1.5%(+9.41)#7 | 1.9%(+8.97)#337 |
| 8. | Perkins | 9.7% | 1.5%(+8.27)#8 | 1.9%(+7.83)#419 |
| 9. | New Alluwe | 9.5% | 1.5%(+8.06)#9 | 1.9%(+7.63)#438 |
| 10. | Pump Back | 9.3% | 1.5%(+7.84)#10 | 1.9%(+7.40)#452 |
| 11. | Asher | 9.2% | 1.5%(+7.70)#11 | 1.9%(+7.27)#465 |
| 12. | Hanson | 9.0% | 1.5%(+7.51)#12 | 1.9%(+7.08)#482 |
| 13. | Briggs | 7.8% | 1.5%(+6.37)#13 | 1.9%(+5.94)#598 |
| 14. | Enterprise | 7.1% | 1.5%(+5.68)#14 | 1.9%(+5.24)#734 |
| 15. | Arcadia | 7.1% | 1.5%(+5.68)#15 | 1.9%(+5.24)#736 |
| 16. | Waynoka | 6.7% | 1.5%(+5.20)#16 | 1.9%(+4.77)#834 |
| 17. | Blackburn | 6.5% | 1.5%(+4.99)#17 | 1.9%(+4.55)#892 |
| 18. | Welty | 6.4% | 1.5%(+4.92)#18 | 1.9%(+4.48)#905 |
| 19. | Big Cabin | 6.2% | 1.5%(+4.71)#19 | 1.9%(+4.27)#971 |
| 20. | Oilton | 5.8% | 1.5%(+4.34)#20 | 1.9%(+3.91)#1,098 |
| 21. | Alex | 5.7% | 1.5%(+4.19)#21 | 1.9%(+3.75)#1,163 |
| 22. | Dover | 5.3% | 1.5%(+3.88)#22 | 1.9%(+3.45)#1,294 |
| 23. | Mooreland | 5.3% | 1.5%(+3.81)#23 | 1.9%(+3.38)#1,323 |
| 24. | Bessie | 5.3% | 1.5%(+3.80)#24 | 1.9%(+3.36)#1,330 |
| 25. | Dougherty | 5.3% | 1.5%(+3.80)#25 | 1.9%(+3.36)#1,333 |
| 26. | Talala | 5.2% | 1.5%(+3.76)#26 | 1.9%(+3.33)#1,350 |
| 27. | Carnegie | 5.2% | 1.5%(+3.70)#27 | 1.9%(+3.27)#1,374 |
| 28. | Titanic | 5.0% | 1.5%(+3.54)#28 | 1.9%(+3.10)#1,469 |
| 29. | Ralston | 4.6% | 1.5%(+3.12)#29 | 1.9%(+2.68)#1,732 |
| 30. | Loco | 4.5% | 1.5%(+3.08)#30 | 1.9%(+2.65)#1,757 |
| 31. | Randlett | 4.5% | 1.5%(+3.01)#31 | 1.9%(+2.57)#1,806 |
| 32. | Keyes | 4.3% | 1.5%(+2.82)#32 | 1.9%(+2.39)#1,959 |
| 33. | Cheyenne | 4.3% | 1.5%(+2.81)#33 | 1.9%(+2.38)#1,968 |
| 34. | Adams | 4.3% | 1.5%(+2.79)#34 | 1.9%(+2.36)#1,983 |
| 35. | Wilburton | 4.2% | 1.5%(+2.78)#35 | 1.9%(+2.34)#2,000 |
| 36. | Norwood | 4.2% | 1.5%(+2.70)#36 | 1.9%(+2.26)#2,086 |
| 37. | Velma | 4.1% | 1.5%(+2.63)#37 | 1.9%(+2.20)#2,126 |
| 38. | Okarche | 3.9% | 1.5%(+2.48)#38 | 1.9%(+2.05)#2,278 |
| 39. | Chouteau | 3.9% | 1.5%(+2.48)#39 | 1.9%(+2.04)#2,289 |
| 40. | Carmen | 3.9% | 1.5%(+2.41)#40 | 1.9%(+1.98)#2,377 |
| 41. | Rocky Point | 3.9% | 1.5%(+2.40)#41 | 1.9%(+1.96)#2,391 |
| 42. | Stuart | 3.8% | 1.5%(+2.38)#42 | 1.9%(+1.95)#2,407 |
| 43. | Okemah | 3.8% | 1.5%(+2.32)#43 | 1.9%(+1.89)#2,468 |
| 44. | Hinton | 3.8% | 1.5%(+2.31)#44 | 1.9%(+1.87)#2,496 |
| 45. | Etowah | 3.7% | 1.5%(+2.24)#45 | 1.9%(+1.81)#2,584 |
| 46. | Faxon | 3.7% | 1.5%(+2.24)#46 | 1.9%(+1.81)#2,589 |
| 47. | Lake Aluma | 3.7% | 1.5%(+2.24)#47 | 1.9%(+1.81)#2,591 |
| 48. | Paden | 3.7% | 1.5%(+2.19)#48 | 1.9%(+1.76)#2,639 |
| 49. | Sulphur | 3.6% | 1.5%(+2.17)#49 | 1.9%(+1.74)#2,676 |
| 50. | South Coffeyville | 3.5% | 1.5%(+2.02)#50 | 1.9%(+1.58)#2,856 |
| 51. | Dustin | 3.4% | 1.5%(+1.93)#51 | 1.9%(+1.49)#2,975 |
| 52. | Lehigh | 3.4% | 1.5%(+1.91)#52 | 1.9%(+1.47)#3,009 |
| 53. | Vici | 3.3% | 1.5%(+1.82)#53 | 1.9%(+1.39)#3,147 |
| 54. | Pawhuska | 3.3% | 1.5%(+1.79)#54 | 1.9%(+1.36)#3,180 |
| 55. | Webbers Falls | 3.2% | 1.5%(+1.76)#55 | 1.9%(+1.33)#3,224 |
| 56. | Bowlegs | 3.2% | 1.5%(+1.76)#56 | 1.9%(+1.33)#3,226 |
| 57. | Gene Autry | 3.2% | 1.5%(+1.76)#57 | 1.9%(+1.33)#3,233 |
| 58. | Tonkawa Tribal Housing | 3.2% | 1.5%(+1.73)#58 | 1.9%(+1.29)#3,283 |
| 59. | Kingfisher | 3.2% | 1.5%(+1.72)#59 | 1.9%(+1.29)#3,291 |
| 60. | Cedar Lake | 3.2% | 1.5%(+1.72)#60 | 1.9%(+1.29)#3,294 |
| 61. | East Duke | 3.0% | 1.5%(+1.57)#61 | 1.9%(+1.13)#3,601 |
| 62. | Oaks | 3.0% | 1.5%(+1.57)#62 | 1.9%(+1.13)#3,603 |
| 63. | Kiefer | 3.0% | 1.5%(+1.55)#63 | 1.9%(+1.12)#3,637 |
| 64. | Beaver | 2.9% | 1.5%(+1.42)#64 | 1.9%(+0.983)#3,905 |
| 65. | Blackwell | 2.9% | 1.5%(+1.41)#65 | 1.9%(+0.971)#3,935 |
| 66. | Buffalo | 2.9% | 1.5%(+1.39)#66 | 1.9%(+0.953)#3,978 |
| 67. | Hugo | 2.7% | 1.5%(+1.27)#67 | 1.9%(+0.840)#4,252 |
| 68. | Jenks | 2.7% | 1.5%(+1.23)#68 | 1.9%(+0.792)#4,377 |
| 69. | Goldsby | 2.7% | 1.5%(+1.20)#69 | 1.9%(+0.762)#4,455 |
| 70. | Snyder | 2.7% | 1.5%(+1.19)#70 | 1.9%(+0.760)#4,461 |
| 71. | Elgin | 2.7% | 1.5%(+1.19)#71 | 1.9%(+0.759)#4,465 |
| 72. | Chandler | 2.6% | 1.5%(+1.18)#72 | 1.9%(+0.749)#4,492 |
| 73. | Mcloud | 2.6% | 1.5%(+1.15)#73 | 1.9%(+0.716)#4,572 |
| 74. | Kenwood | 2.6% | 1.5%(+1.12)#74 | 1.9%(+0.688)#4,647 |
| 75. | Rocky Mountain | 2.6% | 1.5%(+1.12)#75 | 1.9%(+0.688)#4,651 |
| 76. | Central High | 2.5% | 1.5%(+1.05)#76 | 1.9%(+0.614)#4,868 |
| 77. | Geary | 2.5% | 1.5%(+1.04)#77 | 1.9%(+0.602)#4,911 |
| 78. | Tamaha | 2.5% | 1.5%(+1.04)#78 | 1.9%(+0.602)#4,917 |
| 79. | Konawa | 2.5% | 1.5%(+1.02)#79 | 1.9%(+0.588)#4,953 |
| 80. | The Village | 2.5% | 1.5%(+1.02)#80 | 1.9%(+0.587)#4,956 |
| 81. | Weatherford | 2.5% | 1.5%(+1.02)#81 | 1.9%(+0.584)#4,963 |
| 82. | Canadian | 2.5% | 1.5%(+1.01)#82 | 1.9%(+0.571)#5,020 |
| 83. | Moodys | 2.5% | 1.5%(+0.991)#83 | 1.9%(+0.557)#5,061 |
| 84. | Sportsmen Acres | 2.5% | 1.5%(+0.987)#84 | 1.9%(+0.553)#5,071 |
| 85. | Springer | 2.4% | 1.5%(+0.975)#85 | 1.9%(+0.541)#5,107 |
| 86. | Ochelata | 2.4% | 1.5%(+0.950)#86 | 1.9%(+0.515)#5,171 |
| 87. | Warr Acres | 2.4% | 1.5%(+0.929)#87 | 1.9%(+0.495)#5,234 |
| 88. | Mcalester | 2.4% | 1.5%(+0.914)#88 | 1.9%(+0.479)#5,299 |
| 89. | Owasso | 2.4% | 1.5%(+0.904)#89 | 1.9%(+0.470)#5,316 |
| 90. | Walters | 2.4% | 1.5%(+0.897)#90 | 1.9%(+0.463)#5,338 |
| 91. | Greasy | 2.3% | 1.5%(+0.862)#91 | 1.9%(+0.427)#5,472 |
| 92. | Norman | 2.3% | 1.5%(+0.859)#92 | 1.9%(+0.425)#5,482 |
| 93. | Valley Brook | 2.3% | 1.5%(+0.842)#93 | 1.9%(+0.407)#5,540 |
| 94. | Chelsea | 2.3% | 1.5%(+0.820)#94 | 1.9%(+0.386)#5,610 |
| 95. | Wright City | 2.3% | 1.5%(+0.819)#95 | 1.9%(+0.385)#5,614 |
| 96. | Tulsa | 2.3% | 1.5%(+0.787)#96 | 1.9%(+0.353)#5,727 |
| 97. | Comanche | 2.2% | 1.5%(+0.783)#97 | 1.9%(+0.349)#5,737 |
| 98. | White Eagle | 2.2% | 1.5%(+0.758)#98 | 1.9%(+0.324)#5,832 |
| 99. | Bokoshe | 2.2% | 1.5%(+0.758)#99 | 1.9%(+0.324)#5,833 |
| 100. | Catoosa | 2.2% | 1.5%(+0.755)#100 | 1.9%(+0.321)#5,849 |
Common Questions
What are the Top 10 Cities with the Highest Percentage of Population Employed in Information in Oklahoma?
Top 10 Cities with the Highest Percentage of Population Employed in Information in Oklahoma are:
What city has the Highest Percentage of Population Employed in Information in Oklahoma?
Ashland has the Highest Percentage of Population Employed in Information in Oklahoma with 21.1%.
What is the Percentage of Population Employed in Information in the State of Oklahoma?
Percentage of Population Employed in Information in Oklahoma is 1.5%.
What is the Percentage of Population Employed in Information in the United States?
Percentage of Population Employed in Information in the United States is 1.9%.