Cities with the Highest Percentage of Population Employed in Information in Massachusetts
RELATED REPORTS & OPTIONS
Information & Technology
Massachusetts
Compare Cities
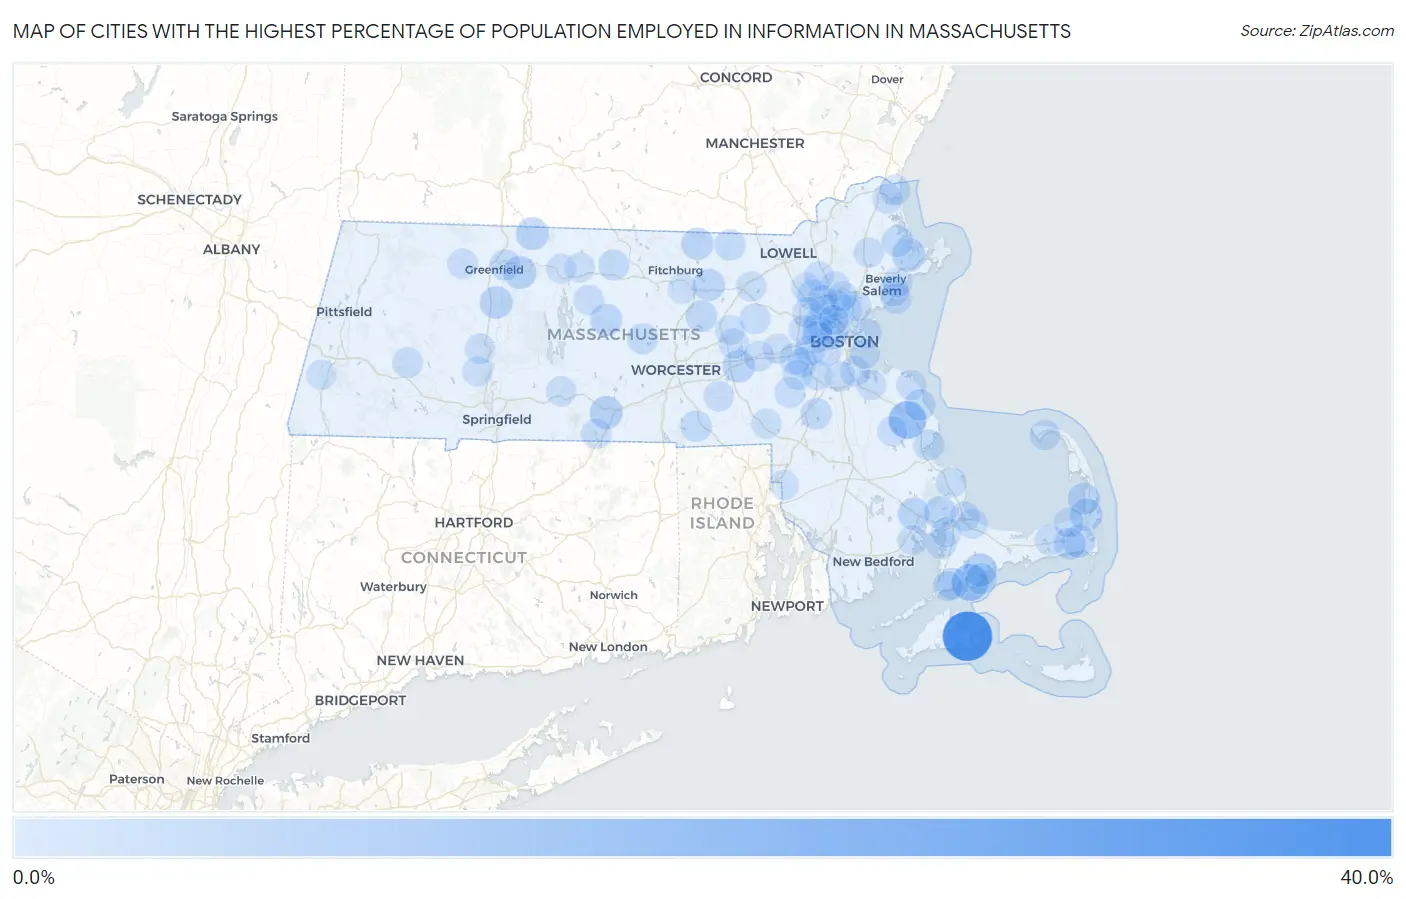
Map of Cities with the Highest Percentage of Population Employed in Information in Massachusetts
0.0%
40.0%
Cities with the Highest Percentage of Population Employed in Information in Massachusetts
| City | % Employed | vs State | vs National | |
| 1. | Edgartown | 35.9% | 2.1%(+33.8)#1 | 1.9%(+34.0)#41 |
| 2. | North Pembroke | 15.2% | 2.1%(+13.1)#2 | 1.9%(+13.3)#186 |
| 3. | Seconsett Island | 13.3% | 2.1%(+11.2)#3 | 1.9%(+11.4)#238 |
| 4. | Essex | 8.0% | 2.1%(+5.88)#4 | 1.9%(+6.08)#586 |
| 5. | Mashpee Neck | 7.8% | 2.1%(+5.73)#5 | 1.9%(+5.93)#599 |
| 6. | Fiskdale | 7.1% | 2.1%(+5.03)#6 | 1.9%(+5.23)#740 |
| 7. | Millers Falls | 6.9% | 2.1%(+4.80)#7 | 1.9%(+5.00)#795 |
| 8. | Northfield | 6.8% | 2.1%(+4.73)#8 | 1.9%(+4.93)#809 |
| 9. | South Deerfield | 6.4% | 2.1%(+4.26)#9 | 1.9%(+4.46)#914 |
| 10. | East Harwich | 6.3% | 2.1%(+4.16)#10 | 1.9%(+4.37)#942 |
| 11. | Cordaville | 6.3% | 2.1%(+4.16)#11 | 1.9%(+4.37)#943 |
| 12. | Orleans | 6.1% | 2.1%(+4.03)#12 | 1.9%(+4.23)#983 |
| 13. | White Island Shores | 6.0% | 2.1%(+3.89)#13 | 1.9%(+4.09)#1,036 |
| 14. | West Wareham | 5.8% | 2.1%(+3.73)#14 | 1.9%(+3.93)#1,086 |
| 15. | Shirley | 5.8% | 2.1%(+3.65)#15 | 1.9%(+3.85)#1,120 |
| 16. | Townsend | 5.6% | 2.1%(+3.51)#16 | 1.9%(+3.71)#1,184 |
| 17. | North Eastham | 5.5% | 2.1%(+3.36)#17 | 1.9%(+3.56)#1,243 |
| 18. | Barre | 5.4% | 2.1%(+3.26)#18 | 1.9%(+3.46)#1,284 |
| 19. | South Lancaster | 5.2% | 2.1%(+3.07)#19 | 1.9%(+3.27)#1,368 |
| 20. | Harwich Center | 4.9% | 2.1%(+2.83)#20 | 1.9%(+3.03)#1,517 |
| 21. | Teaticket | 4.9% | 2.1%(+2.78)#21 | 1.9%(+2.98)#1,544 |
| 22. | Popponesset | 4.5% | 2.1%(+2.38)#22 | 1.9%(+2.59)#1,791 |
| 23. | Sharon | 4.3% | 2.1%(+2.25)#23 | 1.9%(+2.45)#1,912 |
| 24. | Marshfield Hills | 4.3% | 2.1%(+2.16)#24 | 1.9%(+2.36)#1,972 |
| 25. | Ipswich | 4.2% | 2.1%(+2.08)#25 | 1.9%(+2.28)#2,054 |
| 26. | Wellesley | 4.2% | 2.1%(+2.06)#26 | 1.9%(+2.26)#2,089 |
| 27. | East Douglas | 4.1% | 2.1%(+2.01)#27 | 1.9%(+2.22)#2,116 |
| 28. | Somerville | 4.0% | 2.1%(+1.86)#28 | 1.9%(+2.06)#2,269 |
| 29. | Turners Falls | 3.9% | 2.1%(+1.82)#29 | 1.9%(+2.03)#2,309 |
| 30. | Arlington | 3.9% | 2.1%(+1.79)#30 | 1.9%(+1.99)#2,354 |
| 31. | Burlington | 3.9% | 2.1%(+1.78)#31 | 1.9%(+1.98)#2,368 |
| 32. | East Pepperell | 3.8% | 2.1%(+1.71)#32 | 1.9%(+1.91)#2,440 |
| 33. | Winthrop Town | 3.8% | 2.1%(+1.70)#33 | 1.9%(+1.90)#2,447 |
| 34. | Melrose | 3.8% | 2.1%(+1.66)#34 | 1.9%(+1.86)#2,506 |
| 35. | Rutland | 3.7% | 2.1%(+1.60)#35 | 1.9%(+1.81)#2,570 |
| 36. | Winchester | 3.6% | 2.1%(+1.53)#36 | 1.9%(+1.74)#2,674 |
| 37. | South Duxbury | 3.5% | 2.1%(+1.44)#37 | 1.9%(+1.65)#2,778 |
| 38. | Baldwinville | 3.5% | 2.1%(+1.43)#38 | 1.9%(+1.64)#2,788 |
| 39. | South Dennis | 3.5% | 2.1%(+1.40)#39 | 1.9%(+1.60)#2,833 |
| 40. | Medfield | 3.5% | 2.1%(+1.35)#40 | 1.9%(+1.56)#2,898 |
| 41. | Salisbury | 3.4% | 2.1%(+1.27)#41 | 1.9%(+1.48)#2,997 |
| 42. | Cambridge | 3.4% | 2.1%(+1.25)#42 | 1.9%(+1.45)#3,033 |
| 43. | The Pinehills | 3.3% | 2.1%(+1.20)#43 | 1.9%(+1.40)#3,123 |
| 44. | Marblehead | 3.3% | 2.1%(+1.17)#44 | 1.9%(+1.37)#3,159 |
| 45. | Maynard | 3.2% | 2.1%(+1.13)#45 | 1.9%(+1.34)#3,209 |
| 46. | Pocasset | 3.2% | 2.1%(+1.06)#46 | 1.9%(+1.26)#3,366 |
| 47. | Belmont | 3.1% | 2.1%(+1.00)#47 | 1.9%(+1.20)#3,464 |
| 48. | Chester | 3.1% | 2.1%(+0.971)#48 | 1.9%(+1.17)#3,517 |
| 49. | Provincetown | 3.1% | 2.1%(+0.952)#49 | 1.9%(+1.16)#3,543 |
| 50. | Lexington | 3.1% | 2.1%(+0.951)#50 | 1.9%(+1.15)#3,554 |
| 51. | Holland | 3.0% | 2.1%(+0.855)#51 | 1.9%(+1.06)#3,748 |
| 52. | Stoneham | 3.0% | 2.1%(+0.854)#52 | 1.9%(+1.06)#3,751 |
| 53. | Salem | 2.9% | 2.1%(+0.786)#53 | 1.9%(+0.989)#3,888 |
| 54. | Upton | 2.8% | 2.1%(+0.746)#54 | 1.9%(+0.949)#3,988 |
| 55. | Northampton | 2.8% | 2.1%(+0.681)#55 | 1.9%(+0.884)#4,130 |
| 56. | Petersham | 2.8% | 2.1%(+0.657)#56 | 1.9%(+0.860)#4,188 |
| 57. | Marlborough | 2.8% | 2.1%(+0.655)#57 | 1.9%(+0.857)#4,195 |
| 58. | Topsfield | 2.8% | 2.1%(+0.652)#58 | 1.9%(+0.855)#4,201 |
| 59. | North Scituate | 2.7% | 2.1%(+0.644)#59 | 1.9%(+0.847)#4,227 |
| 60. | Sandwich | 2.7% | 2.1%(+0.642)#60 | 1.9%(+0.845)#4,231 |
| 61. | Shelburne Falls | 2.7% | 2.1%(+0.625)#61 | 1.9%(+0.828)#4,282 |
| 62. | Milton | 2.7% | 2.1%(+0.597)#62 | 1.9%(+0.799)#4,358 |
| 63. | Hanson | 2.7% | 2.1%(+0.593)#63 | 1.9%(+0.796)#4,365 |
| 64. | Framingham | 2.7% | 2.1%(+0.558)#64 | 1.9%(+0.761)#4,458 |
| 65. | Reading | 2.7% | 2.1%(+0.557)#65 | 1.9%(+0.760)#4,460 |
| 66. | Watertown Town | 2.6% | 2.1%(+0.528)#66 | 1.9%(+0.731)#4,544 |
| 67. | Weymouth Town | 2.6% | 2.1%(+0.521)#67 | 1.9%(+0.723)#4,553 |
| 68. | Newton | 2.6% | 2.1%(+0.520)#68 | 1.9%(+0.723)#4,555 |
| 69. | Saugus | 2.6% | 2.1%(+0.491)#69 | 1.9%(+0.694)#4,633 |
| 70. | Brewster | 2.6% | 2.1%(+0.482)#70 | 1.9%(+0.685)#4,662 |
| 71. | Waltham | 2.6% | 2.1%(+0.480)#71 | 1.9%(+0.683)#4,670 |
| 72. | Marion Center | 2.6% | 2.1%(+0.476)#72 | 1.9%(+0.679)#4,688 |
| 73. | Newburyport | 2.6% | 2.1%(+0.459)#73 | 1.9%(+0.661)#4,744 |
| 74. | Dedham | 2.5% | 2.1%(+0.447)#74 | 1.9%(+0.650)#4,779 |
| 75. | Quincy | 2.5% | 2.1%(+0.443)#75 | 1.9%(+0.646)#4,787 |
| 76. | Franklin Town | 2.5% | 2.1%(+0.430)#76 | 1.9%(+0.633)#4,823 |
| 77. | Woburn | 2.5% | 2.1%(+0.409)#77 | 1.9%(+0.611)#4,876 |
| 78. | Littleton Common | 2.5% | 2.1%(+0.401)#78 | 1.9%(+0.603)#4,906 |
| 79. | Brookline | 2.5% | 2.1%(+0.398)#79 | 1.9%(+0.601)#4,920 |
| 80. | Sagamore | 2.5% | 2.1%(+0.382)#80 | 1.9%(+0.585)#4,960 |
| 81. | Wakefield | 2.5% | 2.1%(+0.374)#81 | 1.9%(+0.577)#4,991 |
| 82. | Needham | 2.5% | 2.1%(+0.372)#82 | 1.9%(+0.575)#5,002 |
| 83. | Palmer Town | 2.5% | 2.1%(+0.350)#83 | 1.9%(+0.552)#5,072 |
| 84. | Medford | 2.4% | 2.1%(+0.319)#84 | 1.9%(+0.522)#5,150 |
| 85. | Pinehurst | 2.4% | 2.1%(+0.306)#85 | 1.9%(+0.509)#5,185 |
| 86. | Boston | 2.4% | 2.1%(+0.294)#86 | 1.9%(+0.497)#5,225 |
| 87. | Wilmington | 2.4% | 2.1%(+0.285)#87 | 1.9%(+0.488)#5,255 |
| 88. | Hudson | 2.4% | 2.1%(+0.267)#88 | 1.9%(+0.470)#5,313 |
| 89. | Bourne | 2.4% | 2.1%(+0.250)#89 | 1.9%(+0.453)#5,371 |
| 90. | Beverly | 2.3% | 2.1%(+0.227)#90 | 1.9%(+0.430)#5,456 |
| 91. | Athol | 2.3% | 2.1%(+0.224)#91 | 1.9%(+0.427)#5,477 |
| 92. | Easthampton Town | 2.3% | 2.1%(+0.211)#92 | 1.9%(+0.413)#5,514 |
| 93. | Falmouth | 2.3% | 2.1%(+0.203)#93 | 1.9%(+0.406)#5,543 |
| 94. | North Attleborough | 2.3% | 2.1%(+0.185)#94 | 1.9%(+0.388)#5,606 |
| 95. | North Seekonk | 2.3% | 2.1%(+0.178)#95 | 1.9%(+0.381)#5,627 |
| 96. | Housatonic | 2.2% | 2.1%(+0.141)#96 | 1.9%(+0.344)#5,756 |
| 97. | Cochituate | 2.2% | 2.1%(+0.107)#97 | 1.9%(+0.310)#5,875 |
| 98. | Orange | 2.2% | 2.1%(+0.097)#98 | 1.9%(+0.300)#5,907 |
| 99. | Dover | 2.2% | 2.1%(+0.085)#99 | 1.9%(+0.288)#5,966 |
| 100. | Leominster | 2.1% | 2.1%(+0.027)#100 | 1.9%(+0.229)#6,158 |
Common Questions
What are the Top 10 Cities with the Highest Percentage of Population Employed in Information in Massachusetts?
Top 10 Cities with the Highest Percentage of Population Employed in Information in Massachusetts are:
#1
35.9%
#2
15.2%
#3
13.3%
#4
8.0%
#5
7.8%
#6
7.1%
#7
6.9%
#8
6.8%
#9
6.4%
#10
6.3%
What city has the Highest Percentage of Population Employed in Information in Massachusetts?
Edgartown has the Highest Percentage of Population Employed in Information in Massachusetts with 35.9%.
What is the Percentage of Population Employed in Information in the State of Massachusetts?
Percentage of Population Employed in Information in Massachusetts is 2.1%.
What is the Percentage of Population Employed in Information in the United States?
Percentage of Population Employed in Information in the United States is 1.9%.