Cities with the Highest Percentage of Population Employed in Information in Georgia
RELATED REPORTS & OPTIONS
Information & Technology
Georgia
Compare Cities
Map of Cities with the Highest Percentage of Population Employed in Information in Georgia
0.0%
25.0%
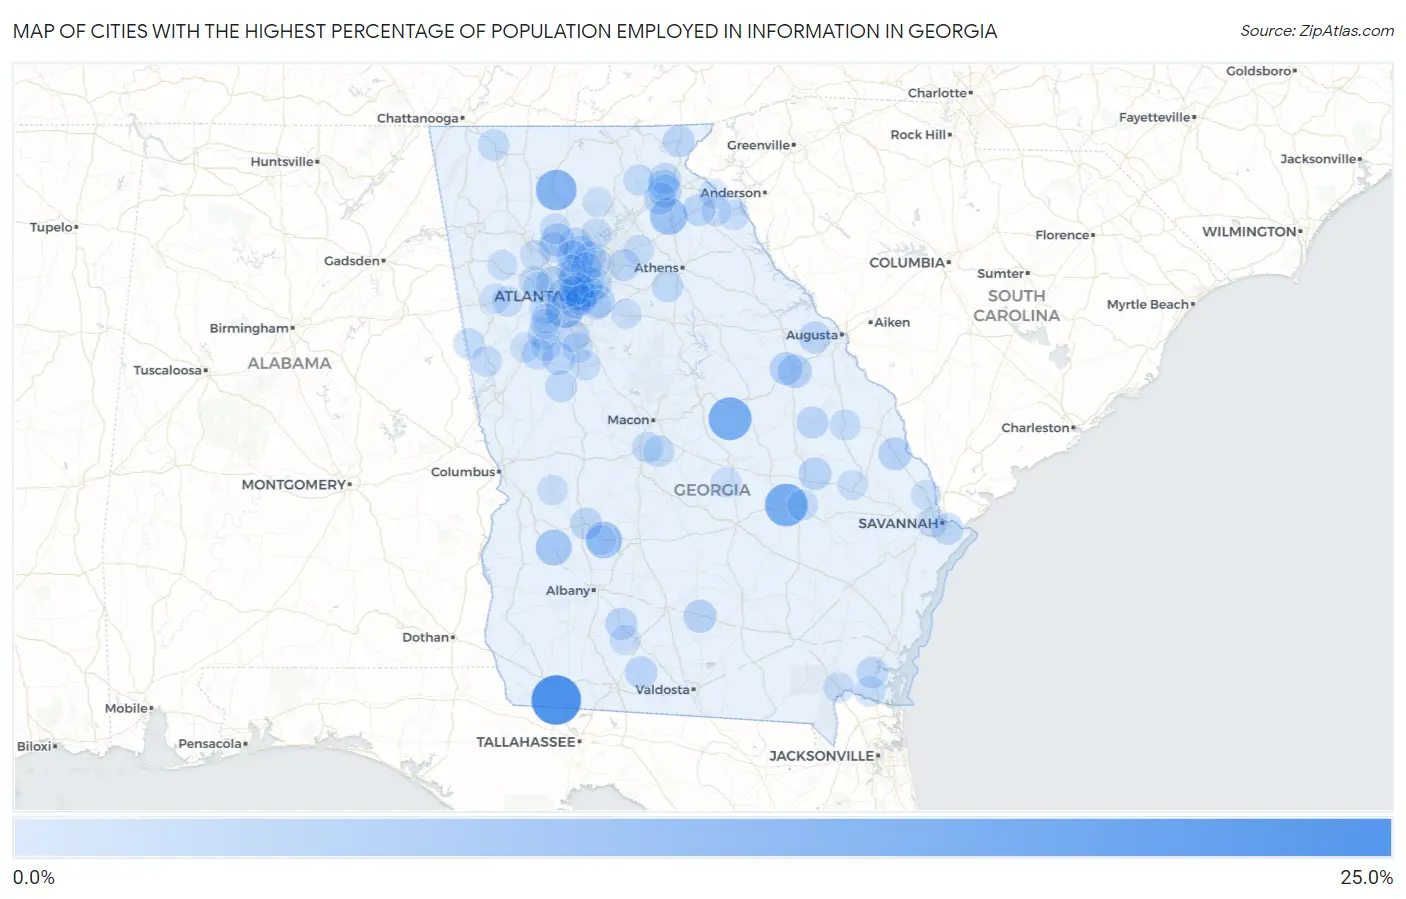
Cities with the Highest Percentage of Population Employed in Information in Georgia
| City | % Employed | vs State | vs National | |
| 1. | Attapulgus | 24.4% | 2.2%(+22.2)#1 | 1.9%(+22.5)#79 |
| 2. | Oconee | 16.7% | 2.2%(+14.4)#2 | 1.9%(+14.8)#158 |
| 3. | Higgston | 16.5% | 2.2%(+14.2)#3 | 1.9%(+14.6)#163 |
| 4. | Talking Rock | 14.3% | 2.2%(+12.0)#4 | 1.9%(+12.4)#212 |
| 5. | Smarr | 14.2% | 2.2%(+12.0)#5 | 1.9%(+12.3)#217 |
| 6. | Hapeville | 11.6% | 2.2%(+9.40)#6 | 1.9%(+9.75)#307 |
| 7. | Homer | 10.5% | 2.2%(+8.24)#7 | 1.9%(+8.58)#361 |
| 8. | De Soto | 9.7% | 2.2%(+7.43)#8 | 1.9%(+7.78)#424 |
| 9. | Parrott | 9.1% | 2.2%(+6.85)#9 | 1.9%(+7.19)#473 |
| 10. | Berry College | 8.0% | 2.2%(+5.72)#10 | 1.9%(+6.06)#590 |
| 11. | Wrens | 6.4% | 2.2%(+4.18)#11 | 1.9%(+4.52)#897 |
| 12. | Cornelia | 6.1% | 2.2%(+3.88)#12 | 1.9%(+4.22)#988 |
| 13. | Alapaha | 6.1% | 2.2%(+3.86)#13 | 1.9%(+4.20)#993 |
| 14. | Holly Springs | 6.1% | 2.2%(+3.85)#14 | 1.9%(+4.19)#998 |
| 15. | Newington | 6.1% | 2.2%(+3.82)#15 | 1.9%(+4.16)#1,006 |
| 16. | Decatur | 6.1% | 2.2%(+3.81)#16 | 1.9%(+4.15)#1,012 |
| 17. | Dunwoody | 6.0% | 2.2%(+3.78)#17 | 1.9%(+4.12)#1,025 |
| 18. | Stapleton | 6.0% | 2.2%(+3.76)#18 | 1.9%(+4.10)#1,031 |
| 19. | Avondale Estates | 5.7% | 2.2%(+3.46)#19 | 1.9%(+3.80)#1,141 |
| 20. | Stillmore | 5.7% | 2.2%(+3.41)#20 | 1.9%(+3.75)#1,162 |
| 21. | Ellerslie | 5.6% | 2.2%(+3.34)#21 | 1.9%(+3.68)#1,195 |
| 22. | Lithonia | 5.4% | 2.2%(+3.20)#22 | 1.9%(+3.54)#1,252 |
| 23. | Alpharetta | 5.4% | 2.2%(+3.14)#23 | 1.9%(+3.49)#1,270 |
| 24. | Brooks | 5.4% | 2.2%(+3.13)#24 | 1.9%(+3.47)#1,281 |
| 25. | Smyrna | 5.3% | 2.2%(+3.10)#25 | 1.9%(+3.44)#1,295 |
| 26. | Milton | 5.2% | 2.2%(+2.95)#26 | 1.9%(+3.30)#1,360 |
| 27. | Pavo | 5.1% | 2.2%(+2.90)#27 | 1.9%(+3.25)#1,385 |
| 28. | Alto | 5.1% | 2.2%(+2.89)#28 | 1.9%(+3.23)#1,390 |
| 29. | Dacula | 5.1% | 2.2%(+2.84)#29 | 1.9%(+3.19)#1,421 |
| 30. | Belvedere Park | 5.1% | 2.2%(+2.82)#30 | 1.9%(+3.17)#1,430 |
| 31. | Gresham Park | 5.0% | 2.2%(+2.79)#31 | 1.9%(+3.14)#1,448 |
| 32. | Carnesville | 5.0% | 2.2%(+2.71)#32 | 1.9%(+3.06)#1,501 |
| 33. | Doerun | 5.0% | 2.2%(+2.71)#33 | 1.9%(+3.05)#1,505 |
| 34. | Midville | 4.9% | 2.2%(+2.70)#34 | 1.9%(+3.05)#1,510 |
| 35. | Johns Creek | 4.9% | 2.2%(+2.69)#35 | 1.9%(+3.04)#1,515 |
| 36. | Americus | 4.9% | 2.2%(+2.68)#36 | 1.9%(+3.03)#1,519 |
| 37. | Clayton | 4.9% | 2.2%(+2.61)#37 | 1.9%(+2.95)#1,564 |
| 38. | Grovetown | 4.8% | 2.2%(+2.60)#38 | 1.9%(+2.95)#1,568 |
| 39. | Brookhaven | 4.8% | 2.2%(+2.53)#39 | 1.9%(+2.88)#1,602 |
| 40. | Concord | 4.8% | 2.2%(+2.52)#40 | 1.9%(+2.86)#1,611 |
| 41. | Thunderbolt | 4.7% | 2.2%(+2.46)#41 | 1.9%(+2.81)#1,636 |
| 42. | Pine Lake | 4.7% | 2.2%(+2.46)#42 | 1.9%(+2.81)#1,641 |
| 43. | Clarkesville | 4.7% | 2.2%(+2.45)#43 | 1.9%(+2.80)#1,645 |
| 44. | Roswell | 4.6% | 2.2%(+2.37)#44 | 1.9%(+2.72)#1,707 |
| 45. | Bonanza | 4.6% | 2.2%(+2.36)#45 | 1.9%(+2.71)#1,717 |
| 46. | Tyrone | 4.6% | 2.2%(+2.32)#46 | 1.9%(+2.67)#1,740 |
| 47. | North High Shoals | 4.5% | 2.2%(+2.30)#47 | 1.9%(+2.65)#1,748 |
| 48. | Mountain Park | 4.5% | 2.2%(+2.28)#48 | 1.9%(+2.62)#1,769 |
| 49. | Woodbine | 4.5% | 2.2%(+2.23)#49 | 1.9%(+2.58)#1,801 |
| 50. | North Decatur | 4.4% | 2.2%(+2.16)#50 | 1.9%(+2.51)#1,861 |
| 51. | Tunnel Hill | 4.4% | 2.2%(+2.13)#51 | 1.9%(+2.48)#1,883 |
| 52. | Sharpsburg | 4.3% | 2.2%(+2.08)#52 | 1.9%(+2.43)#1,925 |
| 53. | Centerville | 4.3% | 2.2%(+2.06)#53 | 1.9%(+2.40)#1,941 |
| 54. | Robins Afb | 4.3% | 2.2%(+2.01)#54 | 1.9%(+2.36)#1,980 |
| 55. | Demorest | 4.2% | 2.2%(+1.99)#55 | 1.9%(+2.34)#2,004 |
| 56. | Tucker | 4.1% | 2.2%(+1.81)#56 | 1.9%(+2.16)#2,165 |
| 57. | Peachtree Corners | 4.0% | 2.2%(+1.74)#57 | 1.9%(+2.09)#2,238 |
| 58. | Austell | 4.0% | 2.2%(+1.72)#58 | 1.9%(+2.07)#2,258 |
| 59. | Cleveland | 3.9% | 2.2%(+1.65)#59 | 1.9%(+2.00)#2,344 |
| 60. | Kennesaw State University | 3.8% | 2.2%(+1.58)#60 | 1.9%(+1.93)#2,421 |
| 61. | Ephesus | 3.8% | 2.2%(+1.54)#61 | 1.9%(+1.89)#2,463 |
| 62. | Millen | 3.8% | 2.2%(+1.53)#62 | 1.9%(+1.88)#2,485 |
| 63. | Lyons | 3.8% | 2.2%(+1.53)#63 | 1.9%(+1.88)#2,490 |
| 64. | Franklin | 3.8% | 2.2%(+1.53)#64 | 1.9%(+1.88)#2,493 |
| 65. | Kingsland | 3.7% | 2.2%(+1.47)#65 | 1.9%(+1.82)#2,557 |
| 66. | Hampton | 3.7% | 2.2%(+1.45)#66 | 1.9%(+1.79)#2,603 |
| 67. | Folkston | 3.6% | 2.2%(+1.37)#67 | 1.9%(+1.72)#2,687 |
| 68. | Atlanta | 3.6% | 2.2%(+1.34)#68 | 1.9%(+1.69)#2,734 |
| 69. | Villa Rica | 3.6% | 2.2%(+1.34)#69 | 1.9%(+1.68)#2,740 |
| 70. | South Fulton | 3.6% | 2.2%(+1.31)#70 | 1.9%(+1.66)#2,763 |
| 71. | Candler Mcafee | 3.5% | 2.2%(+1.30)#71 | 1.9%(+1.65)#2,780 |
| 72. | Woodstock | 3.5% | 2.2%(+1.27)#72 | 1.9%(+1.62)#2,811 |
| 73. | Buena Vista | 3.5% | 2.2%(+1.22)#73 | 1.9%(+1.56)#2,890 |
| 74. | Powder Springs | 3.5% | 2.2%(+1.21)#74 | 1.9%(+1.56)#2,894 |
| 75. | Druid Hills | 3.4% | 2.2%(+1.19)#75 | 1.9%(+1.54)#2,912 |
| 76. | Sandy Springs | 3.4% | 2.2%(+1.19)#76 | 1.9%(+1.53)#2,927 |
| 77. | Hoschton | 3.4% | 2.2%(+1.18)#77 | 1.9%(+1.53)#2,928 |
| 78. | Canton | 3.4% | 2.2%(+1.16)#78 | 1.9%(+1.51)#2,957 |
| 79. | Cumming | 3.4% | 2.2%(+1.16)#79 | 1.9%(+1.50)#2,968 |
| 80. | East Griffin | 3.4% | 2.2%(+1.15)#80 | 1.9%(+1.50)#2,971 |
| 81. | Funston | 3.4% | 2.2%(+1.11)#81 | 1.9%(+1.45)#3,040 |
| 82. | Rentz | 3.3% | 2.2%(+1.05)#82 | 1.9%(+1.40)#3,127 |
| 83. | Duluth | 3.2% | 2.2%(+1.00)#83 | 1.9%(+1.35)#3,195 |
| 84. | Peachtree City | 3.2% | 2.2%(+0.993)#84 | 1.9%(+1.34)#3,208 |
| 85. | Acworth | 3.2% | 2.2%(+0.992)#85 | 1.9%(+1.34)#3,211 |
| 86. | Register | 3.2% | 2.2%(+0.983)#86 | 1.9%(+1.33)#3,232 |
| 87. | Union City | 3.2% | 2.2%(+0.947)#87 | 1.9%(+1.29)#3,285 |
| 88. | Hartwell | 3.2% | 2.2%(+0.923)#88 | 1.9%(+1.27)#3,342 |
| 89. | Fairburn | 3.2% | 2.2%(+0.923)#89 | 1.9%(+1.27)#3,343 |
| 90. | Garden City | 3.1% | 2.2%(+0.907)#90 | 1.9%(+1.25)#3,375 |
| 91. | Oxford | 3.1% | 2.2%(+0.903)#91 | 1.9%(+1.25)#3,389 |
| 92. | Temple | 3.1% | 2.2%(+0.848)#92 | 1.9%(+1.19)#3,481 |
| 93. | Rincon | 3.1% | 2.2%(+0.844)#93 | 1.9%(+1.19)#3,484 |
| 94. | Bowersville | 3.1% | 2.2%(+0.834)#94 | 1.9%(+1.18)#3,508 |
| 95. | Braswell | 3.0% | 2.2%(+0.806)#95 | 1.9%(+1.15)#3,568 |
| 96. | Newnan | 3.0% | 2.2%(+0.764)#96 | 1.9%(+1.11)#3,657 |
| 97. | Dawsonville | 3.0% | 2.2%(+0.759)#97 | 1.9%(+1.10)#3,664 |
| 98. | Gumlog | 3.0% | 2.2%(+0.742)#98 | 1.9%(+1.09)#3,701 |
| 99. | Stonecrest | 2.9% | 2.2%(+0.660)#99 | 1.9%(+1.00)#3,847 |
| 100. | Leslie | 2.8% | 2.2%(+0.601)#100 | 1.9%(+0.945)#3,993 |
Common Questions
What are the Top 10 Cities with the Highest Percentage of Population Employed in Information in Georgia?
Top 10 Cities with the Highest Percentage of Population Employed in Information in Georgia are:
#1
24.4%
#2
16.7%
#3
16.5%
#4
14.3%
#5
11.6%
#6
10.5%
#7
9.7%
#8
9.1%
#9
6.4%
#10
6.1%
What city has the Highest Percentage of Population Employed in Information in Georgia?
Attapulgus has the Highest Percentage of Population Employed in Information in Georgia with 24.4%.
What is the Percentage of Population Employed in Information in the State of Georgia?
Percentage of Population Employed in Information in Georgia is 2.2%.
What is the Percentage of Population Employed in Information in the United States?
Percentage of Population Employed in Information in the United States is 1.9%.