Cities with the Highest Percentage of Population Employed in Information in Arizona
RELATED REPORTS & OPTIONS
Information & Technology
Arizona
Compare Cities
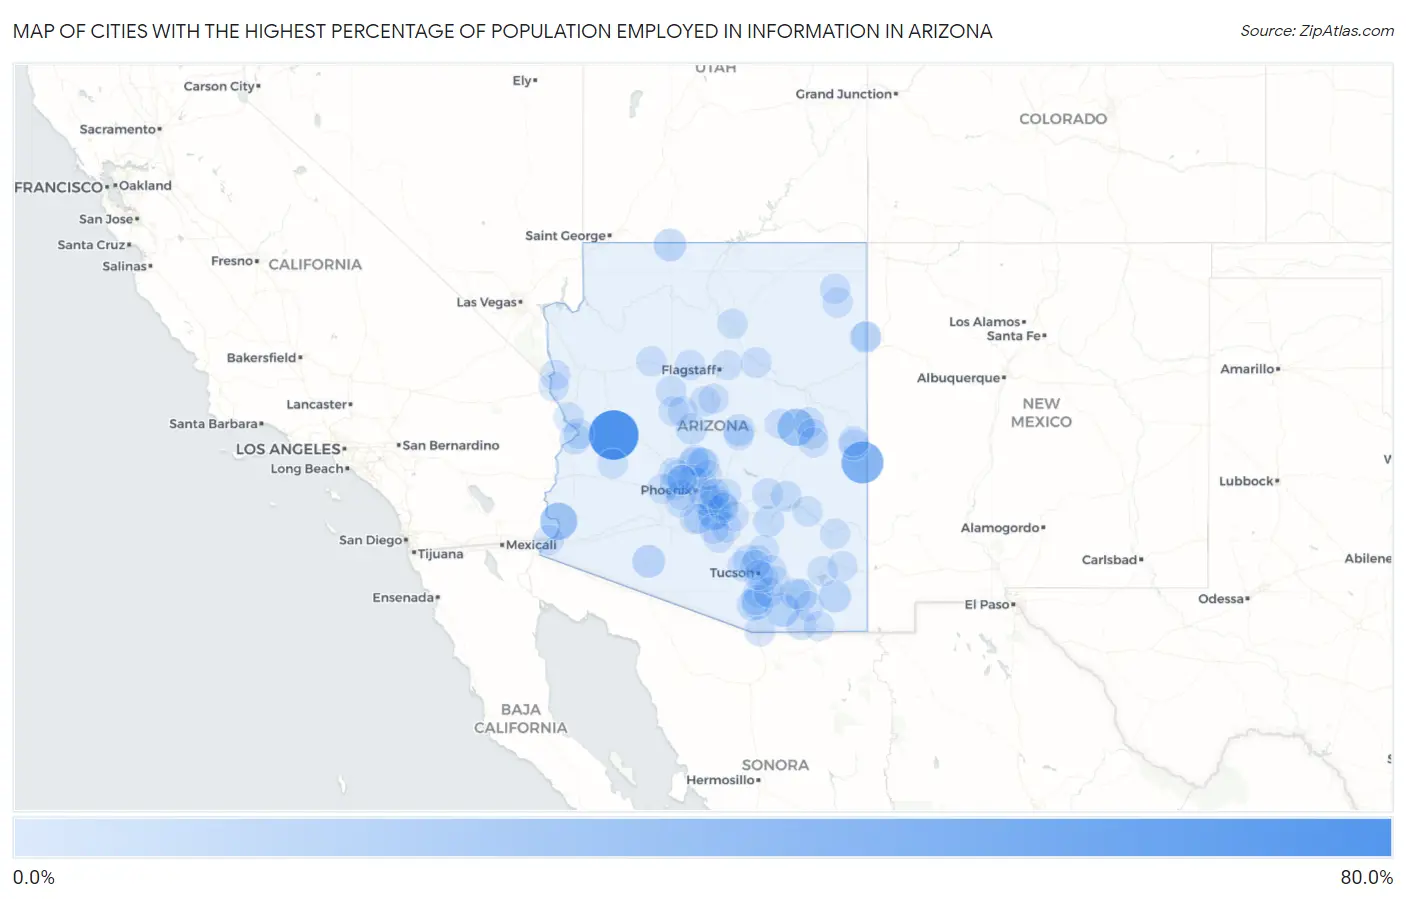
Map of Cities with the Highest Percentage of Population Employed in Information in Arizona
0.0%
80.0%
Cities with the Highest Percentage of Population Employed in Information in Arizona
| City | % Employed | vs State | vs National | |
| 1. | Alamo Lake | 77.8% | 1.7%(+76.1)#1 | 1.9%(+75.9)#7 |
| 2. | Alpine | 47.1% | 1.7%(+45.4)#2 | 1.9%(+45.2)#24 |
| 3. | Clay Springs | 28.4% | 1.7%(+26.7)#3 | 1.9%(+26.5)#60 |
| 4. | Martinez Lake | 27.6% | 1.7%(+25.9)#4 | 1.9%(+25.7)#65 |
| 5. | Elgin | 14.8% | 1.7%(+13.2)#5 | 1.9%(+12.9)#194 |
| 6. | Upper Santan Village | 13.1% | 1.7%(+11.5)#6 | 1.9%(+11.2)#245 |
| 7. | Ajo | 11.2% | 1.7%(+9.50)#7 | 1.9%(+9.26)#321 |
| 8. | Fredonia | 10.7% | 1.7%(+9.02)#8 | 1.9%(+8.79)#350 |
| 9. | Sunizona | 8.8% | 1.7%(+7.11)#9 | 1.9%(+6.87)#505 |
| 10. | St David | 7.8% | 1.7%(+6.11)#10 | 1.9%(+5.87)#612 |
| 11. | Freedom Acres | 7.1% | 1.7%(+5.42)#11 | 1.9%(+5.18)#751 |
| 12. | Kaibab Estates West | 7.0% | 1.7%(+5.38)#12 | 1.9%(+5.15)#756 |
| 13. | Forest Lakes | 6.7% | 1.7%(+5.00)#13 | 1.9%(+4.77)#837 |
| 14. | Arivaca Junction | 6.6% | 1.7%(+4.96)#14 | 1.9%(+4.73)#852 |
| 15. | Elephant Head | 6.6% | 1.7%(+4.95)#15 | 1.9%(+4.71)#858 |
| 16. | Spring Valley | 6.2% | 1.7%(+4.55)#16 | 1.9%(+4.31)#964 |
| 17. | Paradise Valley | 5.5% | 1.7%(+3.88)#17 | 1.9%(+3.65)#1,215 |
| 18. | Sacaton | 5.4% | 1.7%(+3.69)#18 | 1.9%(+3.45)#1,292 |
| 19. | Hayden | 5.0% | 1.7%(+3.37)#19 | 1.9%(+3.14)#1,447 |
| 20. | St Michaels | 4.9% | 1.7%(+3.23)#20 | 1.9%(+2.99)#1,539 |
| 21. | Circle | 4.8% | 1.7%(+3.18)#21 | 1.9%(+2.95)#1,569 |
| 22. | Cienega Springs | 4.7% | 1.7%(+3.04)#22 | 1.9%(+2.81)#1,637 |
| 23. | Carefree | 4.7% | 1.7%(+2.99)#23 | 1.9%(+2.75)#1,673 |
| 24. | Ak Chin Village | 4.4% | 1.7%(+2.70)#24 | 1.9%(+2.46)#1,902 |
| 25. | Benson | 4.2% | 1.7%(+2.57)#25 | 1.9%(+2.33)#2,010 |
| 26. | Central Heights Midland City | 3.8% | 1.7%(+2.12)#26 | 1.9%(+1.88)#2,481 |
| 27. | Paulden | 3.4% | 1.7%(+1.77)#27 | 1.9%(+1.54)#2,914 |
| 28. | San Carlos | 3.4% | 1.7%(+1.69)#28 | 1.9%(+1.45)#3,032 |
| 29. | Arizona City | 3.2% | 1.7%(+1.57)#29 | 1.9%(+1.33)#3,215 |
| 30. | Taylor | 3.2% | 1.7%(+1.50)#30 | 1.9%(+1.27)#3,347 |
| 31. | Avenue B And C | 3.2% | 1.7%(+1.50)#31 | 1.9%(+1.26)#3,356 |
| 32. | Leupp | 3.1% | 1.7%(+1.43)#32 | 1.9%(+1.20)#3,476 |
| 33. | Eagar | 2.9% | 1.7%(+1.22)#33 | 1.9%(+0.987)#3,893 |
| 34. | Sahuarita | 2.9% | 1.7%(+1.19)#34 | 1.9%(+0.953)#3,981 |
| 35. | Picture Rocks | 2.7% | 1.7%(+1.02)#35 | 1.9%(+0.784)#4,398 |
| 36. | Show Low | 2.6% | 1.7%(+0.977)#36 | 1.9%(+0.741)#4,514 |
| 37. | Citrus Park | 2.6% | 1.7%(+0.969)#37 | 1.9%(+0.732)#4,542 |
| 38. | Cornville | 2.6% | 1.7%(+0.911)#38 | 1.9%(+0.675)#4,697 |
| 39. | Seligman | 2.6% | 1.7%(+0.910)#39 | 1.9%(+0.673)#4,701 |
| 40. | Nogales | 2.6% | 1.7%(+0.902)#40 | 1.9%(+0.665)#4,739 |
| 41. | Sierra Vista Southeast | 2.5% | 1.7%(+0.853)#41 | 1.9%(+0.617)#4,861 |
| 42. | Chinle | 2.5% | 1.7%(+0.845)#42 | 1.9%(+0.608)#4,888 |
| 43. | Payson | 2.5% | 1.7%(+0.819)#43 | 1.9%(+0.583)#4,968 |
| 44. | Marana | 2.4% | 1.7%(+0.782)#44 | 1.9%(+0.545)#5,095 |
| 45. | Bullhead City | 2.4% | 1.7%(+0.771)#45 | 1.9%(+0.534)#5,129 |
| 46. | Tucson Mountains | 2.4% | 1.7%(+0.709)#46 | 1.9%(+0.472)#5,308 |
| 47. | Green Valley | 2.3% | 1.7%(+0.632)#47 | 1.9%(+0.395)#5,578 |
| 48. | Chandler | 2.3% | 1.7%(+0.606)#48 | 1.9%(+0.369)#5,670 |
| 49. | Bylas | 2.3% | 1.7%(+0.598)#49 | 1.9%(+0.361)#5,689 |
| 50. | Tempe | 2.2% | 1.7%(+0.538)#50 | 1.9%(+0.301)#5,904 |
| 51. | New River | 2.2% | 1.7%(+0.530)#51 | 1.9%(+0.293)#5,940 |
| 52. | Corona De Tucson | 2.2% | 1.7%(+0.513)#52 | 1.9%(+0.276)#5,995 |
| 53. | Many Farms | 2.2% | 1.7%(+0.512)#53 | 1.9%(+0.276)#5,998 |
| 54. | Anthem | 2.2% | 1.7%(+0.496)#54 | 1.9%(+0.260)#6,055 |
| 55. | Parker Strip | 2.1% | 1.7%(+0.477)#55 | 1.9%(+0.241)#6,117 |
| 56. | Cameron | 2.1% | 1.7%(+0.473)#56 | 1.9%(+0.237)#6,129 |
| 57. | Gilbert | 2.1% | 1.7%(+0.441)#57 | 1.9%(+0.205)#6,249 |
| 58. | Williams | 2.0% | 1.7%(+0.371)#58 | 1.9%(+0.135)#6,517 |
| 59. | Coolidge | 2.0% | 1.7%(+0.355)#59 | 1.9%(+0.119)#6,585 |
| 60. | Village Of Oak Creek Big Park | 2.0% | 1.7%(+0.339)#60 | 1.9%(+0.103)#6,650 |
| 61. | Wenden | 2.0% | 1.7%(+0.338)#61 | 1.9%(+0.102)#6,656 |
| 62. | Queen Creek | 2.0% | 1.7%(+0.309)#62 | 1.9%(+0.073)#6,771 |
| 63. | Saddlebrooke | 2.0% | 1.7%(+0.307)#63 | 1.9%(+0.071)#6,784 |
| 64. | Solomon | 1.9% | 1.7%(+0.280)#64 | 1.9%(+0.043)#6,899 |
| 65. | Prescott | 1.9% | 1.7%(+0.272)#65 | 1.9%(+0.036)#6,931 |
| 66. | Window Rock | 1.9% | 1.7%(+0.272)#66 | 1.9%(+0.035)#6,933 |
| 67. | Phoenix | 1.8% | 1.7%(+0.157)#67 | 1.9%(-0.079)#7,415 |
| 68. | Scottsdale | 1.8% | 1.7%(+0.151)#68 | 1.9%(-0.086)#7,458 |
| 69. | Sun City West | 1.8% | 1.7%(+0.150)#69 | 1.9%(-0.087)#7,463 |
| 70. | Willcox | 1.8% | 1.7%(+0.147)#70 | 1.9%(-0.089)#7,472 |
| 71. | Surprise | 1.8% | 1.7%(+0.105)#71 | 1.9%(-0.132)#7,702 |
| 72. | Heber Overgaard | 1.7% | 1.7%(+0.070)#72 | 1.9%(-0.167)#7,879 |
| 73. | Tombstone | 1.7% | 1.7%(+0.066)#73 | 1.9%(-0.170)#7,894 |
| 74. | Apache Junction | 1.7% | 1.7%(+0.064)#74 | 1.9%(-0.172)#7,903 |
| 75. | Lake Havasu City | 1.7% | 1.7%(+0.042)#75 | 1.9%(-0.195)#8,008 |
| 76. | Rincon Valley | 1.7% | 1.7%(+0.027)#76 | 1.9%(-0.209)#8,074 |
| 77. | Goodyear | 1.7% | 1.7%(+0.025)#77 | 1.9%(-0.211)#8,082 |
| 78. | Oro Valley | 1.7% | 1.7%(+0.005)#78 | 1.9%(-0.231)#8,175 |
| 79. | Florence | 1.7% | 1.7%(-0.003)#79 | 1.9%(-0.240)#8,223 |
| 80. | Springerville | 1.7% | 1.7%(-0.009)#80 | 1.9%(-0.246)#8,256 |
| 81. | Tanque Verde | 1.6% | 1.7%(-0.020)#81 | 1.9%(-0.257)#8,311 |
| 82. | Maricopa | 1.6% | 1.7%(-0.025)#82 | 1.9%(-0.261)#8,346 |
| 83. | Tucson | 1.6% | 1.7%(-0.026)#83 | 1.9%(-0.263)#8,354 |
| 84. | Bowie | 1.6% | 1.7%(-0.036)#84 | 1.9%(-0.272)#8,400 |
| 85. | Cave Creek | 1.6% | 1.7%(-0.070)#85 | 1.9%(-0.306)#8,557 |
| 86. | Casas Adobes | 1.6% | 1.7%(-0.076)#86 | 1.9%(-0.312)#8,587 |
| 87. | Mesquite Creek | 1.6% | 1.7%(-0.112)#87 | 1.9%(-0.348)#8,780 |
| 88. | San Tan Valley | 1.5% | 1.7%(-0.137)#88 | 1.9%(-0.374)#8,895 |
| 89. | Mesa | 1.5% | 1.7%(-0.140)#89 | 1.9%(-0.376)#8,917 |
| 90. | Casa Grande | 1.5% | 1.7%(-0.144)#90 | 1.9%(-0.381)#8,946 |
| 91. | Avondale | 1.5% | 1.7%(-0.145)#91 | 1.9%(-0.381)#8,947 |
| 92. | Prescott Valley | 1.5% | 1.7%(-0.178)#92 | 1.9%(-0.415)#9,120 |
| 93. | South Tucson | 1.5% | 1.7%(-0.184)#93 | 1.9%(-0.421)#9,166 |
| 94. | El Mirage | 1.5% | 1.7%(-0.186)#94 | 1.9%(-0.423)#9,180 |
| 95. | Buckeye | 1.5% | 1.7%(-0.195)#95 | 1.9%(-0.431)#9,236 |
| 96. | Glendale | 1.5% | 1.7%(-0.197)#96 | 1.9%(-0.434)#9,251 |
| 97. | Doney Park | 1.5% | 1.7%(-0.208)#97 | 1.9%(-0.444)#9,310 |
| 98. | Bisbee | 1.4% | 1.7%(-0.217)#98 | 1.9%(-0.453)#9,360 |
| 99. | Lake Of The Woods | 1.4% | 1.7%(-0.235)#99 | 1.9%(-0.472)#9,457 |
| 100. | Red Lake | 1.4% | 1.7%(-0.278)#100 | 1.9%(-0.515)#9,703 |
Common Questions
What are the Top 10 Cities with the Highest Percentage of Population Employed in Information in Arizona?
Top 10 Cities with the Highest Percentage of Population Employed in Information in Arizona are:
#1
77.8%
#2
47.1%
#3
28.4%
#4
27.6%
#5
14.8%
#6
13.1%
#7
11.2%
#8
10.7%
#9
8.8%
#10
7.8%
What city has the Highest Percentage of Population Employed in Information in Arizona?
Alamo Lake has the Highest Percentage of Population Employed in Information in Arizona with 77.8%.
What is the Percentage of Population Employed in Information in the State of Arizona?
Percentage of Population Employed in Information in Arizona is 1.7%.
What is the Percentage of Population Employed in Information in the United States?
Percentage of Population Employed in Information in the United States is 1.9%.