Big River, CA Map & Demographics
Big River Map
Big River Overview
$30,860
PER CAPITA INCOME
$54,567
AVG FAMILY INCOME
$47,222
AVG HOUSEHOLD INCOME
11.1%
WAGE / INCOME GAP [ % ]
88.9¢/ $1
WAGE / INCOME GAP [ $ ]
0.48
INEQUALITY / GINI INDEX
1,028
TOTAL POPULATION
552
MALE POPULATION
476
FEMALE POPULATION
115.97
MALES / 100 FEMALES
86.23
FEMALES / 100 MALES
58.5
MEDIAN AGE
2.6
AVG FAMILY SIZE
2.0
AVG HOUSEHOLD SIZE
388
LABOR FORCE [ PEOPLE ]
43.4%
PERCENT IN LABOR FORCE
11.3%
UNEMPLOYMENT RATE
Big River Area Codes
Income in Big River
Income Overview in Big River
Per Capita Income in Big River is $30,860, while median incomes of families and households are $54,567 and $47,222 respectively.
| Characteristic | Number | Measure |
| Per Capita Income | 1,028 | $30,860 |
| Median Family Income | 257 | $54,567 |
| Mean Family Income | 257 | $65,282 |
| Median Household Income | 522 | $47,222 |
| Mean Household Income | 522 | $59,701 |
| Income Deficit | 257 | $0 |
| Wage / Income Gap (%) | 1,028 | 11.09% |
| Wage / Income Gap ($) | 1,028 | 88.91¢ per $1 |
| Gini / Inequality Index | 1,028 | 0.48 |
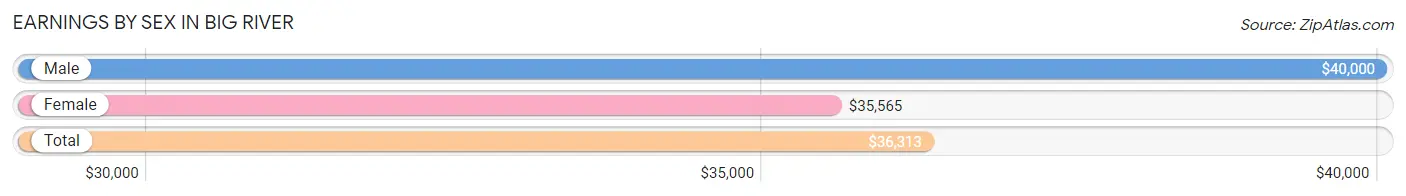
Earnings by Sex in Big River
Average Earnings in Big River are $36,313, $40,000 for men and $35,565 for women, a difference of 11.1%.
| Sex | Number | Average Earnings |
| Male | 178 (48.4%) | $40,000 |
| Female | 190 (51.6%) | $35,565 |
| Total | 368 (100.0%) | $36,313 |
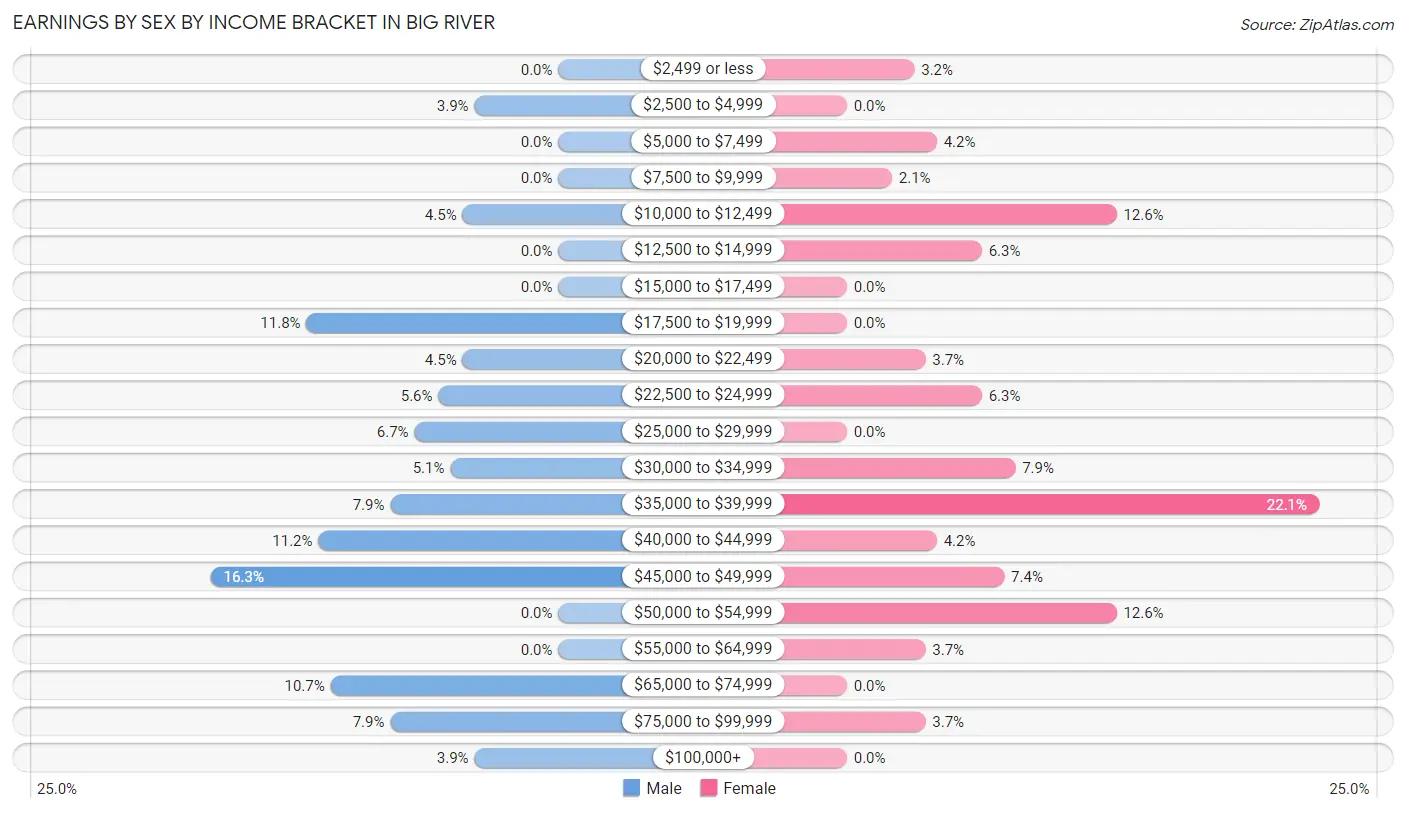
Earnings by Sex by Income Bracket in Big River
The most common earnings brackets in Big River are $45,000 to $49,999 for men (29 | 16.3%) and $35,000 to $39,999 for women (42 | 22.1%).
| Income | Male | Female |
| $2,499 or less | 0 (0.0%) | 6 (3.2%) |
| $2,500 to $4,999 | 7 (3.9%) | 0 (0.0%) |
| $5,000 to $7,499 | 0 (0.0%) | 8 (4.2%) |
| $7,500 to $9,999 | 0 (0.0%) | 4 (2.1%) |
| $10,000 to $12,499 | 8 (4.5%) | 24 (12.6%) |
| $12,500 to $14,999 | 0 (0.0%) | 12 (6.3%) |
| $15,000 to $17,499 | 0 (0.0%) | 0 (0.0%) |
| $17,500 to $19,999 | 21 (11.8%) | 0 (0.0%) |
| $20,000 to $22,499 | 8 (4.5%) | 7 (3.7%) |
| $22,500 to $24,999 | 10 (5.6%) | 12 (6.3%) |
| $25,000 to $29,999 | 12 (6.7%) | 0 (0.0%) |
| $30,000 to $34,999 | 9 (5.1%) | 15 (7.9%) |
| $35,000 to $39,999 | 14 (7.9%) | 42 (22.1%) |
| $40,000 to $44,999 | 20 (11.2%) | 8 (4.2%) |
| $45,000 to $49,999 | 29 (16.3%) | 14 (7.4%) |
| $50,000 to $54,999 | 0 (0.0%) | 24 (12.6%) |
| $55,000 to $64,999 | 0 (0.0%) | 7 (3.7%) |
| $65,000 to $74,999 | 19 (10.7%) | 0 (0.0%) |
| $75,000 to $99,999 | 14 (7.9%) | 7 (3.7%) |
| $100,000+ | 7 (3.9%) | 0 (0.0%) |
| Total | 178 (100.0%) | 190 (100.0%) |
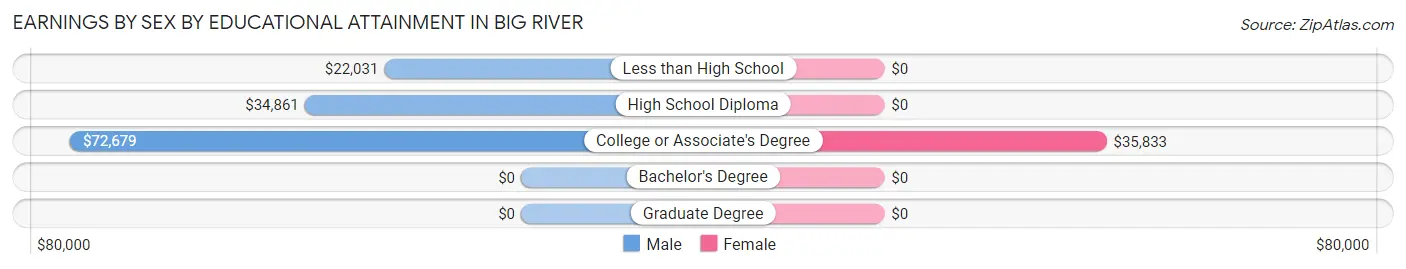
Earnings by Sex by Educational Attainment in Big River
Average earnings in Big River are $41,964 for men and $35,787 for women, a difference of 14.7%. Men with an educational attainment of college or associate's degree enjoy the highest average annual earnings of $72,679, while those with less than high school education earn the least with $22,031. Women with an educational attainment of college or associate's degree earn the most with the average annual earnings of $35,833, while those with college or associate's degree education have the smallest earnings of $35,833.
| Educational Attainment | Male Income | Female Income |
| Less than High School | $22,031 | $0 |
| High School Diploma | $34,861 | $0 |
| College or Associate's Degree | $72,679 | $35,833 |
| Bachelor's Degree | - | - |
| Graduate Degree | - | - |
| Total | $41,964 | $35,787 |
Family Income in Big River
Family Income Brackets in Big River
According to the Big River family income data, there are 75 families falling into the $50,000 to $74,999 income range, which is the most common income bracket and makes up 29.2% of all families.
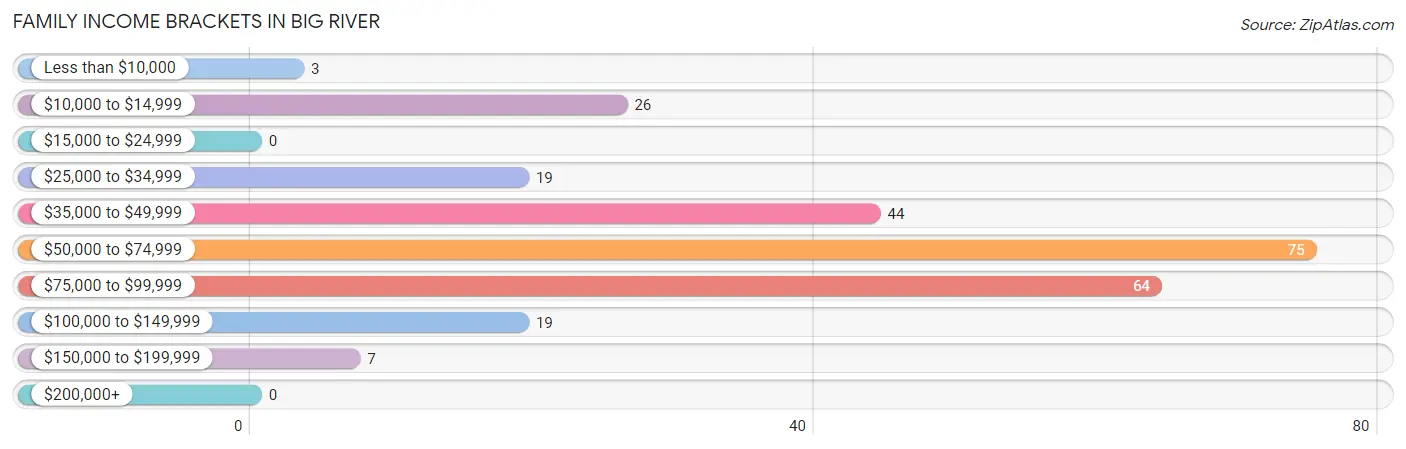
| Income Bracket | # Families | % Families |
| Less than $10,000 | 3 | 1.2% |
| $10,000 to $14,999 | 26 | 10.1% |
| $15,000 to $24,999 | 0 | 0.0% |
| $25,000 to $34,999 | 19 | 7.4% |
| $35,000 to $49,999 | 44 | 17.1% |
| $50,000 to $74,999 | 75 | 29.2% |
| $75,000 to $99,999 | 64 | 24.9% |
| $100,000 to $149,999 | 19 | 7.4% |
| $150,000 to $199,999 | 7 | 2.7% |
| $200,000+ | 0 | 0.0% |
Family Income by Famaliy Size in Big River
3-person families (45 | 17.5%) account for the highest median family income in Big River with $97,656 per family, while 3-person families (45 | 17.5%) have the highest median income of $32,552 per family member.
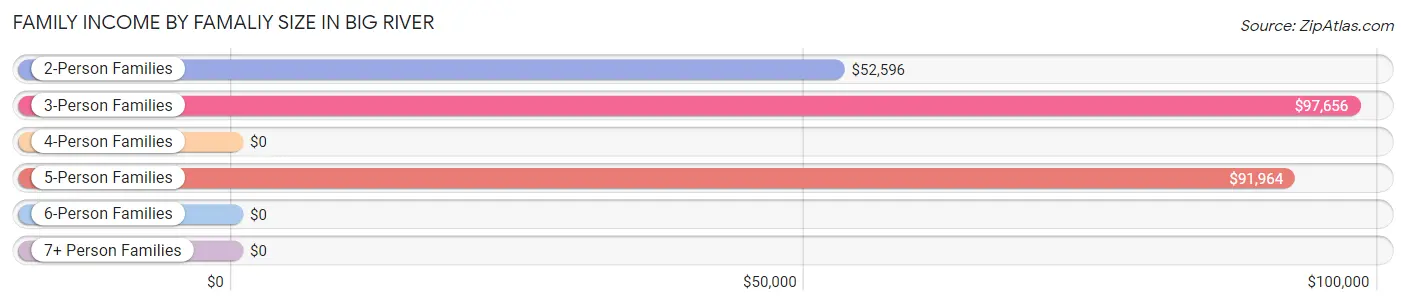
| Income Bracket | # Families | Median Income |
| 2-Person Families | 180 (70.0%) | $52,596 |
| 3-Person Families | 45 (17.5%) | $97,656 |
| 4-Person Families | 15 (5.8%) | $0 |
| 5-Person Families | 17 (6.6%) | $91,964 |
| 6-Person Families | 0 (0.0%) | $0 |
| 7+ Person Families | 0 (0.0%) | $0 |
| Total | 257 (100.0%) | $54,567 |
Family Income by Number of Earners in Big River
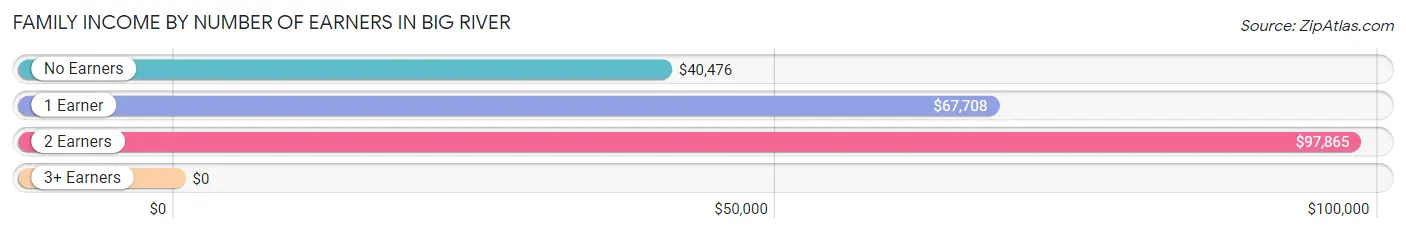
| Number of Earners | # Families | Median Income |
| No Earners | 94 (36.6%) | $40,476 |
| 1 Earner | 74 (28.8%) | $67,708 |
| 2 Earners | 85 (33.1%) | $97,865 |
| 3+ Earners | 4 (1.6%) | $0 |
| Total | 257 (100.0%) | $54,567 |
Household Income in Big River
Household Income Brackets in Big River
With 127 households falling in the category, the $50,000 to $74,999 income range is the most frequent in Big River, accounting for 24.3% of all households. In contrast, only 7 households (1.3%) fall into the $150,000 to $199,999 income bracket, making it the least populous group.
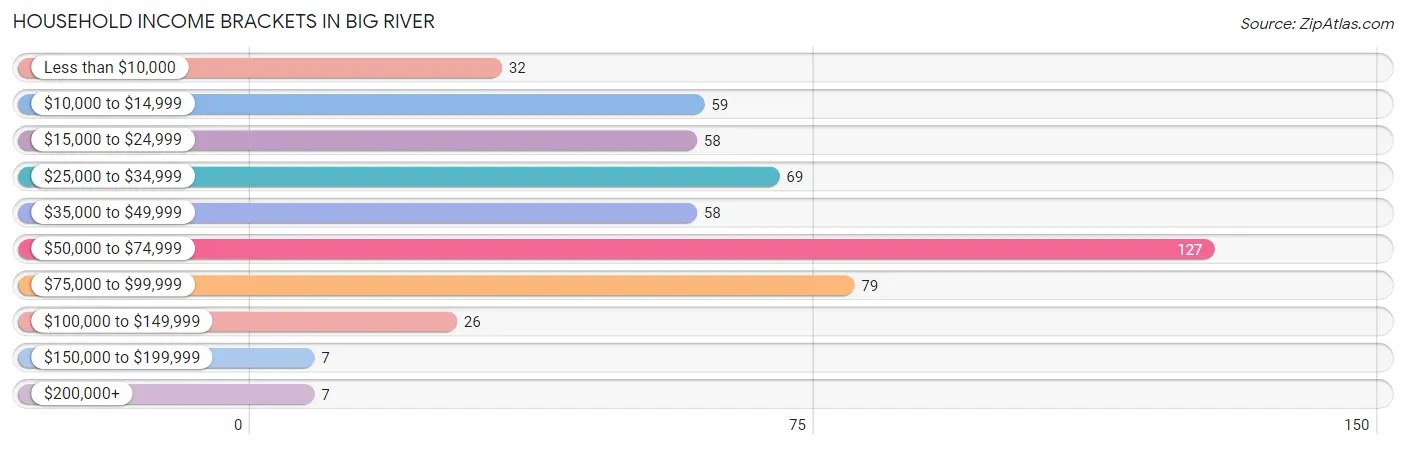
| Income Bracket | # Households | % Households |
| Less than $10,000 | 32 | 6.1% |
| $10,000 to $14,999 | 59 | 11.3% |
| $15,000 to $24,999 | 58 | 11.1% |
| $25,000 to $34,999 | 69 | 13.2% |
| $35,000 to $49,999 | 58 | 11.1% |
| $50,000 to $74,999 | 127 | 24.3% |
| $75,000 to $99,999 | 79 | 15.1% |
| $100,000 to $149,999 | 26 | 5.0% |
| $150,000 to $199,999 | 7 | 1.3% |
| $200,000+ | 7 | 1.3% |
Household Income by Householder Age in Big River
The median household income in Big River is $47,222, with the highest median household income of $68,646 found in the 25 to 44 years age bracket for the primary householder. A total of 55 households (10.5%) fall into this category. Meanwhile, the 15 to 24 years age bracket for the primary householder has the lowest median household income of $0, with 3 households (0.6%) in this group.
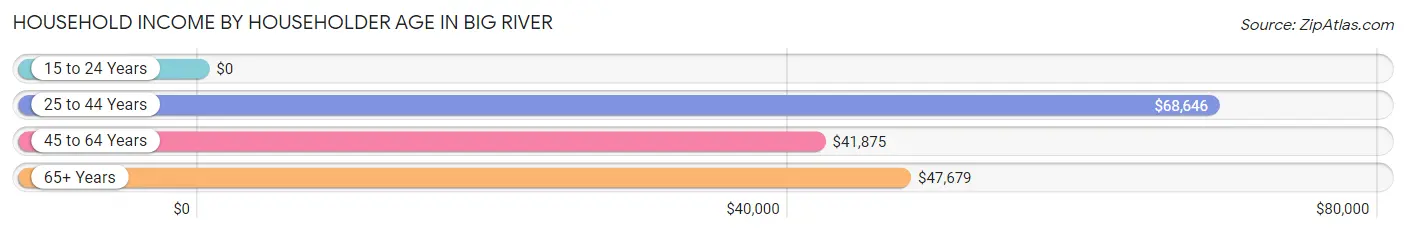
| Income Bracket | # Households | Median Income |
| 15 to 24 Years | 3 (0.6%) | $0 |
| 25 to 44 Years | 55 (10.5%) | $68,646 |
| 45 to 64 Years | 253 (48.5%) | $41,875 |
| 65+ Years | 211 (40.4%) | $47,679 |
| Total | 522 (100.0%) | $47,222 |
Poverty in Big River
Income Below Poverty by Sex and Age in Big River
With 13.8% poverty level for males and 21.0% for females among the residents of Big River, 55 to 64 year old males and 55 to 64 year old females are the most vulnerable to poverty, with 64 males (32.3%) and 57 females (39.6%) in their respective age groups living below the poverty level.
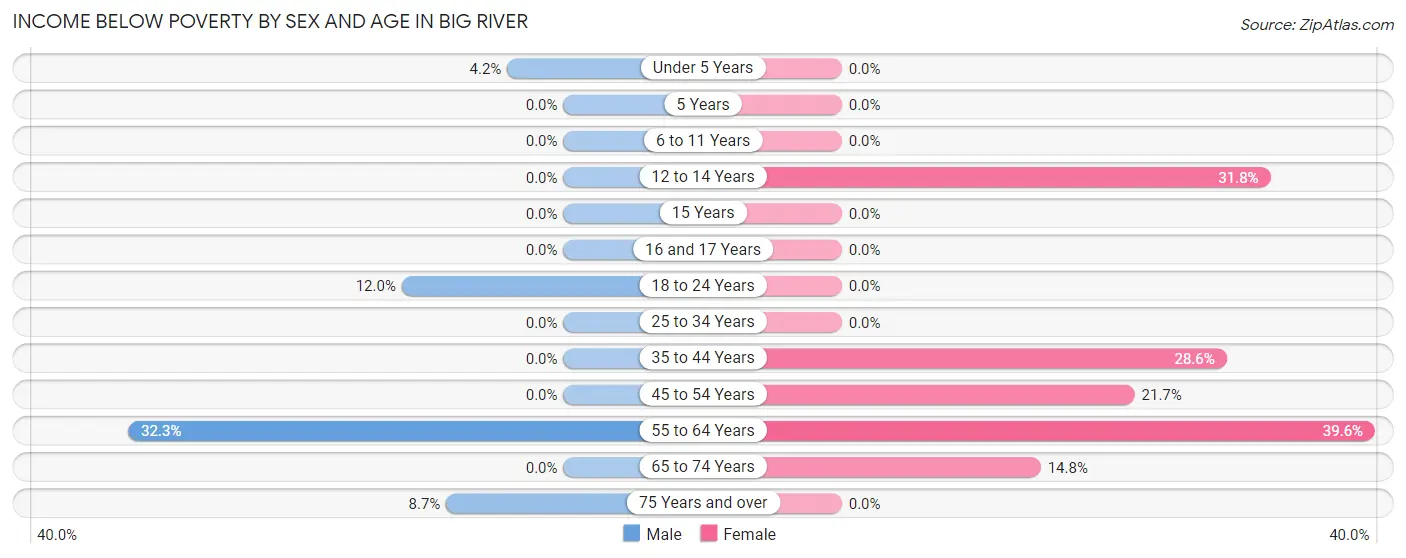
| Age Bracket | Male | Female |
| Under 5 Years | 1 (4.2%) | 0 (0.0%) |
| 5 Years | 0 (0.0%) | 0 (0.0%) |
| 6 to 11 Years | 0 (0.0%) | 0 (0.0%) |
| 12 to 14 Years | 0 (0.0%) | 7 (31.8%) |
| 15 Years | 0 (0.0%) | 0 (0.0%) |
| 16 and 17 Years | 0 (0.0%) | 0 (0.0%) |
| 18 to 24 Years | 3 (12.0%) | 0 (0.0%) |
| 25 to 34 Years | 0 (0.0%) | 0 (0.0%) |
| 35 to 44 Years | 0 (0.0%) | 8 (28.6%) |
| 45 to 54 Years | 0 (0.0%) | 15 (21.7%) |
| 55 to 64 Years | 64 (32.3%) | 57 (39.6%) |
| 65 to 74 Years | 0 (0.0%) | 13 (14.8%) |
| 75 Years and over | 8 (8.7%) | 0 (0.0%) |
| Total | 76 (13.8%) | 100 (21.0%) |
Income Above Poverty by Sex and Age in Big River
According to the poverty statistics in Big River, males aged 5 years and females aged under 5 years are the age groups that are most secure financially, with 100.0% of males and 100.0% of females in these age groups living above the poverty line.
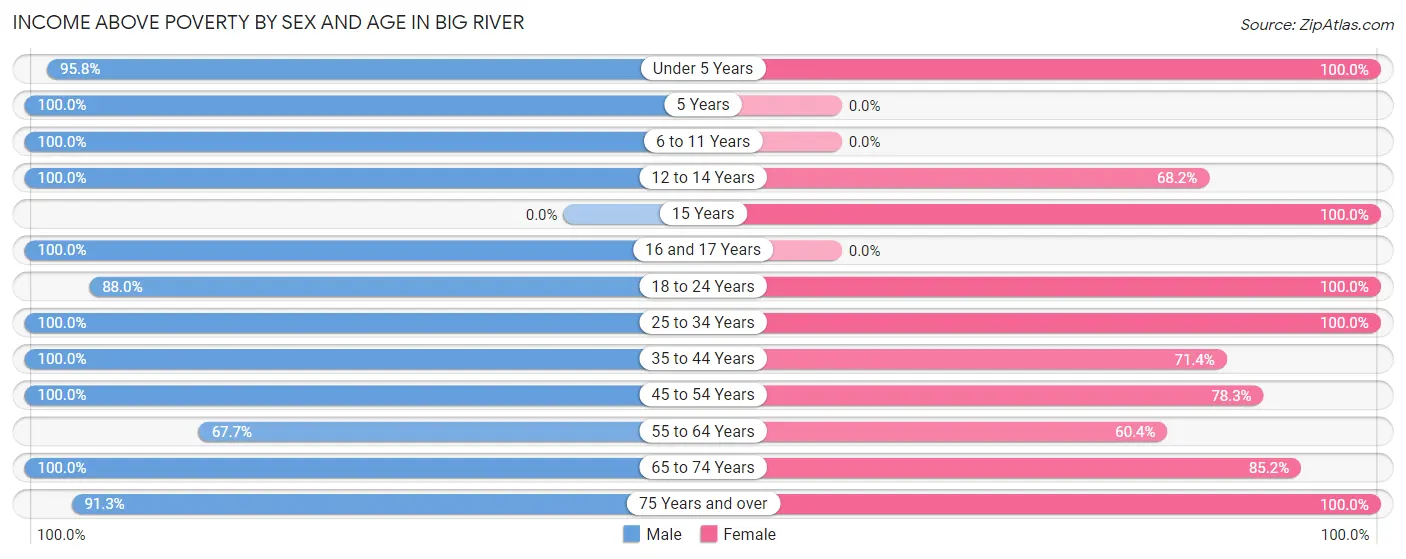
| Age Bracket | Male | Female |
| Under 5 Years | 23 (95.8%) | 9 (100.0%) |
| 5 Years | 9 (100.0%) | 0 (0.0%) |
| 6 to 11 Years | 13 (100.0%) | 0 (0.0%) |
| 12 to 14 Years | 49 (100.0%) | 15 (68.2%) |
| 15 Years | 0 (0.0%) | 8 (100.0%) |
| 16 and 17 Years | 7 (100.0%) | 0 (0.0%) |
| 18 to 24 Years | 22 (88.0%) | 11 (100.0%) |
| 25 to 34 Years | 15 (100.0%) | 21 (100.0%) |
| 35 to 44 Years | 34 (100.0%) | 20 (71.4%) |
| 45 to 54 Years | 21 (100.0%) | 54 (78.3%) |
| 55 to 64 Years | 134 (67.7%) | 87 (60.4%) |
| 65 to 74 Years | 65 (100.0%) | 75 (85.2%) |
| 75 Years and over | 84 (91.3%) | 76 (100.0%) |
| Total | 476 (86.2%) | 376 (79.0%) |
Income Below Poverty Among Married-Couple Families in Big River
The poverty statistics for married-couple families in Big River show that 11.0% or 21 of the total 191 families live below the poverty line. Families with no children have the highest poverty rate of 14.8%, comprising of 21 families. On the other hand, families with 1 or 2 children have the lowest poverty rate of 0.0%, which includes 0 families.
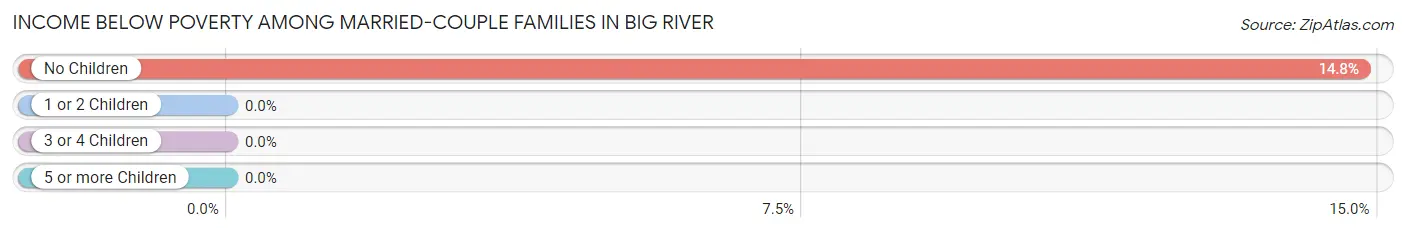
| Children | Above Poverty | Below Poverty |
| No Children | 121 (85.2%) | 21 (14.8%) |
| 1 or 2 Children | 42 (100.0%) | 0 (0.0%) |
| 3 or 4 Children | 7 (100.0%) | 0 (0.0%) |
| 5 or more Children | 0 (0.0%) | 0 (0.0%) |
| Total | 170 (89.0%) | 21 (11.0%) |
Income Below Poverty Among Single-Parent Households in Big River
According to the poverty data in Big River, 8.6% or 3 single-father households and 16.1% or 5 single-mother households are living below the poverty line. Among single-father households, those with 1 or 2 children have the highest poverty rate, with 3 households (20.0%) experiencing poverty. Likewise, among single-mother households, those with 1 or 2 children have the highest poverty rate, with 5 households (26.3%) falling below the poverty line.
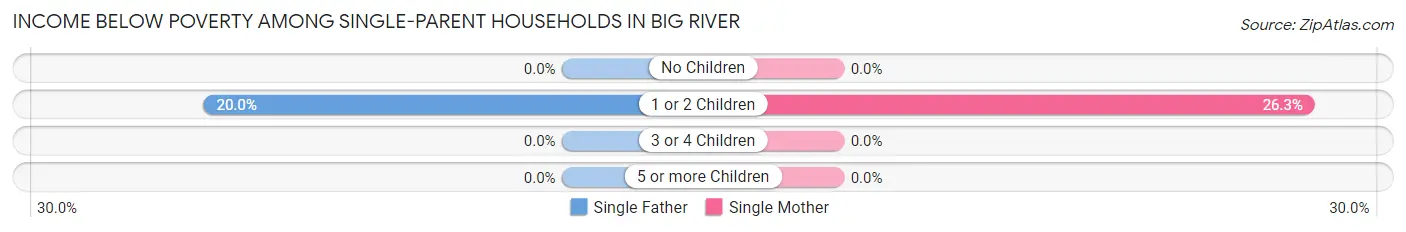
| Children | Single Father | Single Mother |
| No Children | 0 (0.0%) | 0 (0.0%) |
| 1 or 2 Children | 3 (20.0%) | 5 (26.3%) |
| 3 or 4 Children | 0 (0.0%) | 0 (0.0%) |
| 5 or more Children | 0 (0.0%) | 0 (0.0%) |
| Total | 3 (8.6%) | 5 (16.1%) |
Income Below Poverty Among Married-Couple vs Single-Parent Households in Big River
The poverty data for Big River shows that 21 of the married-couple family households (11.0%) and 8 of the single-parent households (12.1%) are living below the poverty level. Within the married-couple family households, those with no children have the highest poverty rate, with 21 households (14.8%) falling below the poverty line. Among the single-parent households, those with 1 or 2 children have the highest poverty rate, with 8 household (23.5%) living below poverty.
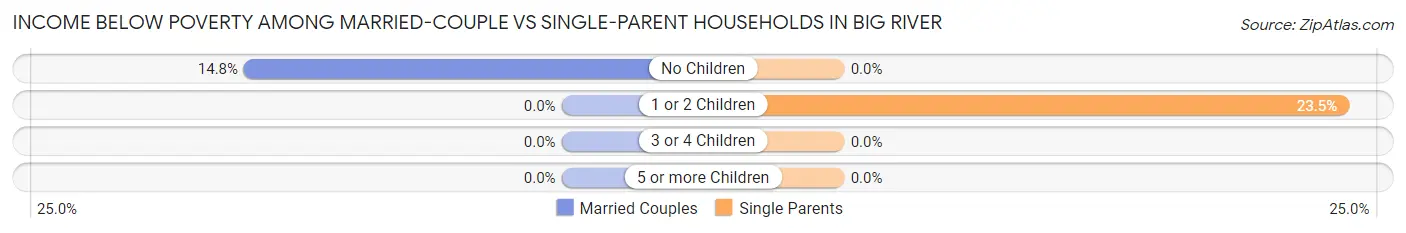
| Children | Married-Couple Families | Single-Parent Households |
| No Children | 21 (14.8%) | 0 (0.0%) |
| 1 or 2 Children | 0 (0.0%) | 8 (23.5%) |
| 3 or 4 Children | 0 (0.0%) | 0 (0.0%) |
| 5 or more Children | 0 (0.0%) | 0 (0.0%) |
| Total | 21 (11.0%) | 8 (12.1%) |
Race in Big River
The most populous races in Big River are White / Caucasian (901 | 87.6%), Hispanic or Latino (122 | 11.9%), and Two or more Races (85 | 8.3%).
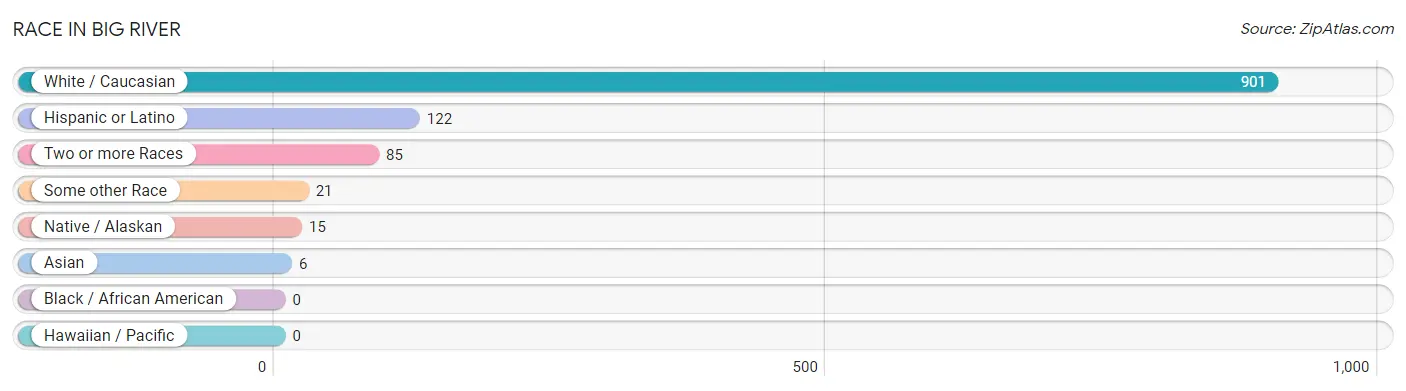
| Race | # Population | % Population |
| Asian | 6 | 0.6% |
| Black / African American | 0 | 0.0% |
| Hawaiian / Pacific | 0 | 0.0% |
| Hispanic or Latino | 122 | 11.9% |
| Native / Alaskan | 15 | 1.5% |
| White / Caucasian | 901 | 87.6% |
| Two or more Races | 85 | 8.3% |
| Some other Race | 21 | 2.0% |
| Total | 1,028 | 100.0% |
Ancestry in Big River
The most populous ancestries reported in Big River are Irish (219 | 21.3%), German (152 | 14.8%), English (104 | 10.1%), Mexican (98 | 9.5%), and Polish (60 | 5.8%), together accounting for 61.6% of all Big River residents.
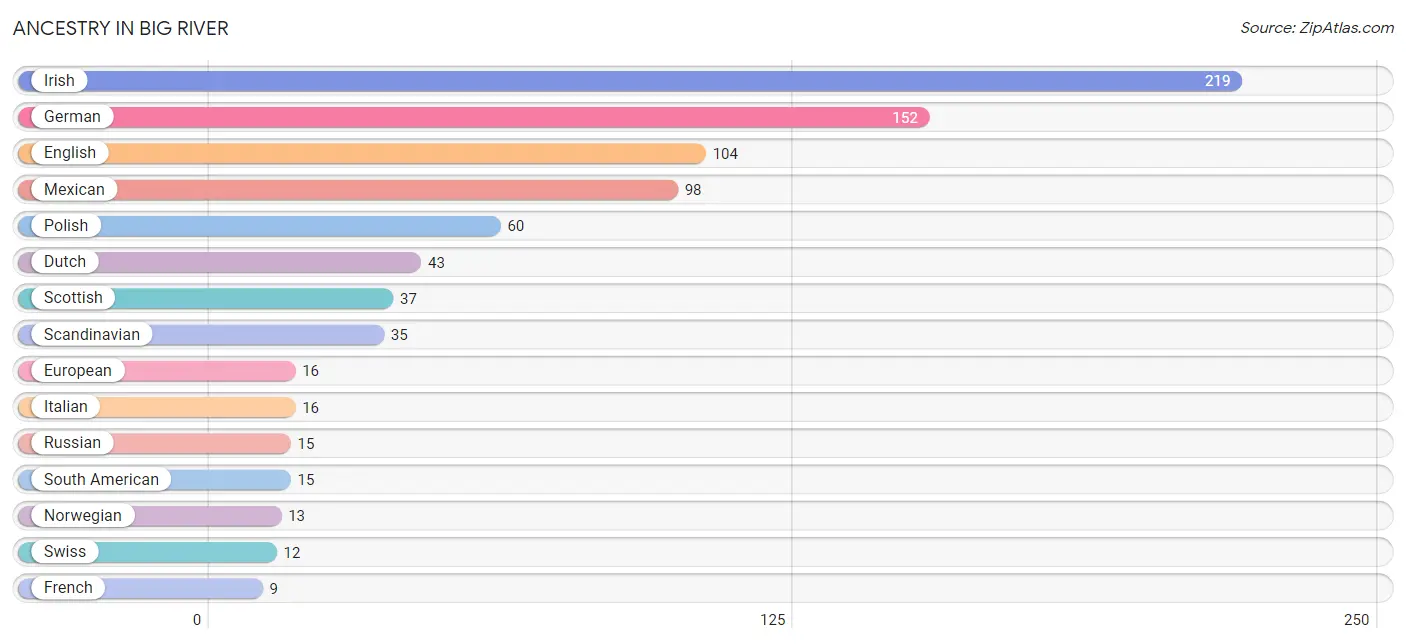
| Ancestry | # Population | % Population |
| American | 7 | 0.7% |
| Apache | 8 | 0.8% |
| Argentinean | 8 | 0.8% |
| Bolivian | 7 | 0.7% |
| British | 7 | 0.7% |
| Cherokee | 6 | 0.6% |
| Crow | 4 | 0.4% |
| Dutch | 43 | 4.2% |
| English | 104 | 10.1% |
| European | 16 | 1.6% |
| French | 9 | 0.9% |
| German | 152 | 14.8% |
| Irish | 219 | 21.3% |
| Italian | 16 | 1.6% |
| Korean | 4 | 0.4% |
| Mexican | 98 | 9.5% |
| Norwegian | 13 | 1.3% |
| Pakistani | 6 | 0.6% |
| Polish | 60 | 5.8% |
| Russian | 15 | 1.5% |
| Scandinavian | 35 | 3.4% |
| Scottish | 37 | 3.6% |
| South American | 15 | 1.5% |
| Spaniard | 8 | 0.8% |
| Swedish | 7 | 0.7% |
| Swiss | 12 | 1.2% |
| Welsh | 3 | 0.3% | View All 27 Rows |
Immigrants in Big River
The most numerous immigrant groups reported in Big River came from Latin America (35 | 3.4%), Central America (20 | 1.9%), Mexico (20 | 1.9%), South America (15 | 1.5%), and Europe (14 | 1.4%), together accounting for 10.1% of all Big River residents.
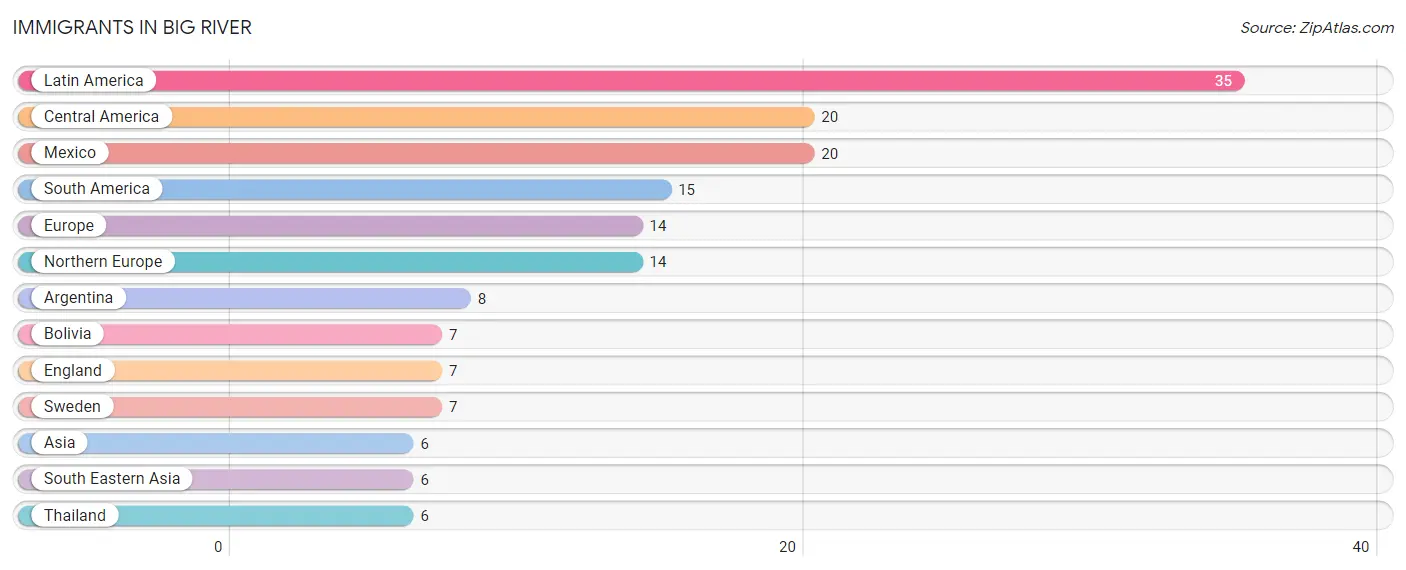
| Immigration Origin | # Population | % Population |
| Argentina | 8 | 0.8% |
| Asia | 6 | 0.6% |
| Bolivia | 7 | 0.7% |
| Central America | 20 | 1.9% |
| England | 7 | 0.7% |
| Europe | 14 | 1.4% |
| Latin America | 35 | 3.4% |
| Mexico | 20 | 1.9% |
| Northern Europe | 14 | 1.4% |
| South America | 15 | 1.5% |
| South Eastern Asia | 6 | 0.6% |
| Sweden | 7 | 0.7% |
| Thailand | 6 | 0.6% | View All 13 Rows |
Sex and Age in Big River
Sex and Age in Big River
The most populous age groups in Big River are 55 to 59 Years (125 | 22.6%) for men and 55 to 59 Years (86 | 18.1%) for women.
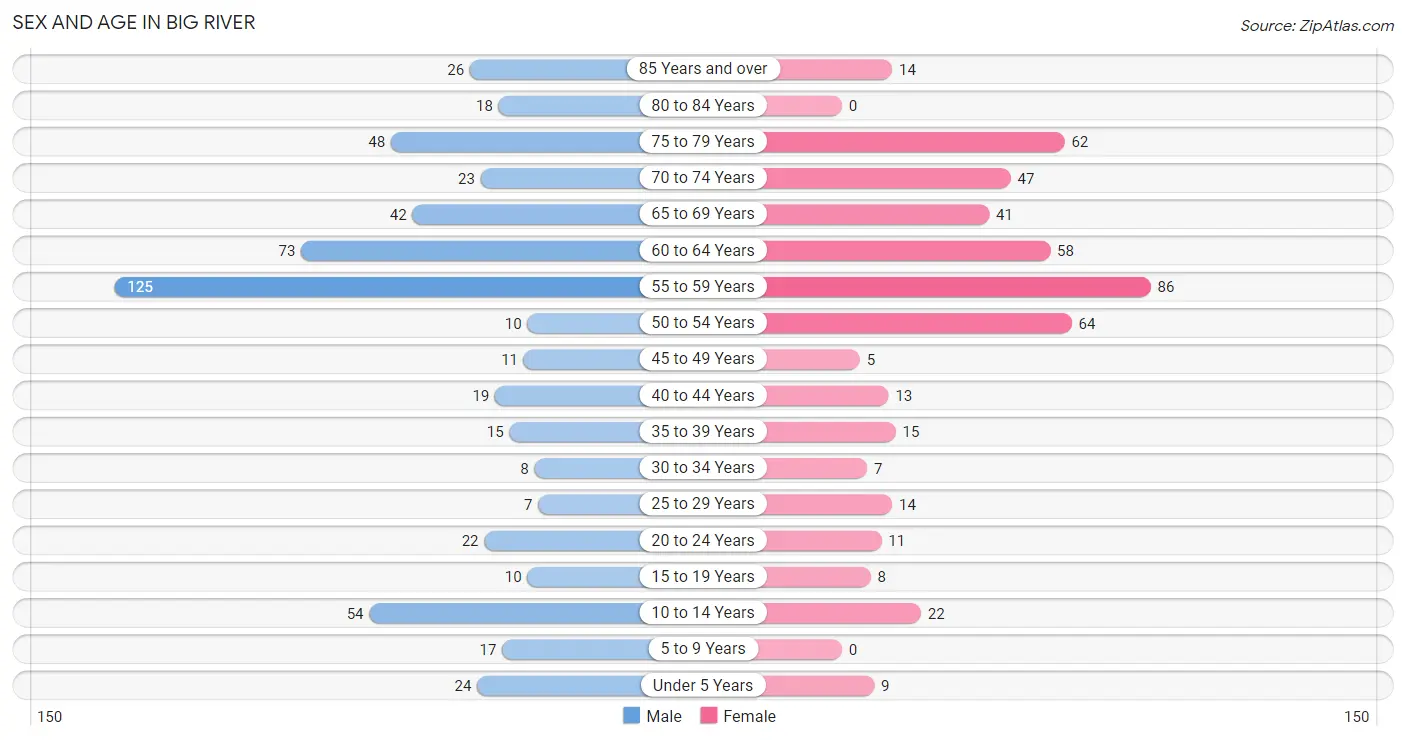
| Age Bracket | Male | Female |
| Under 5 Years | 24 (4.3%) | 9 (1.9%) |
| 5 to 9 Years | 17 (3.1%) | 0 (0.0%) |
| 10 to 14 Years | 54 (9.8%) | 22 (4.6%) |
| 15 to 19 Years | 10 (1.8%) | 8 (1.7%) |
| 20 to 24 Years | 22 (4.0%) | 11 (2.3%) |
| 25 to 29 Years | 7 (1.3%) | 14 (2.9%) |
| 30 to 34 Years | 8 (1.5%) | 7 (1.5%) |
| 35 to 39 Years | 15 (2.7%) | 15 (3.2%) |
| 40 to 44 Years | 19 (3.4%) | 13 (2.7%) |
| 45 to 49 Years | 11 (2.0%) | 5 (1.1%) |
| 50 to 54 Years | 10 (1.8%) | 64 (13.5%) |
| 55 to 59 Years | 125 (22.6%) | 86 (18.1%) |
| 60 to 64 Years | 73 (13.2%) | 58 (12.2%) |
| 65 to 69 Years | 42 (7.6%) | 41 (8.6%) |
| 70 to 74 Years | 23 (4.2%) | 47 (9.9%) |
| 75 to 79 Years | 48 (8.7%) | 62 (13.0%) |
| 80 to 84 Years | 18 (3.3%) | 0 (0.0%) |
| 85 Years and over | 26 (4.7%) | 14 (2.9%) |
| Total | 552 (100.0%) | 476 (100.0%) |
Families and Households in Big River
Median Family Size in Big River
The median family size in Big River is 2.62 persons per family, with married-couple families (191 | 74.3%) accounting for the largest median family size of 2.74 persons per family. On the other hand, single male/father families (35 | 13.6%) represent the smallest median family size with 1.91 persons per family.
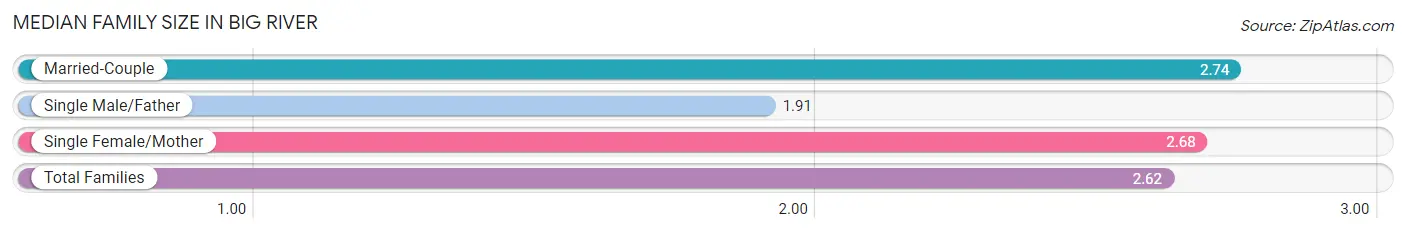
| Family Type | # Families | Family Size |
| Married-Couple | 191 (74.3%) | 2.74 |
| Single Male/Father | 35 (13.6%) | 1.91 |
| Single Female/Mother | 31 (12.1%) | 2.68 |
| Total Families | 257 (100.0%) | 2.62 |
Median Household Size in Big River
The median household size in Big River is 1.97 persons per household, with married-couple households (191 | 36.6%) accounting for the largest median household size of 2.77 persons per household. non-family households (265 | 50.8%) represent the smallest median household size with 1.31 persons per household.
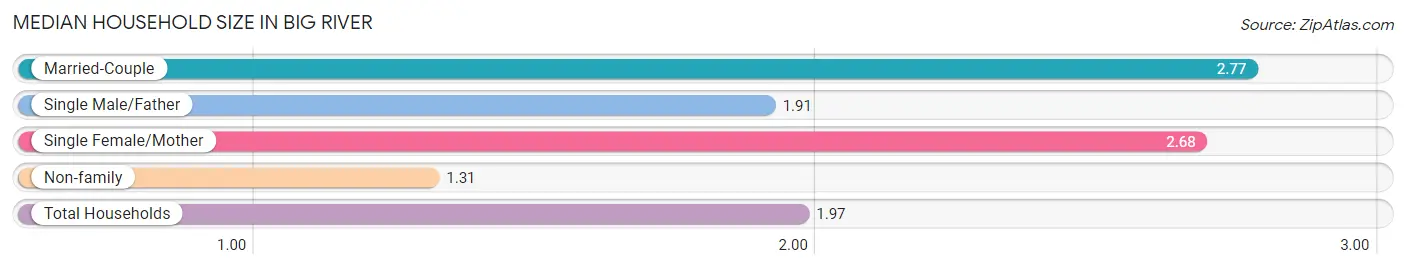
| Household Type | # Households | Household Size |
| Married-Couple | 191 (36.6%) | 2.77 |
| Single Male/Father | 35 (6.7%) | 1.91 |
| Single Female/Mother | 31 (5.9%) | 2.68 |
| Non-family | 265 (50.8%) | 1.31 |
| Total Households | 522 (100.0%) | 1.97 |
Household Size by Marriage Status in Big River
Out of a total of 522 households in Big River, 257 (49.2%) are family households, while 265 (50.8%) are nonfamily households. The most numerous type of family households are 2-person households, comprising 173, and the most common type of nonfamily households are 1-person households, comprising 196.
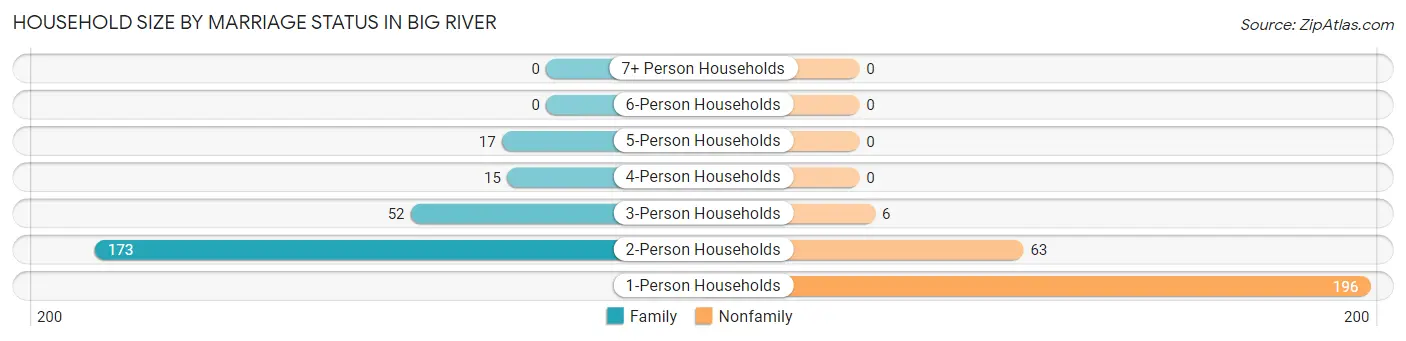
| Household Size | Family Households | Nonfamily Households |
| 1-Person Households | - | 196 (37.6%) |
| 2-Person Households | 173 (33.1%) | 63 (12.1%) |
| 3-Person Households | 52 (10.0%) | 6 (1.1%) |
| 4-Person Households | 15 (2.9%) | 0 (0.0%) |
| 5-Person Households | 17 (3.3%) | 0 (0.0%) |
| 6-Person Households | 0 (0.0%) | 0 (0.0%) |
| 7+ Person Households | 0 (0.0%) | 0 (0.0%) |
| Total | 257 (49.2%) | 265 (50.8%) |
Female Fertility in Big River
Fertility by Age in Big River
Average fertility rate in Big River is 71.0 births per 1,000 women. Women in the age bracket of 35 to 50 years have the highest fertility rate with 133.0 births per 1,000 women. Women in the age bracket of 35 to 50 years acount for 100.0% of all women with births.
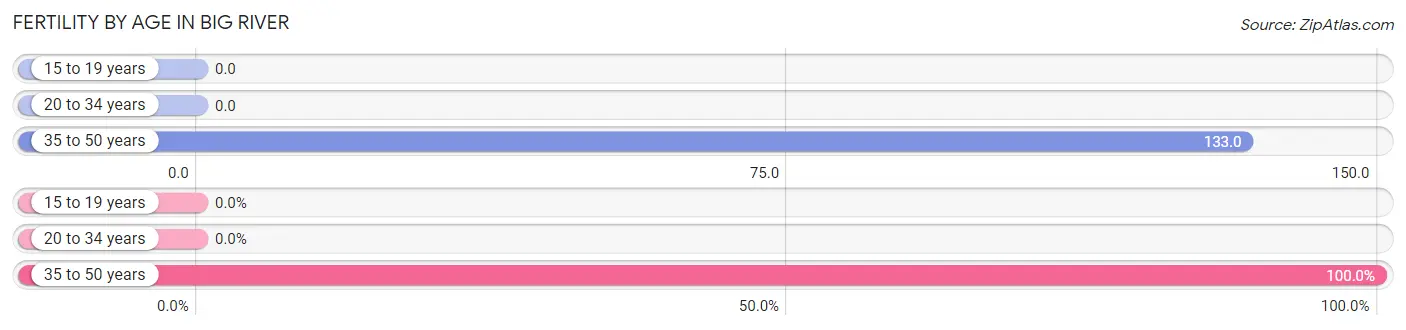
| Age Bracket | Women with Births | Births / 1,000 Women |
| 15 to 19 years | 0 (0.0%) | 0.0 |
| 20 to 34 years | 0 (0.0%) | 0.0 |
| 35 to 50 years | 6 (100.0%) | 133.0 |
| Total | 6 (100.0%) | 71.0 |
Fertility by Age by Marriage Status in Big River
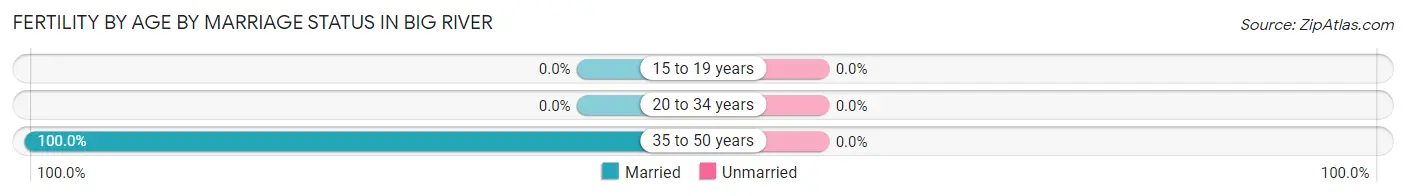
| Age Bracket | Married | Unmarried |
| 15 to 19 years | 0 (0.0%) | 0 (0.0%) |
| 20 to 34 years | 0 (0.0%) | 0 (0.0%) |
| 35 to 50 years | 6 (100.0%) | 0 (0.0%) |
| Total | 6 (100.0%) | 0 (0.0%) |
Fertility by Education in Big River
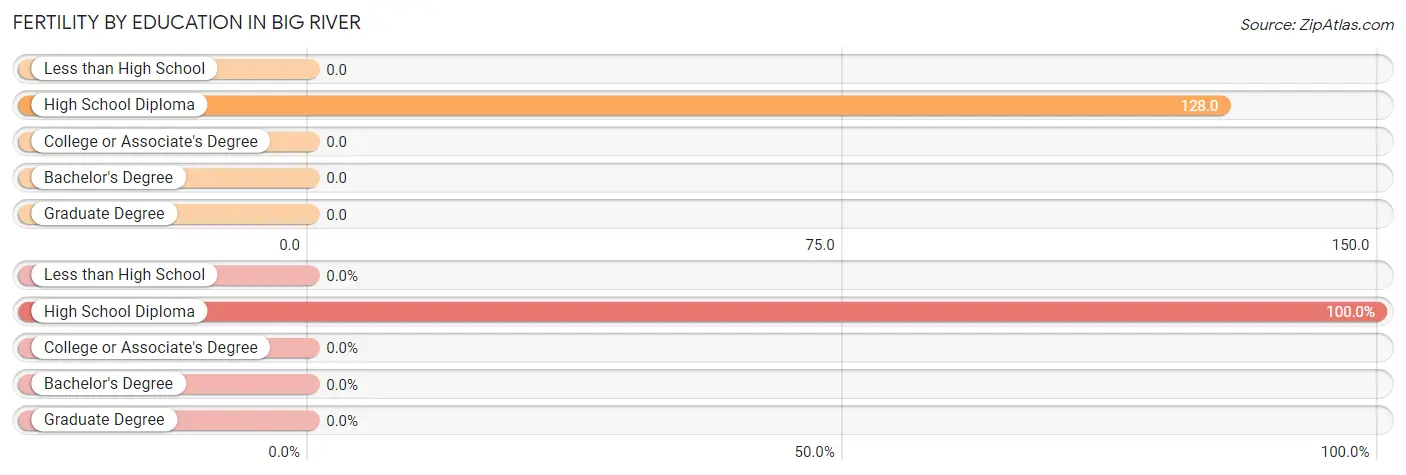
| Educational Attainment | Women with Births | Births / 1,000 Women |
| Less than High School | 0 (0.0%) | 0.0 |
| High School Diploma | 6 (100.0%) | 128.0 |
| College or Associate's Degree | 0 (0.0%) | 0.0 |
| Bachelor's Degree | 0 (0.0%) | 0.0 |
| Graduate Degree | 0 (0.0%) | 0.0 |
| Total | 6 (100.0%) | 71.0 |
Fertility by Education by Marriage Status in Big River
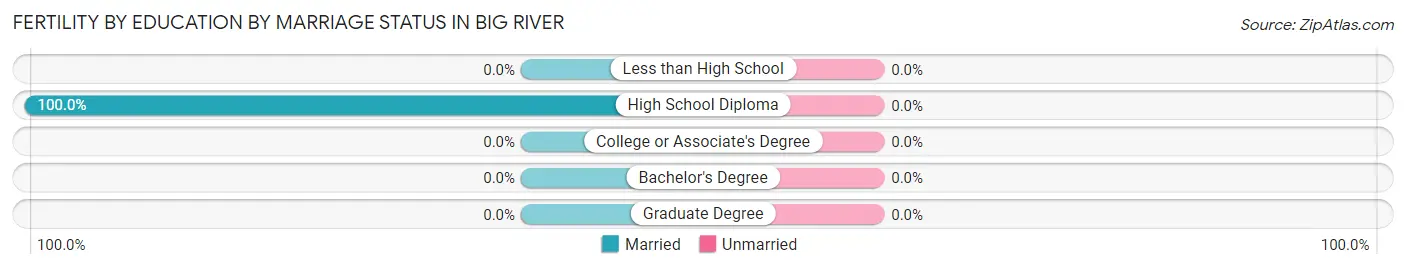
| Educational Attainment | Married | Unmarried |
| Less than High School | 0 (0.0%) | 0 (0.0%) |
| High School Diploma | 6 (100.0%) | 0 (0.0%) |
| College or Associate's Degree | 0 (0.0%) | 0 (0.0%) |
| Bachelor's Degree | 0 (0.0%) | 0 (0.0%) |
| Graduate Degree | 0 (0.0%) | 0 (0.0%) |
| Total | 6 (100.0%) | 0 (0.0%) |
Employment Characteristics in Big River
Employment by Class of Employer in Big River
Among the 344 employed individuals in Big River, private company employees (226 | 65.7%), self-employed (not incorporated) (51 | 14.8%), and not-for-profit organizations (39 | 11.3%) make up the most common classes of employment.
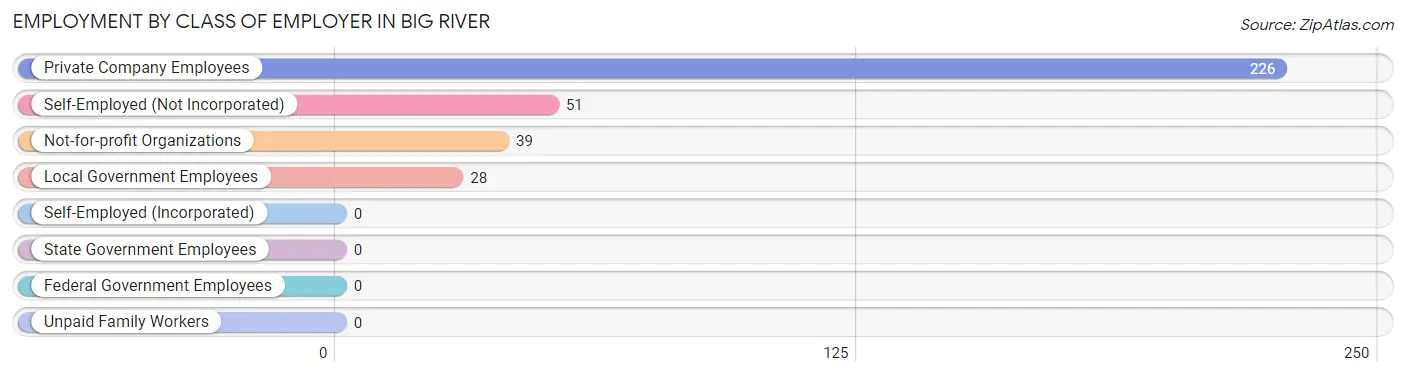
| Employer Class | # Employees | % Employees |
| Private Company Employees | 226 | 65.7% |
| Self-Employed (Incorporated) | 0 | 0.0% |
| Self-Employed (Not Incorporated) | 51 | 14.8% |
| Not-for-profit Organizations | 39 | 11.3% |
| Local Government Employees | 28 | 8.1% |
| State Government Employees | 0 | 0.0% |
| Federal Government Employees | 0 | 0.0% |
| Unpaid Family Workers | 0 | 0.0% |
| Total | 344 | 100.0% |
Employment Status by Age in Big River
According to the labor force statistics for Big River, out of the total population over 16 years of age (894), 43.4% or 388 individuals are in the labor force, with 11.3% or 44 of them unemployed. The age group with the highest labor force participation rate is 20 to 24 years, with 100.0% or 33 individuals in the labor force. Within the labor force, the 20 to 24 years age range has the highest percentage of unemployed individuals, with 24.2% or 8 of them being unemployed.
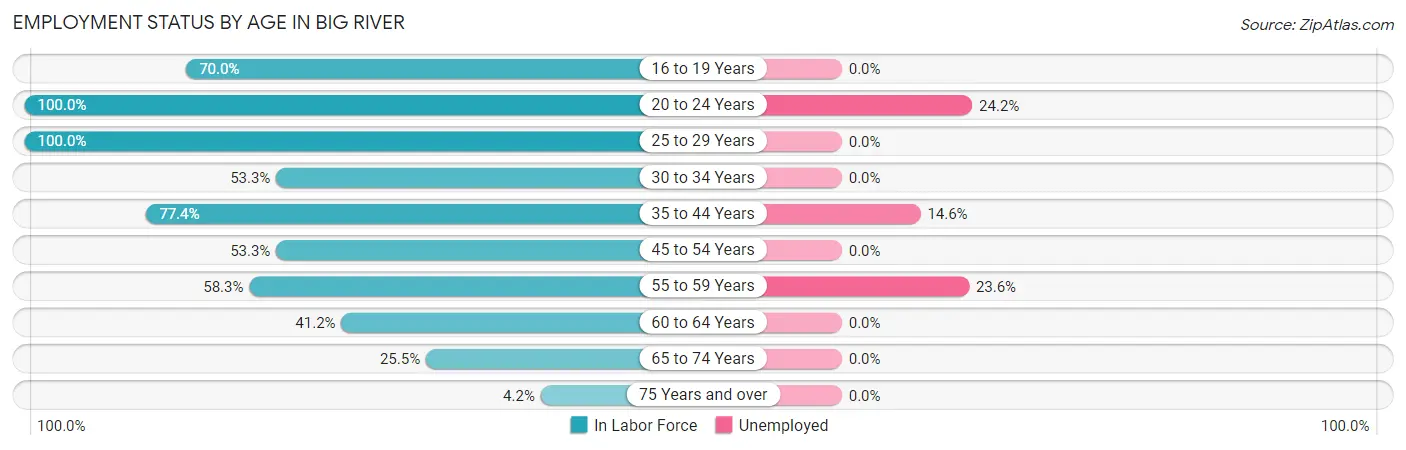
| Age Bracket | In Labor Force | Unemployed |
| 16 to 19 Years | 7 (70.0%) | 0 (0.0%) |
| 20 to 24 Years | 33 (100.0%) | 8 (24.2%) |
| 25 to 29 Years | 21 (100.0%) | 0 (0.0%) |
| 30 to 34 Years | 8 (53.3%) | 0 (0.0%) |
| 35 to 44 Years | 48 (77.4%) | 7 (14.6%) |
| 45 to 54 Years | 48 (53.3%) | 0 (0.0%) |
| 55 to 59 Years | 123 (58.3%) | 29 (23.6%) |
| 60 to 64 Years | 54 (41.2%) | 0 (0.0%) |
| 65 to 74 Years | 39 (25.5%) | 0 (0.0%) |
| 75 Years and over | 7 (4.2%) | 0 (0.0%) |
| Total | 388 (43.4%) | 44 (11.3%) |
Employment Status by Educational Attainment in Big River
According to labor force statistics for Big River, 57.0% of individuals (302) out of the total population between 25 and 64 years of age (530) are in the labor force, with 11.9% or 36 of them being unemployed. The group with the highest labor force participation rate are those with the educational attainment of college / associate degree, with 63.1% or 137 individuals in the labor force. Within the labor force, individuals with college / associate degree education have the highest percentage of unemployment, with 16.8% or 23 of them being unemployed.
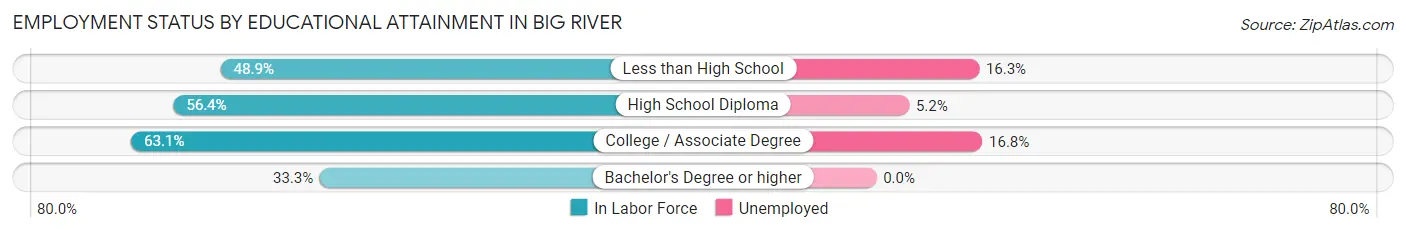
| Educational Attainment | In Labor Force | Unemployed |
| Less than High School | 43 (48.9%) | 14 (16.3%) |
| High School Diploma | 115 (56.4%) | 11 (5.2%) |
| College / Associate Degree | 137 (63.1%) | 36 (16.8%) |
| Bachelor's Degree or higher | 7 (33.3%) | 0 (0.0%) |
| Total | 302 (57.0%) | 63 (11.9%) |
Employment Occupations by Sex in Big River
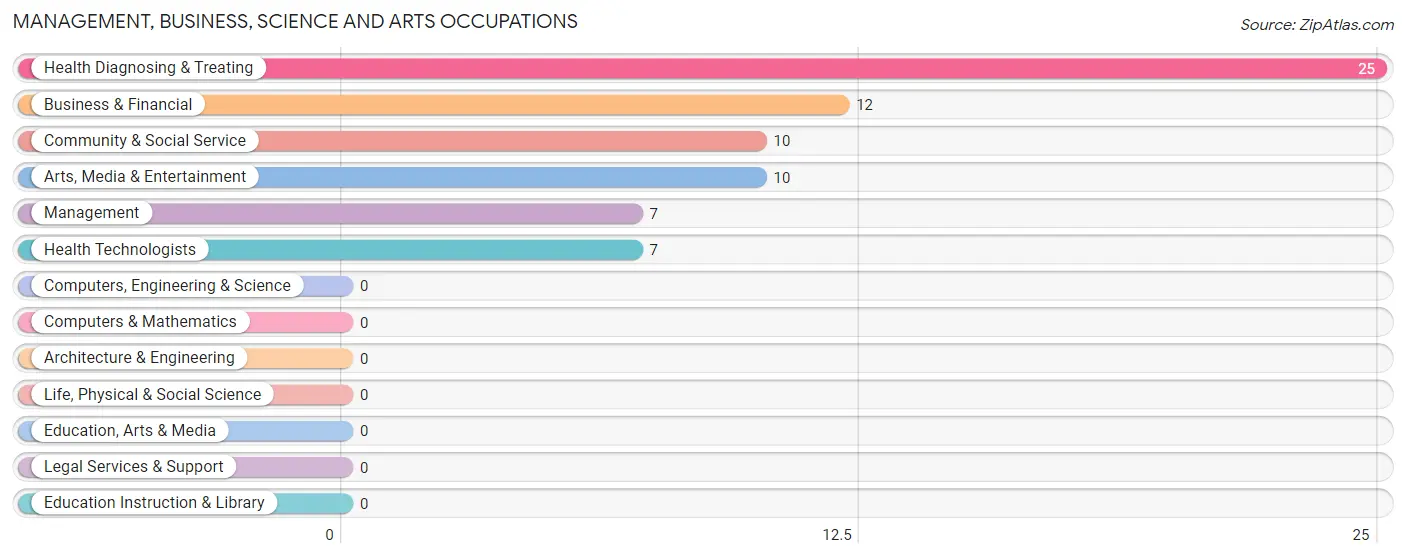
Management, Business, Science and Arts Occupations
The most common Management, Business, Science and Arts occupations in Big River are Health Diagnosing & Treating (25 | 7.3%), Business & Financial (12 | 3.5%), Community & Social Service (10 | 2.9%), Arts, Media & Entertainment (10 | 2.9%), and Management (7 | 2.0%).
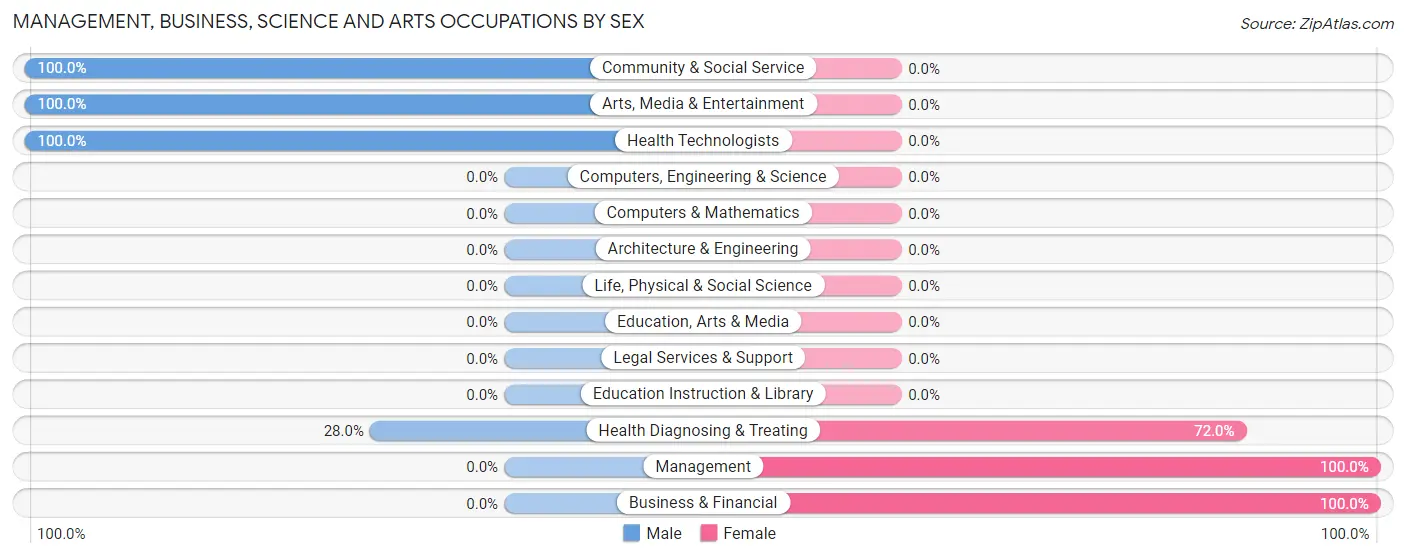
Management, Business, Science and Arts Occupations by Sex
Within the Management, Business, Science and Arts occupations in Big River, the most male-oriented occupations are Community & Social Service (100.0%), Arts, Media & Entertainment (100.0%), and Health Technologists (100.0%), while the most female-oriented occupations are Management (100.0%), Business & Financial (100.0%), and Health Diagnosing & Treating (72.0%).
| Occupation | Male | Female |
| Management | 0 (0.0%) | 7 (100.0%) |
| Business & Financial | 0 (0.0%) | 12 (100.0%) |
| Computers, Engineering & Science | 0 (0.0%) | 0 (0.0%) |
| Computers & Mathematics | 0 (0.0%) | 0 (0.0%) |
| Architecture & Engineering | 0 (0.0%) | 0 (0.0%) |
| Life, Physical & Social Science | 0 (0.0%) | 0 (0.0%) |
| Community & Social Service | 10 (100.0%) | 0 (0.0%) |
| Education, Arts & Media | 0 (0.0%) | 0 (0.0%) |
| Legal Services & Support | 0 (0.0%) | 0 (0.0%) |
| Education Instruction & Library | 0 (0.0%) | 0 (0.0%) |
| Arts, Media & Entertainment | 10 (100.0%) | 0 (0.0%) |
| Health Diagnosing & Treating | 7 (28.0%) | 18 (72.0%) |
| Health Technologists | 7 (100.0%) | 0 (0.0%) |
| Total (Category) | 17 (31.5%) | 37 (68.5%) |
| Total (Overall) | 167 (48.5%) | 177 (51.4%) |
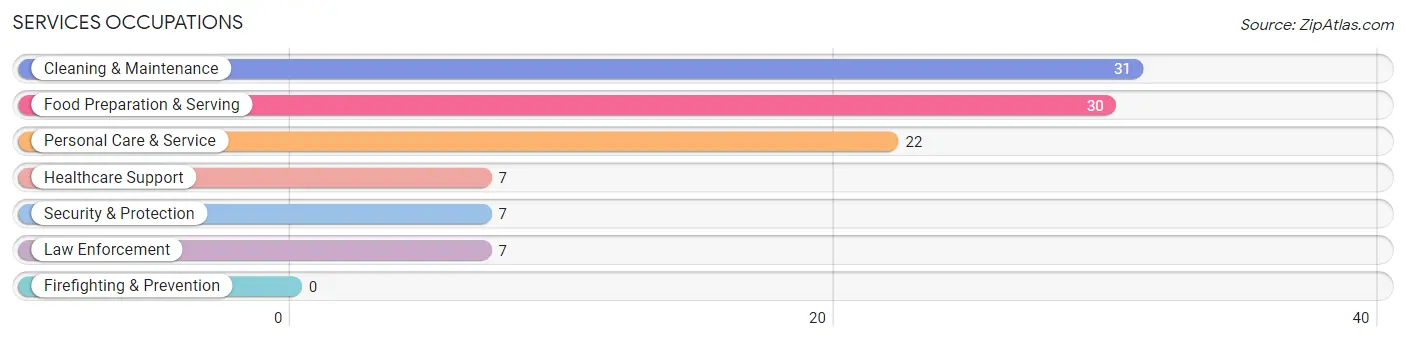
Services Occupations
The most common Services occupations in Big River are Cleaning & Maintenance (31 | 9.0%), Food Preparation & Serving (30 | 8.7%), Personal Care & Service (22 | 6.4%), Healthcare Support (7 | 2.0%), and Security & Protection (7 | 2.0%).
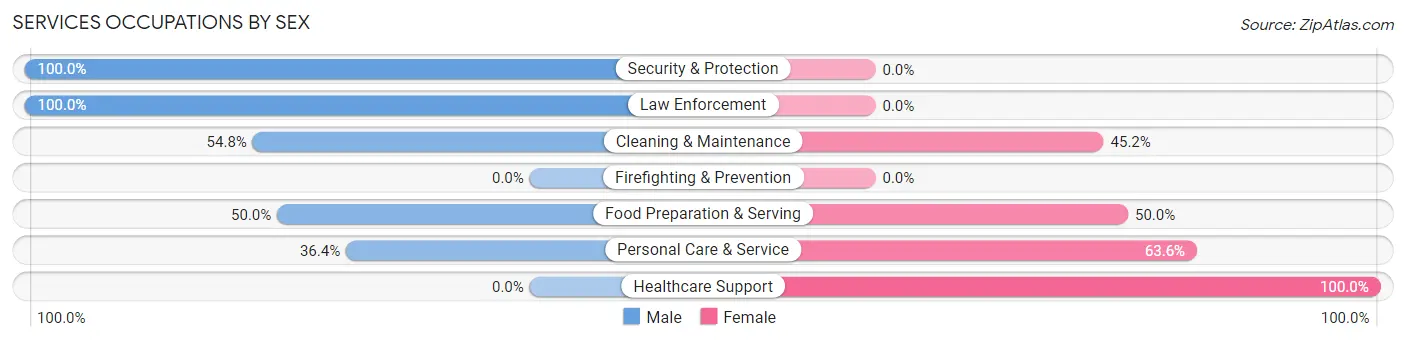
Services Occupations by Sex
Within the Services occupations in Big River, the most male-oriented occupations are Security & Protection (100.0%), Law Enforcement (100.0%), and Cleaning & Maintenance (54.8%), while the most female-oriented occupations are Healthcare Support (100.0%), Personal Care & Service (63.6%), and Food Preparation & Serving (50.0%).
| Occupation | Male | Female |
| Healthcare Support | 0 (0.0%) | 7 (100.0%) |
| Security & Protection | 7 (100.0%) | 0 (0.0%) |
| Firefighting & Prevention | 0 (0.0%) | 0 (0.0%) |
| Law Enforcement | 7 (100.0%) | 0 (0.0%) |
| Food Preparation & Serving | 15 (50.0%) | 15 (50.0%) |
| Cleaning & Maintenance | 17 (54.8%) | 14 (45.2%) |
| Personal Care & Service | 8 (36.4%) | 14 (63.6%) |
| Total (Category) | 47 (48.4%) | 50 (51.5%) |
| Total (Overall) | 167 (48.5%) | 177 (51.4%) |
Sales and Office Occupations
The most common Sales and Office occupations in Big River are Office & Administration (46 | 13.4%), and Sales & Related (44 | 12.8%).
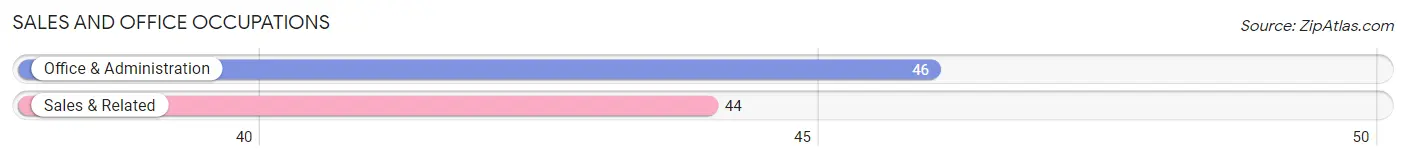
Sales and Office Occupations by Sex

| Occupation | Male | Female |
| Sales & Related | 21 (47.7%) | 23 (52.3%) |
| Office & Administration | 0 (0.0%) | 46 (100.0%) |
| Total (Category) | 21 (23.3%) | 69 (76.7%) |
| Total (Overall) | 167 (48.5%) | 177 (51.4%) |
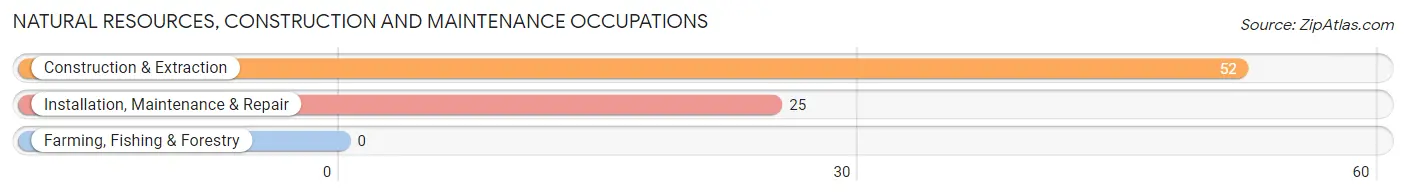
Natural Resources, Construction and Maintenance Occupations
The most common Natural Resources, Construction and Maintenance occupations in Big River are Construction & Extraction (52 | 15.1%), and Installation, Maintenance & Repair (25 | 7.3%).
Natural Resources, Construction and Maintenance Occupations by Sex
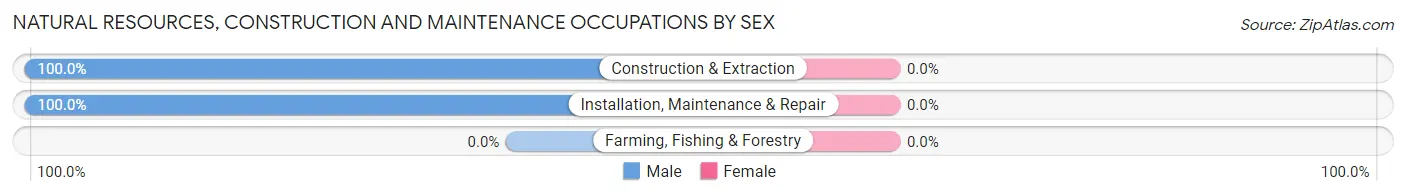
| Occupation | Male | Female |
| Farming, Fishing & Forestry | 0 (0.0%) | 0 (0.0%) |
| Construction & Extraction | 52 (100.0%) | 0 (0.0%) |
| Installation, Maintenance & Repair | 25 (100.0%) | 0 (0.0%) |
| Total (Category) | 77 (100.0%) | 0 (0.0%) |
| Total (Overall) | 167 (48.5%) | 177 (51.4%) |
Production, Transportation and Moving Occupations
The most common Production, Transportation and Moving occupations in Big River are Material Moving (12 | 3.5%), Production (8 | 2.3%), and Transportation (6 | 1.7%).
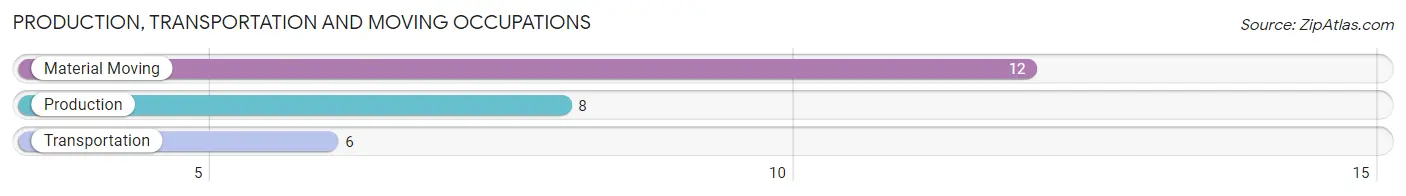
Production, Transportation and Moving Occupations by Sex
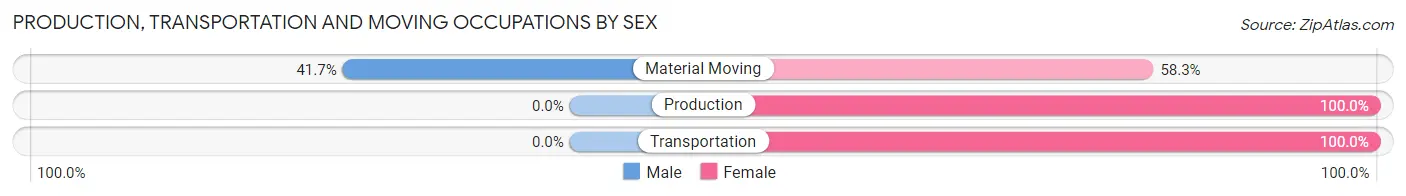
| Occupation | Male | Female |
| Production | 0 (0.0%) | 8 (100.0%) |
| Transportation | 0 (0.0%) | 6 (100.0%) |
| Material Moving | 5 (41.7%) | 7 (58.3%) |
| Total (Category) | 5 (19.2%) | 21 (80.8%) |
| Total (Overall) | 167 (48.5%) | 177 (51.4%) |
Employment Industries by Sex in Big River
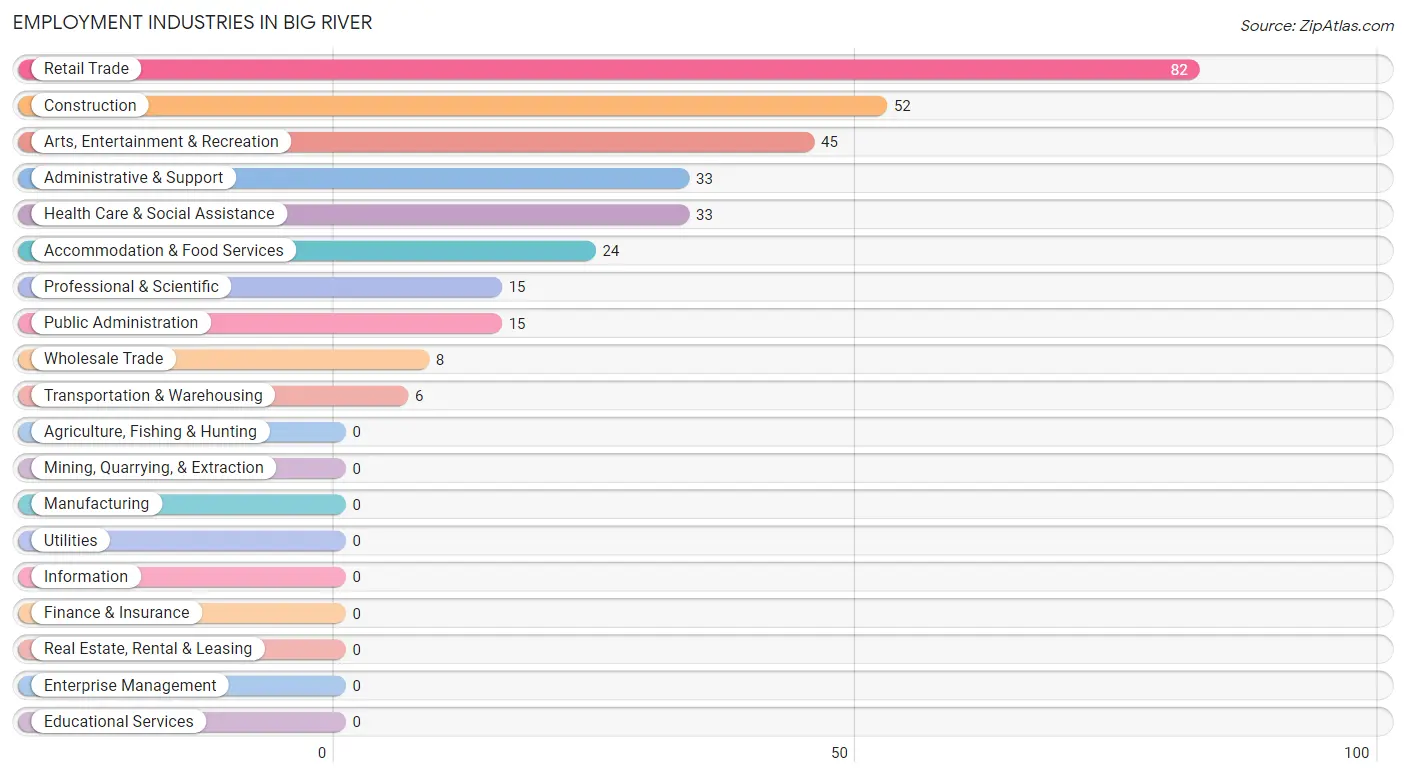
Employment Industries in Big River
The major employment industries in Big River include Retail Trade (82 | 23.8%), Construction (52 | 15.1%), Arts, Entertainment & Recreation (45 | 13.1%), Administrative & Support (33 | 9.6%), and Health Care & Social Assistance (33 | 9.6%).
Employment Industries by Sex in Big River
The Big River industries that see more men than women are Construction (100.0%), Arts, Entertainment & Recreation (84.4%), and Professional & Scientific (53.3%), whereas the industries that tend to have a higher number of women are Wholesale Trade (100.0%), Transportation & Warehousing (100.0%), and Administrative & Support (84.9%).
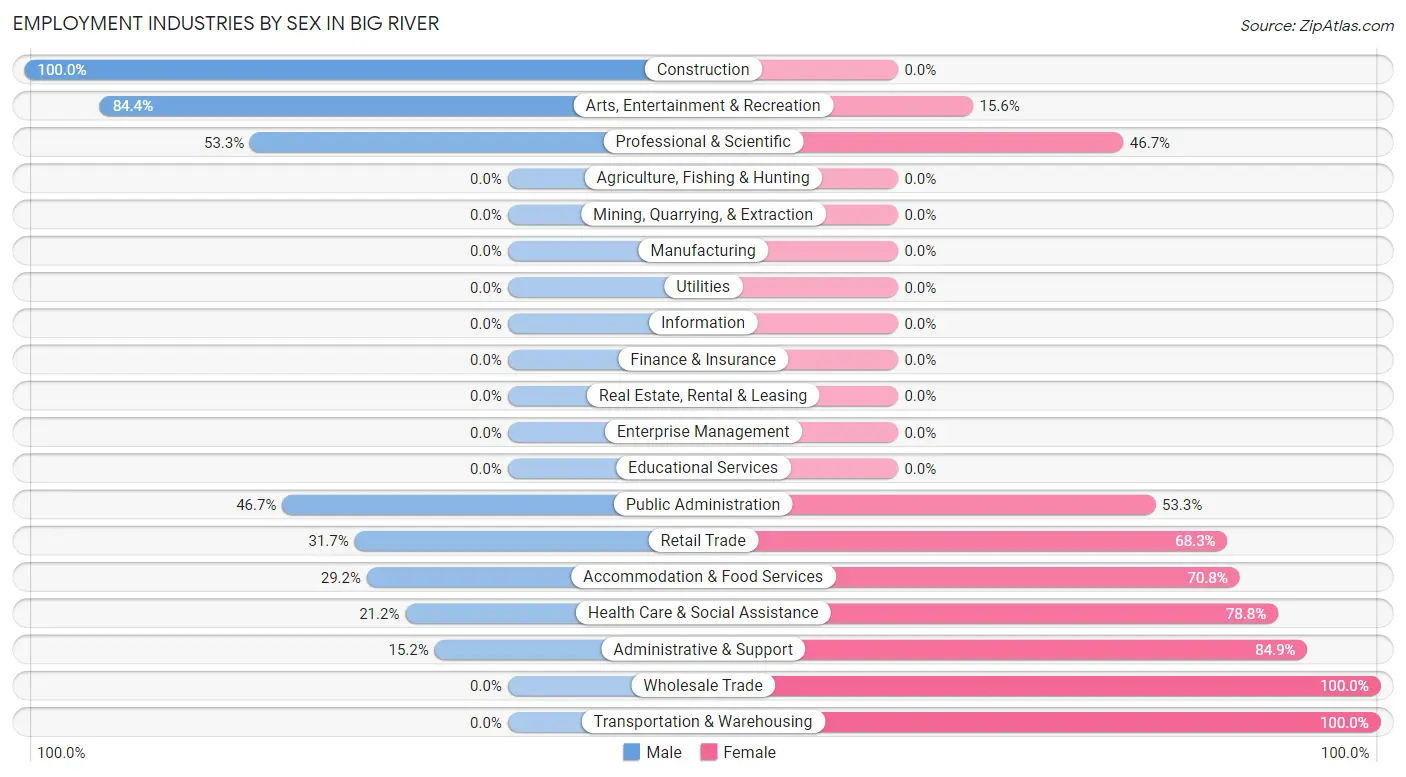
| Industry | Male | Female |
| Agriculture, Fishing & Hunting | 0 (0.0%) | 0 (0.0%) |
| Mining, Quarrying, & Extraction | 0 (0.0%) | 0 (0.0%) |
| Construction | 52 (100.0%) | 0 (0.0%) |
| Manufacturing | 0 (0.0%) | 0 (0.0%) |
| Wholesale Trade | 0 (0.0%) | 8 (100.0%) |
| Retail Trade | 26 (31.7%) | 56 (68.3%) |
| Transportation & Warehousing | 0 (0.0%) | 6 (100.0%) |
| Utilities | 0 (0.0%) | 0 (0.0%) |
| Information | 0 (0.0%) | 0 (0.0%) |
| Finance & Insurance | 0 (0.0%) | 0 (0.0%) |
| Real Estate, Rental & Leasing | 0 (0.0%) | 0 (0.0%) |
| Professional & Scientific | 8 (53.3%) | 7 (46.7%) |
| Enterprise Management | 0 (0.0%) | 0 (0.0%) |
| Administrative & Support | 5 (15.1%) | 28 (84.9%) |
| Educational Services | 0 (0.0%) | 0 (0.0%) |
| Health Care & Social Assistance | 7 (21.2%) | 26 (78.8%) |
| Arts, Entertainment & Recreation | 38 (84.4%) | 7 (15.6%) |
| Accommodation & Food Services | 7 (29.2%) | 17 (70.8%) |
| Public Administration | 7 (46.7%) | 8 (53.3%) |
| Total | 167 (48.5%) | 177 (51.4%) |
Education in Big River
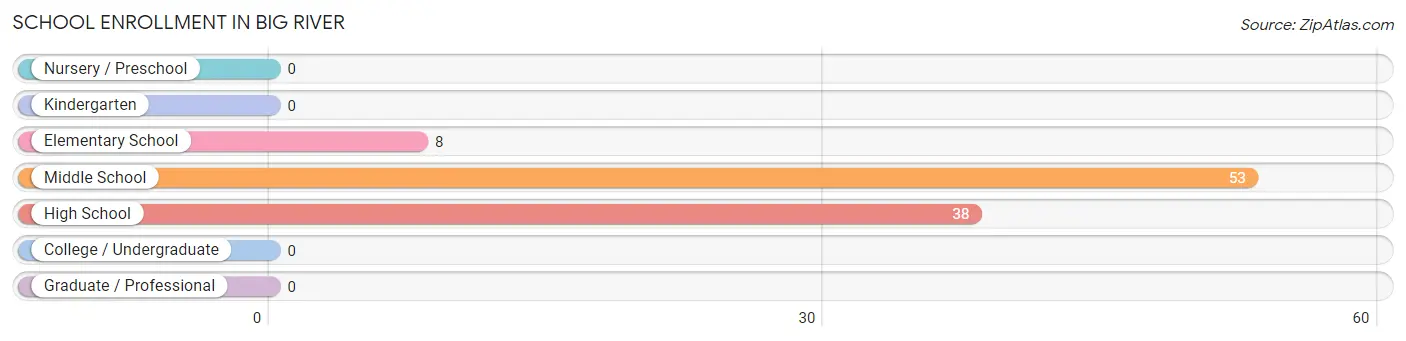
School Enrollment in Big River
The most common levels of schooling among the 99 students in Big River are middle school (53 | 53.5%), high school (38 | 38.4%), and elementary school (8 | 8.1%).
| School Level | # Students | % Students |
| Nursery / Preschool | 0 | 0.0% |
| Kindergarten | 0 | 0.0% |
| Elementary School | 8 | 8.1% |
| Middle School | 53 | 53.5% |
| High School | 38 | 38.4% |
| College / Undergraduate | 0 | 0.0% |
| Graduate / Professional | 0 | 0.0% |
| Total | 99 | 100.0% |
School Enrollment by Age by Funding Source in Big River
Out of a total of 99 students who are enrolled in schools in Big River, 8 (8.1%) attend a private institution, while the remaining 91 (91.9%) are enrolled in public schools. The age group of 15 to 17 year olds has the highest likelihood of being enrolled in private schools, with 8 (53.3% in the age bracket) enrolled. Conversely, the age group of 5 to 9 year old has the lowest likelihood of being enrolled in a private school, with 8 (100.0% in the age bracket) attending a public institution.
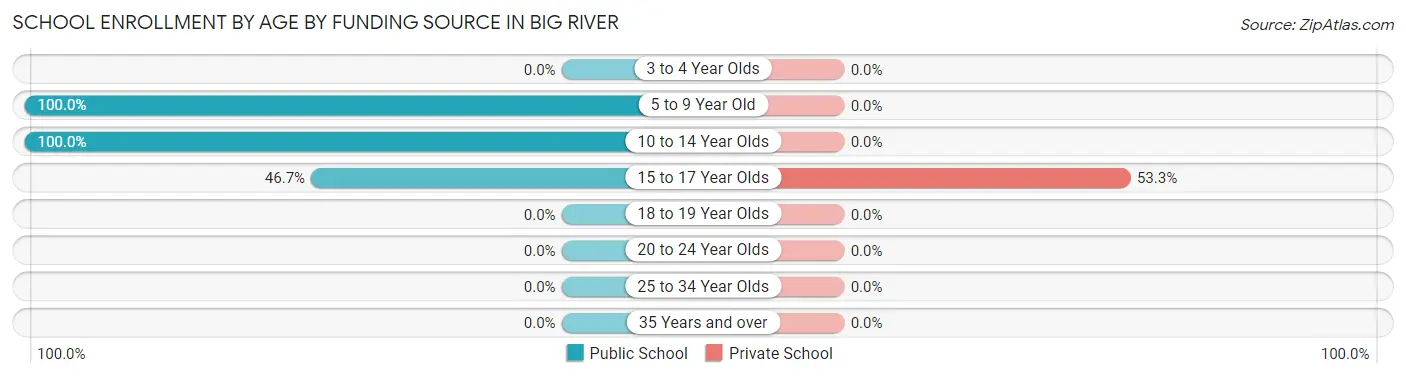
| Age Bracket | Public School | Private School |
| 3 to 4 Year Olds | 0 (0.0%) | 0 (0.0%) |
| 5 to 9 Year Old | 8 (100.0%) | 0 (0.0%) |
| 10 to 14 Year Olds | 76 (100.0%) | 0 (0.0%) |
| 15 to 17 Year Olds | 7 (46.7%) | 8 (53.3%) |
| 18 to 19 Year Olds | 0 (0.0%) | 0 (0.0%) |
| 20 to 24 Year Olds | 0 (0.0%) | 0 (0.0%) |
| 25 to 34 Year Olds | 0 (0.0%) | 0 (0.0%) |
| 35 Years and over | 0 (0.0%) | 0 (0.0%) |
| Total | 91 (91.9%) | 8 (8.1%) |
Educational Attainment by Field of Study in Big River
Business (11 | 25.6%), bio, nature & agricultural (8 | 18.6%), science & technology (7 | 16.3%), education (7 | 16.3%), and literature & languages (6 | 14.0%) are the most common fields of study among 43 individuals in Big River who have obtained a bachelor's degree or higher.
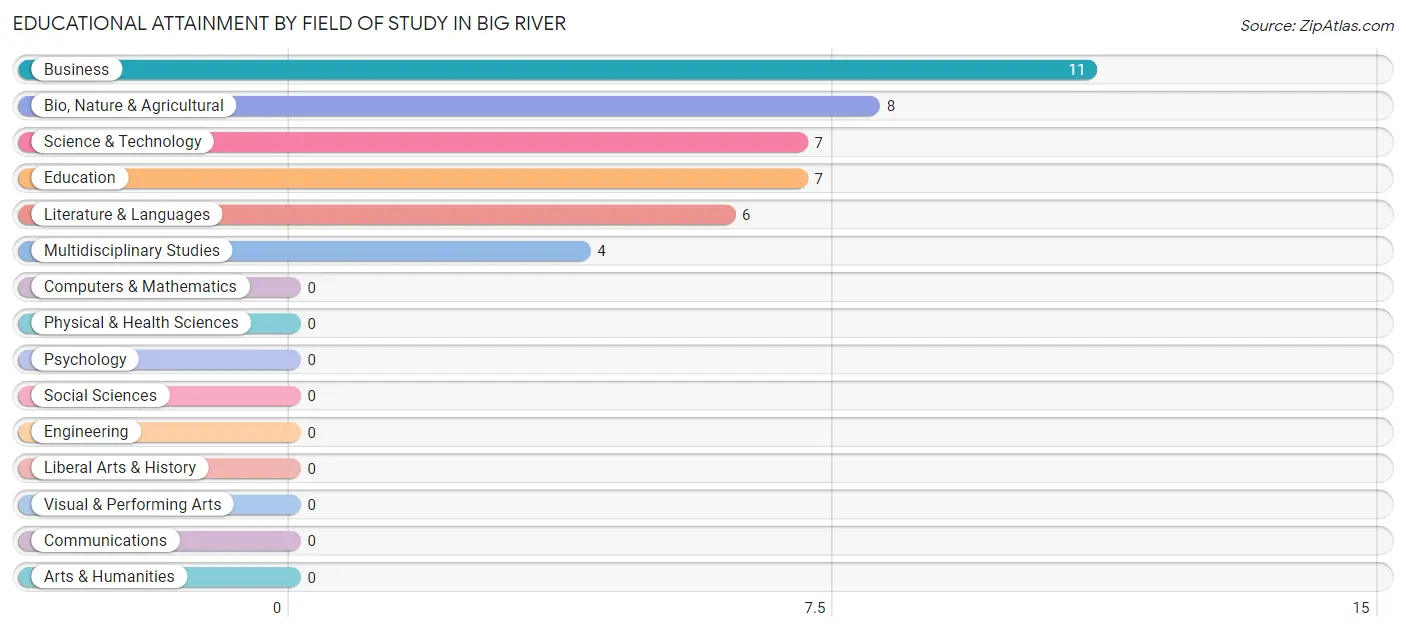
| Field of Study | # Graduates | % Graduates |
| Computers & Mathematics | 0 | 0.0% |
| Bio, Nature & Agricultural | 8 | 18.6% |
| Physical & Health Sciences | 0 | 0.0% |
| Psychology | 0 | 0.0% |
| Social Sciences | 0 | 0.0% |
| Engineering | 0 | 0.0% |
| Multidisciplinary Studies | 4 | 9.3% |
| Science & Technology | 7 | 16.3% |
| Business | 11 | 25.6% |
| Education | 7 | 16.3% |
| Literature & Languages | 6 | 14.0% |
| Liberal Arts & History | 0 | 0.0% |
| Visual & Performing Arts | 0 | 0.0% |
| Communications | 0 | 0.0% |
| Arts & Humanities | 0 | 0.0% |
| Total | 43 | 100.0% |
Transportation & Commute in Big River
Vehicle Availability by Sex in Big River
The most prevalent vehicle ownership categories in Big River are males with 2 vehicles (113, accounting for 67.7%) and females with 2 vehicles (76, making up 63.8%).
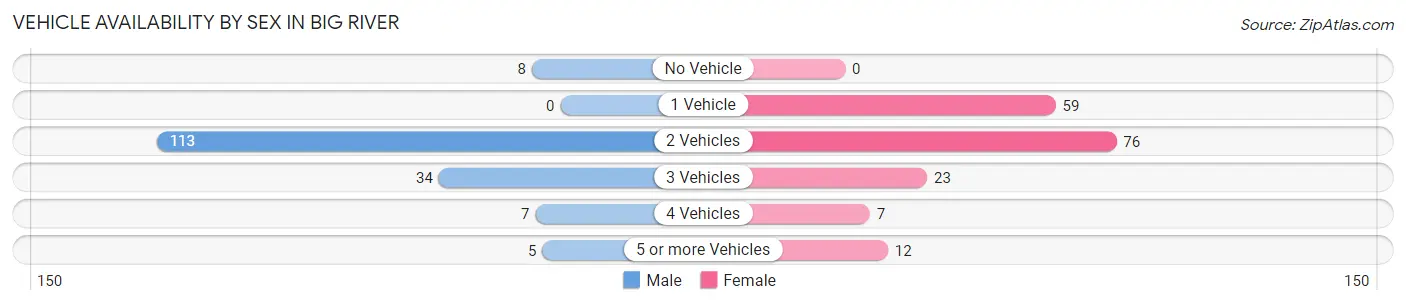
| Vehicles Available | Male | Female |
| No Vehicle | 8 (4.8%) | 0 (0.0%) |
| 1 Vehicle | 0 (0.0%) | 59 (33.3%) |
| 2 Vehicles | 113 (67.7%) | 76 (42.9%) |
| 3 Vehicles | 34 (20.4%) | 23 (13.0%) |
| 4 Vehicles | 7 (4.2%) | 7 (4.0%) |
| 5 or more Vehicles | 5 (3.0%) | 12 (6.8%) |
| Total | 167 (100.0%) | 177 (100.0%) |
Commute Time in Big River
The most frequently occuring commute durations in Big River are 15 to 19 minutes (99 commuters, 30.3%), 20 to 24 minutes (60 commuters, 18.3%), and 5 to 9 minutes (45 commuters, 13.8%).
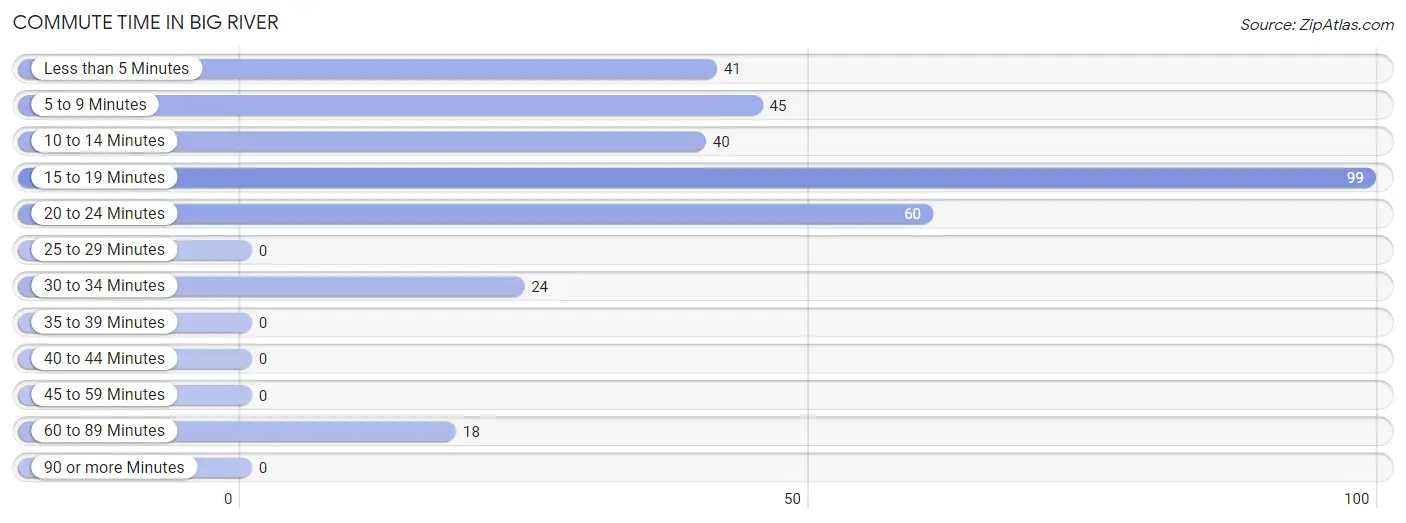
| Commute Time | # Commuters | % Commuters |
| Less than 5 Minutes | 41 | 12.5% |
| 5 to 9 Minutes | 45 | 13.8% |
| 10 to 14 Minutes | 40 | 12.2% |
| 15 to 19 Minutes | 99 | 30.3% |
| 20 to 24 Minutes | 60 | 18.3% |
| 25 to 29 Minutes | 0 | 0.0% |
| 30 to 34 Minutes | 24 | 7.3% |
| 35 to 39 Minutes | 0 | 0.0% |
| 40 to 44 Minutes | 0 | 0.0% |
| 45 to 59 Minutes | 0 | 0.0% |
| 60 to 89 Minutes | 18 | 5.5% |
| 90 or more Minutes | 0 | 0.0% |
Commute Time by Sex in Big River
The most common commute times in Big River are 15 to 19 minutes (61 commuters, 36.5%) for males and 15 to 19 minutes (38 commuters, 23.7%) for females.
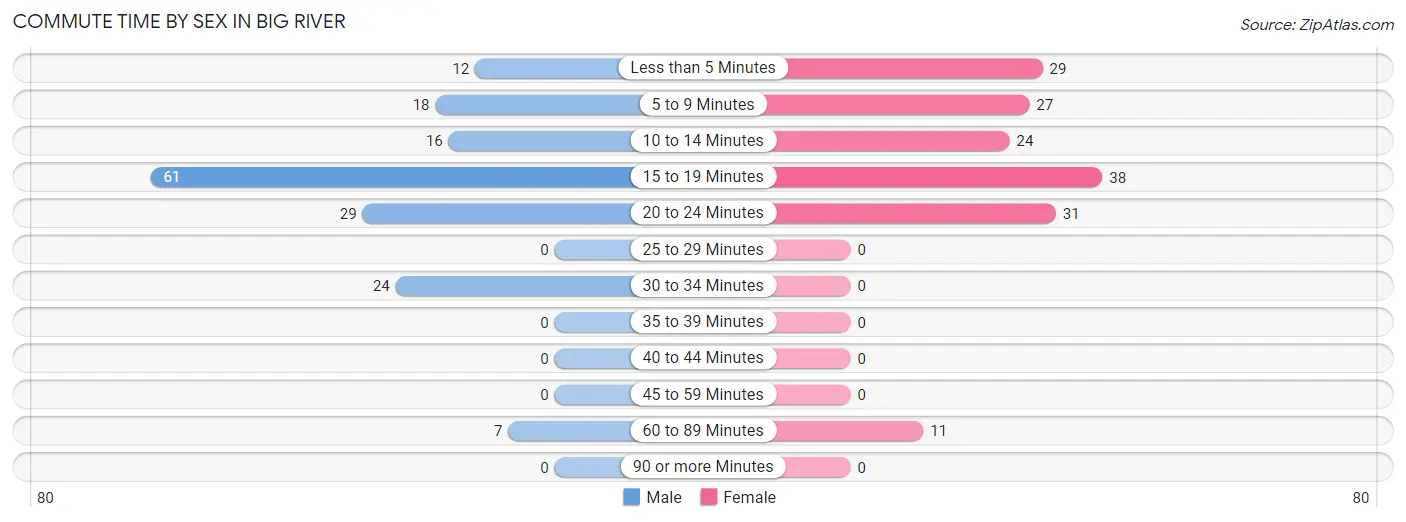
| Commute Time | Male | Female |
| Less than 5 Minutes | 12 (7.2%) | 29 (18.1%) |
| 5 to 9 Minutes | 18 (10.8%) | 27 (16.9%) |
| 10 to 14 Minutes | 16 (9.6%) | 24 (15.0%) |
| 15 to 19 Minutes | 61 (36.5%) | 38 (23.7%) |
| 20 to 24 Minutes | 29 (17.4%) | 31 (19.4%) |
| 25 to 29 Minutes | 0 (0.0%) | 0 (0.0%) |
| 30 to 34 Minutes | 24 (14.4%) | 0 (0.0%) |
| 35 to 39 Minutes | 0 (0.0%) | 0 (0.0%) |
| 40 to 44 Minutes | 0 (0.0%) | 0 (0.0%) |
| 45 to 59 Minutes | 0 (0.0%) | 0 (0.0%) |
| 60 to 89 Minutes | 7 (4.2%) | 11 (6.9%) |
| 90 or more Minutes | 0 (0.0%) | 0 (0.0%) |
Time of Departure to Work by Sex in Big River
The most frequent times of departure to work in Big River are 6:30 AM to 6:59 AM (42, 25.2%) for males and 9:00 AM to 9:59 AM (29, 18.1%) for females.
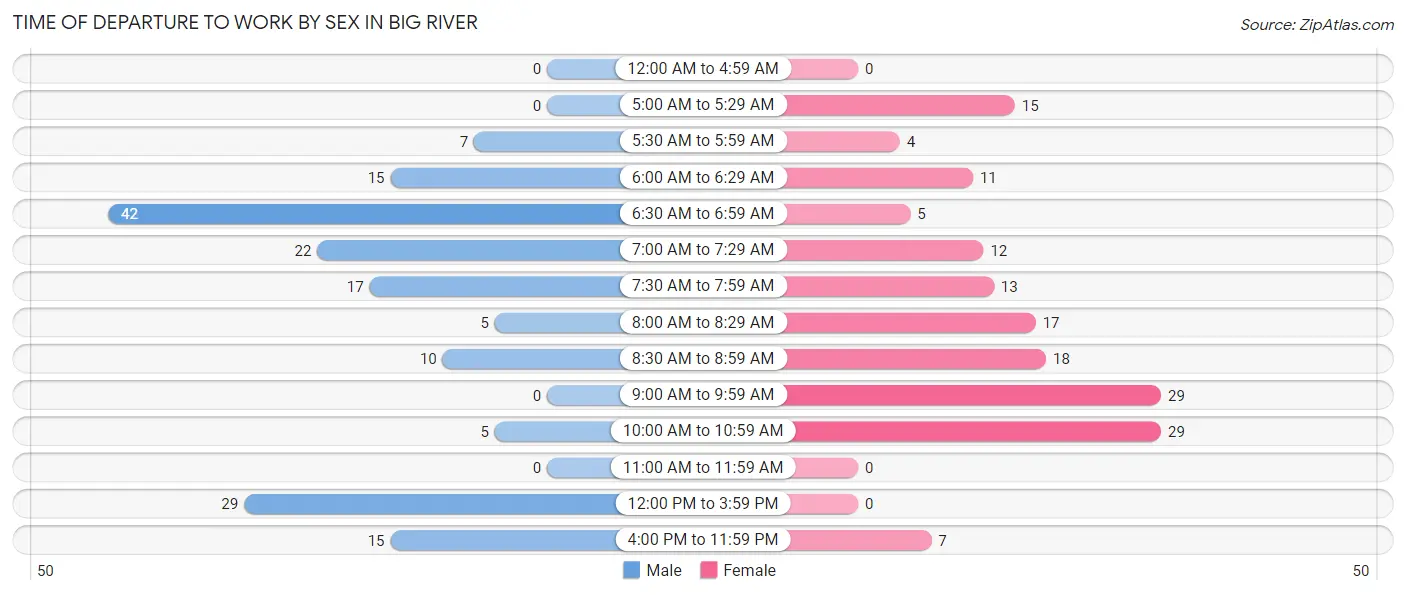
| Time of Departure | Male | Female |
| 12:00 AM to 4:59 AM | 0 (0.0%) | 0 (0.0%) |
| 5:00 AM to 5:29 AM | 0 (0.0%) | 15 (9.4%) |
| 5:30 AM to 5:59 AM | 7 (4.2%) | 4 (2.5%) |
| 6:00 AM to 6:29 AM | 15 (9.0%) | 11 (6.9%) |
| 6:30 AM to 6:59 AM | 42 (25.2%) | 5 (3.1%) |
| 7:00 AM to 7:29 AM | 22 (13.2%) | 12 (7.5%) |
| 7:30 AM to 7:59 AM | 17 (10.2%) | 13 (8.1%) |
| 8:00 AM to 8:29 AM | 5 (3.0%) | 17 (10.6%) |
| 8:30 AM to 8:59 AM | 10 (6.0%) | 18 (11.3%) |
| 9:00 AM to 9:59 AM | 0 (0.0%) | 29 (18.1%) |
| 10:00 AM to 10:59 AM | 5 (3.0%) | 29 (18.1%) |
| 11:00 AM to 11:59 AM | 0 (0.0%) | 0 (0.0%) |
| 12:00 PM to 3:59 PM | 29 (17.4%) | 0 (0.0%) |
| 4:00 PM to 11:59 PM | 15 (9.0%) | 7 (4.4%) |
| Total | 167 (100.0%) | 160 (100.0%) |
Housing Occupancy in Big River
Occupancy by Ownership in Big River
Of the total 522 dwellings in Big River, owner-occupied units account for 422 (80.8%), while renter-occupied units make up 100 (19.2%).
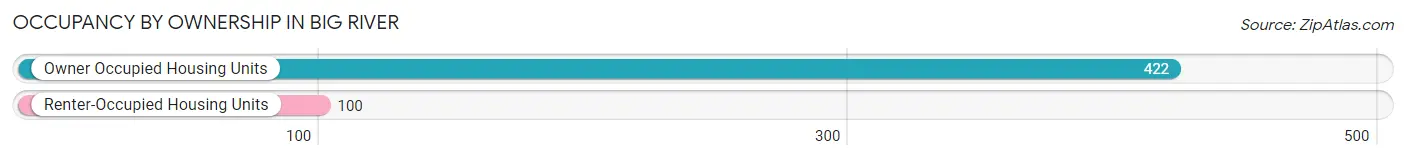
| Occupancy | # Housing Units | % Housing Units |
| Owner Occupied Housing Units | 422 | 80.8% |
| Renter-Occupied Housing Units | 100 | 19.2% |
| Total Occupied Housing Units | 522 | 100.0% |
Occupancy by Household Size in Big River
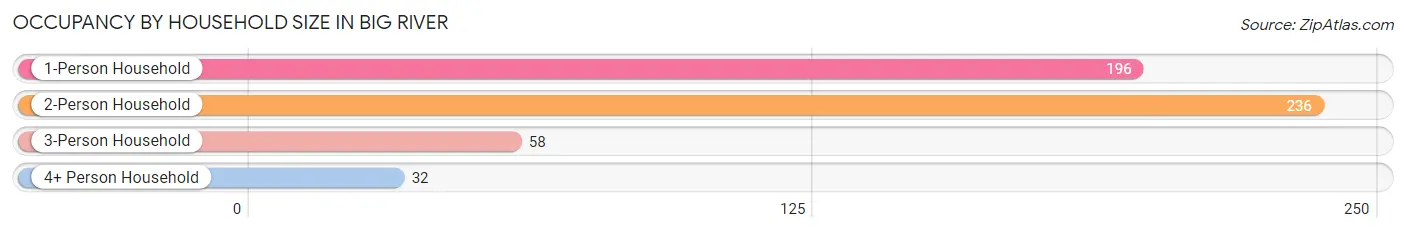
| Household Size | # Housing Units | % Housing Units |
| 1-Person Household | 196 | 37.6% |
| 2-Person Household | 236 | 45.2% |
| 3-Person Household | 58 | 11.1% |
| 4+ Person Household | 32 | 6.1% |
| Total Housing Units | 522 | 100.0% |
Occupancy by Ownership by Household Size in Big River
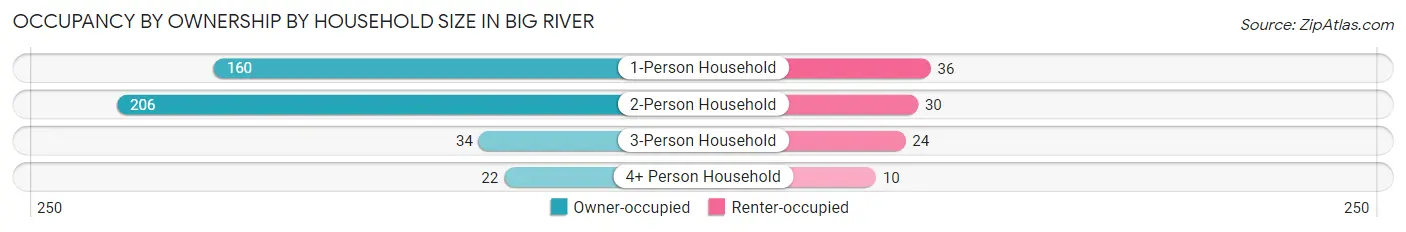
| Household Size | Owner-occupied | Renter-occupied |
| 1-Person Household | 160 (81.6%) | 36 (18.4%) |
| 2-Person Household | 206 (87.3%) | 30 (12.7%) |
| 3-Person Household | 34 (58.6%) | 24 (41.4%) |
| 4+ Person Household | 22 (68.8%) | 10 (31.2%) |
| Total Housing Units | 422 (80.8%) | 100 (19.2%) |
Occupancy by Educational Attainment in Big River
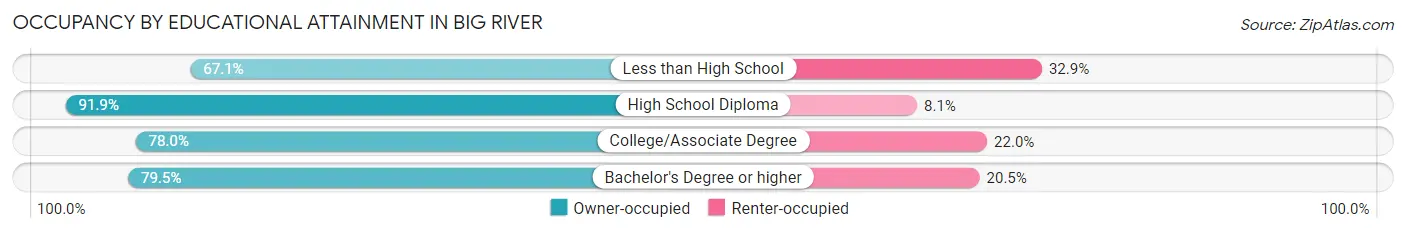
| Household Size | Owner-occupied | Renter-occupied |
| Less than High School | 49 (67.1%) | 24 (32.9%) |
| High School Diploma | 147 (91.9%) | 13 (8.1%) |
| College/Associate Degree | 195 (78.0%) | 55 (22.0%) |
| Bachelor's Degree or higher | 31 (79.5%) | 8 (20.5%) |
Occupancy by Age of Householder in Big River
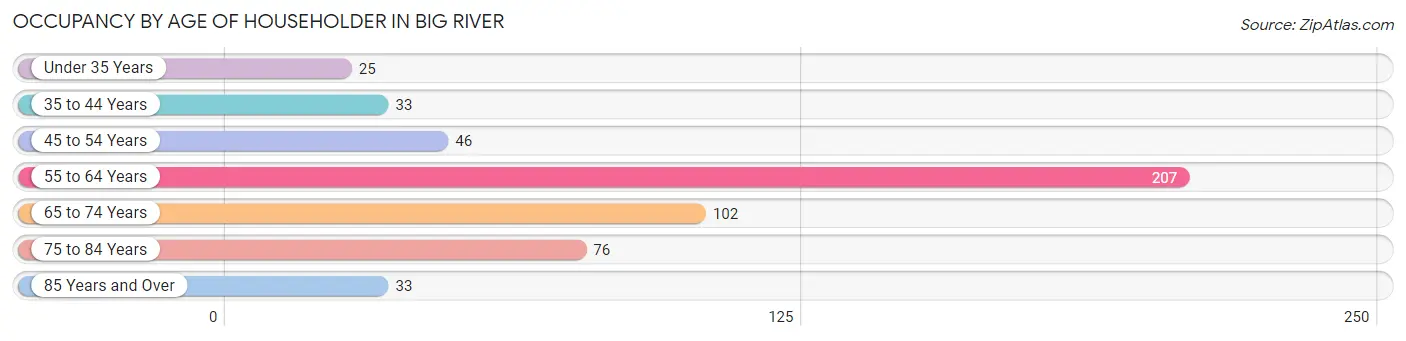
| Age Bracket | # Households | % Households |
| Under 35 Years | 25 | 4.8% |
| 35 to 44 Years | 33 | 6.3% |
| 45 to 54 Years | 46 | 8.8% |
| 55 to 64 Years | 207 | 39.7% |
| 65 to 74 Years | 102 | 19.5% |
| 75 to 84 Years | 76 | 14.6% |
| 85 Years and Over | 33 | 6.3% |
| Total | 522 | 100.0% |
Housing Finances in Big River
Median Income by Occupancy in Big River
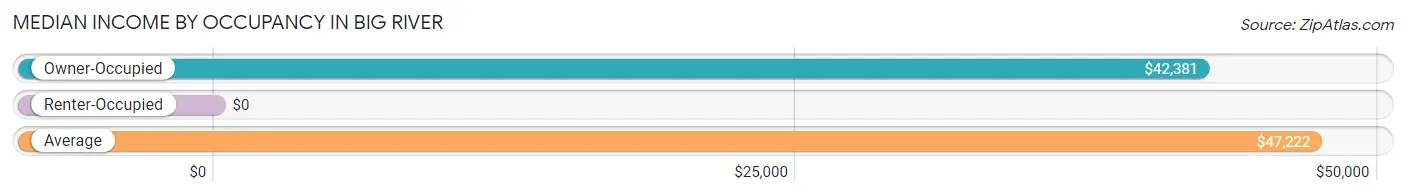
| Occupancy Type | # Households | Median Income |
| Owner-Occupied | 422 (80.8%) | $42,381 |
| Renter-Occupied | 100 (19.2%) | $0 |
| Average | 522 (100.0%) | $47,222 |
Occupancy by Householder Income Bracket in Big River
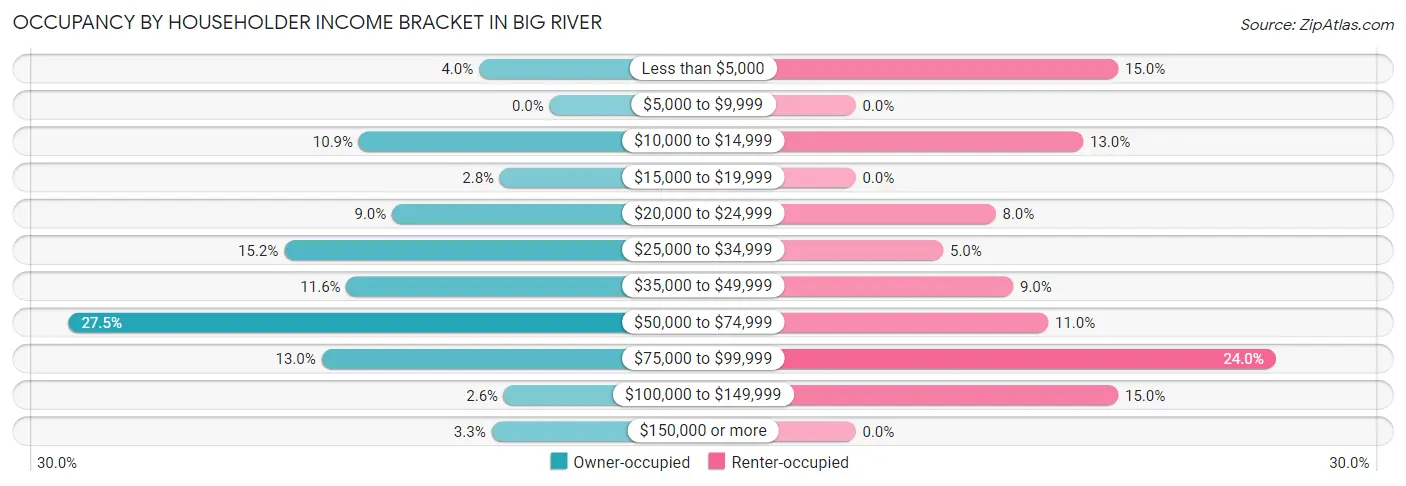
| Income Bracket | Owner-occupied | Renter-occupied |
| Less than $5,000 | 17 (4.0%) | 15 (15.0%) |
| $5,000 to $9,999 | 0 (0.0%) | 0 (0.0%) |
| $10,000 to $14,999 | 46 (10.9%) | 13 (13.0%) |
| $15,000 to $19,999 | 12 (2.8%) | 0 (0.0%) |
| $20,000 to $24,999 | 38 (9.0%) | 8 (8.0%) |
| $25,000 to $34,999 | 64 (15.2%) | 5 (5.0%) |
| $35,000 to $49,999 | 49 (11.6%) | 9 (9.0%) |
| $50,000 to $74,999 | 116 (27.5%) | 11 (11.0%) |
| $75,000 to $99,999 | 55 (13.0%) | 24 (24.0%) |
| $100,000 to $149,999 | 11 (2.6%) | 15 (15.0%) |
| $150,000 or more | 14 (3.3%) | 0 (0.0%) |
| Total | 422 (100.0%) | 100 (100.0%) |
Monthly Housing Cost Tiers in Big River
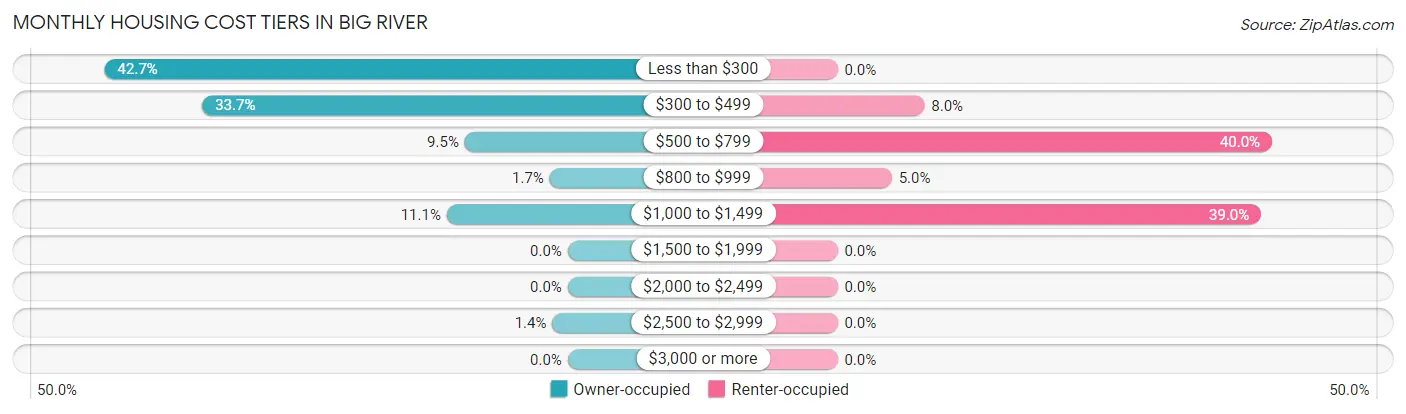
| Monthly Cost | Owner-occupied | Renter-occupied |
| Less than $300 | 180 (42.6%) | 0 (0.0%) |
| $300 to $499 | 142 (33.7%) | 8 (8.0%) |
| $500 to $799 | 40 (9.5%) | 40 (40.0%) |
| $800 to $999 | 7 (1.7%) | 5 (5.0%) |
| $1,000 to $1,499 | 47 (11.1%) | 39 (39.0%) |
| $1,500 to $1,999 | 0 (0.0%) | 0 (0.0%) |
| $2,000 to $2,499 | 0 (0.0%) | 0 (0.0%) |
| $2,500 to $2,999 | 6 (1.4%) | 0 (0.0%) |
| $3,000 or more | 0 (0.0%) | 0 (0.0%) |
| Total | 422 (100.0%) | 100 (100.0%) |
Physical Housing Characteristics in Big River
Housing Structures in Big River
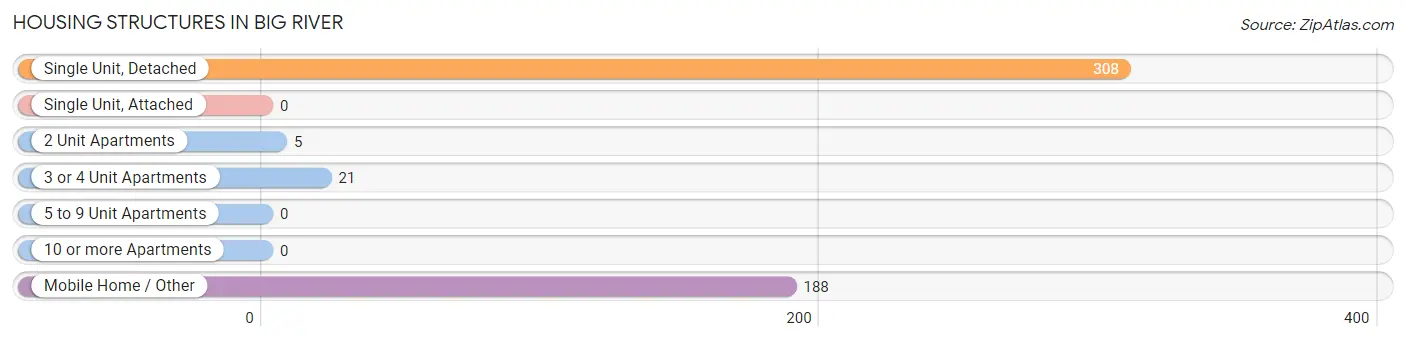
| Structure Type | # Housing Units | % Housing Units |
| Single Unit, Detached | 308 | 59.0% |
| Single Unit, Attached | 0 | 0.0% |
| 2 Unit Apartments | 5 | 1.0% |
| 3 or 4 Unit Apartments | 21 | 4.0% |
| 5 to 9 Unit Apartments | 0 | 0.0% |
| 10 or more Apartments | 0 | 0.0% |
| Mobile Home / Other | 188 | 36.0% |
| Total | 522 | 100.0% |
Housing Structures by Occupancy in Big River
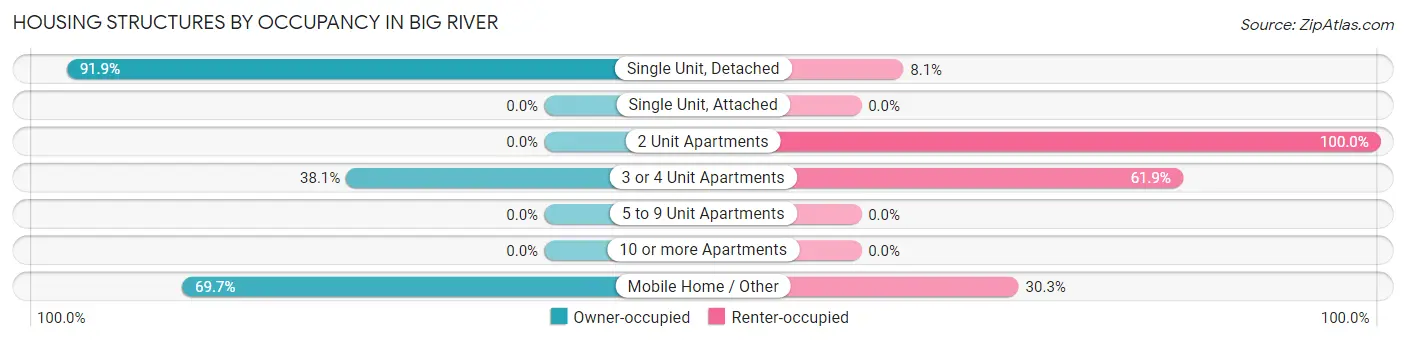
| Structure Type | Owner-occupied | Renter-occupied |
| Single Unit, Detached | 283 (91.9%) | 25 (8.1%) |
| Single Unit, Attached | 0 (0.0%) | 0 (0.0%) |
| 2 Unit Apartments | 0 (0.0%) | 5 (100.0%) |
| 3 or 4 Unit Apartments | 8 (38.1%) | 13 (61.9%) |
| 5 to 9 Unit Apartments | 0 (0.0%) | 0 (0.0%) |
| 10 or more Apartments | 0 (0.0%) | 0 (0.0%) |
| Mobile Home / Other | 131 (69.7%) | 57 (30.3%) |
| Total | 422 (80.8%) | 100 (19.2%) |
Housing Structures by Number of Rooms in Big River
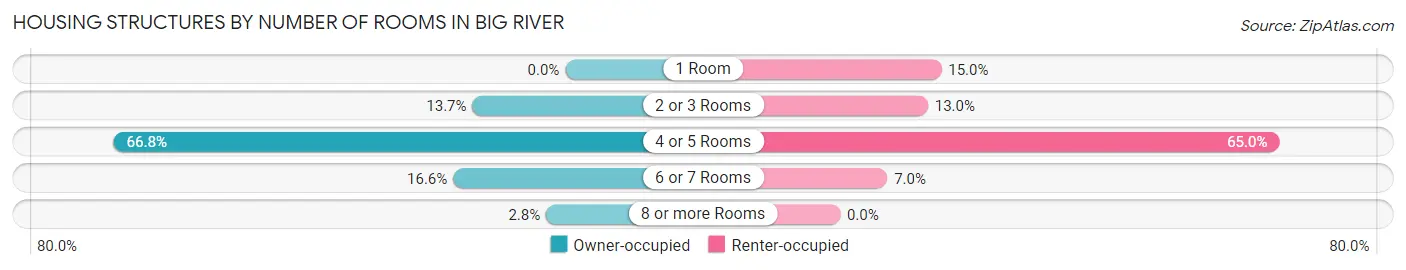
| Number of Rooms | Owner-occupied | Renter-occupied |
| 1 Room | 0 (0.0%) | 15 (15.0%) |
| 2 or 3 Rooms | 58 (13.7%) | 13 (13.0%) |
| 4 or 5 Rooms | 282 (66.8%) | 65 (65.0%) |
| 6 or 7 Rooms | 70 (16.6%) | 7 (7.0%) |
| 8 or more Rooms | 12 (2.8%) | 0 (0.0%) |
| Total | 422 (100.0%) | 100 (100.0%) |
Housing Structure by Heating Type in Big River
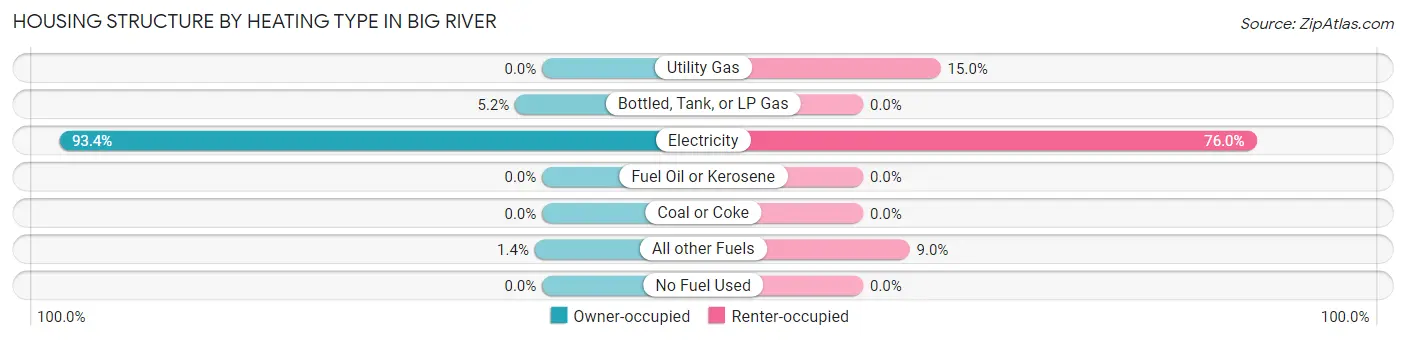
| Heating Type | Owner-occupied | Renter-occupied |
| Utility Gas | 0 (0.0%) | 15 (15.0%) |
| Bottled, Tank, or LP Gas | 22 (5.2%) | 0 (0.0%) |
| Electricity | 394 (93.4%) | 76 (76.0%) |
| Fuel Oil or Kerosene | 0 (0.0%) | 0 (0.0%) |
| Coal or Coke | 0 (0.0%) | 0 (0.0%) |
| All other Fuels | 6 (1.4%) | 9 (9.0%) |
| No Fuel Used | 0 (0.0%) | 0 (0.0%) |
| Total | 422 (100.0%) | 100 (100.0%) |
Household Vehicle Usage in Big River
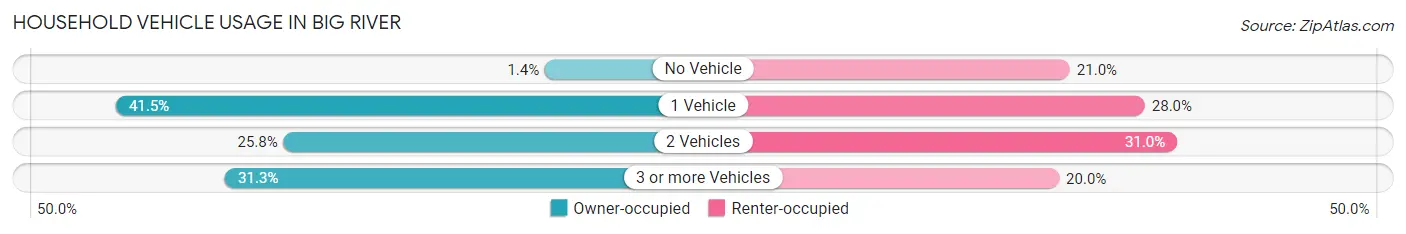
| Vehicles per Household | Owner-occupied | Renter-occupied |
| No Vehicle | 6 (1.4%) | 21 (21.0%) |
| 1 Vehicle | 175 (41.5%) | 28 (28.0%) |
| 2 Vehicles | 109 (25.8%) | 31 (31.0%) |
| 3 or more Vehicles | 132 (31.3%) | 20 (20.0%) |
| Total | 422 (100.0%) | 100 (100.0%) |
Real Estate & Mortgages in Big River
Real Estate and Mortgage Overview in Big River
| Characteristic | Without Mortgage | With Mortgage |
| Housing Units | 355 | 67 |
| Median Property Value | $119,000 | $0 |
| Median Household Income | $41,131 | $7 |
| Monthly Housing Costs | $298 | $0 |
| Real Estate Taxes | $892 | $3 |
Property Value by Mortgage Status in Big River
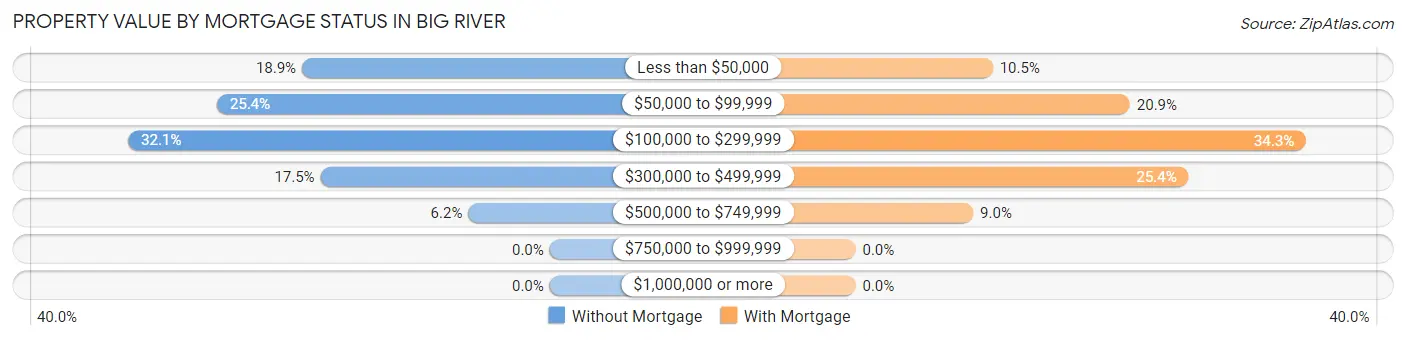
| Property Value | Without Mortgage | With Mortgage |
| Less than $50,000 | 67 (18.9%) | 7 (10.4%) |
| $50,000 to $99,999 | 90 (25.4%) | 14 (20.9%) |
| $100,000 to $299,999 | 114 (32.1%) | 23 (34.3%) |
| $300,000 to $499,999 | 62 (17.5%) | 17 (25.4%) |
| $500,000 to $749,999 | 22 (6.2%) | 6 (9.0%) |
| $750,000 to $999,999 | 0 (0.0%) | 0 (0.0%) |
| $1,000,000 or more | 0 (0.0%) | 0 (0.0%) |
| Total | 355 (100.0%) | 67 (100.0%) |
Household Income by Mortgage Status in Big River
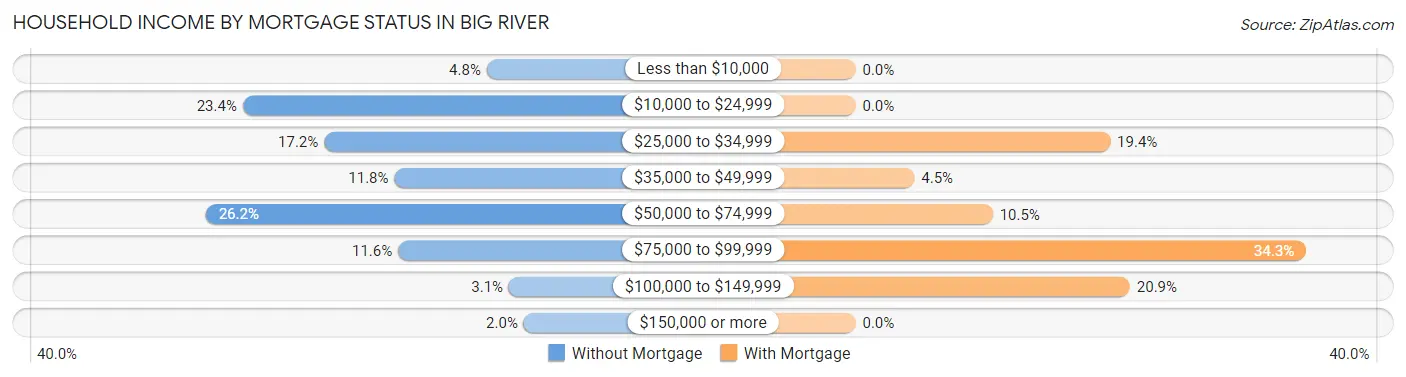
| Household Income | Without Mortgage | With Mortgage |
| Less than $10,000 | 17 (4.8%) | 0 (0.0%) |
| $10,000 to $24,999 | 83 (23.4%) | 0 (0.0%) |
| $25,000 to $34,999 | 61 (17.2%) | 13 (19.4%) |
| $35,000 to $49,999 | 42 (11.8%) | 3 (4.5%) |
| $50,000 to $74,999 | 93 (26.2%) | 7 (10.4%) |
| $75,000 to $99,999 | 41 (11.6%) | 23 (34.3%) |
| $100,000 to $149,999 | 11 (3.1%) | 14 (20.9%) |
| $150,000 or more | 7 (2.0%) | 0 (0.0%) |
| Total | 355 (100.0%) | 67 (100.0%) |
Property Value to Household Income Ratio in Big River
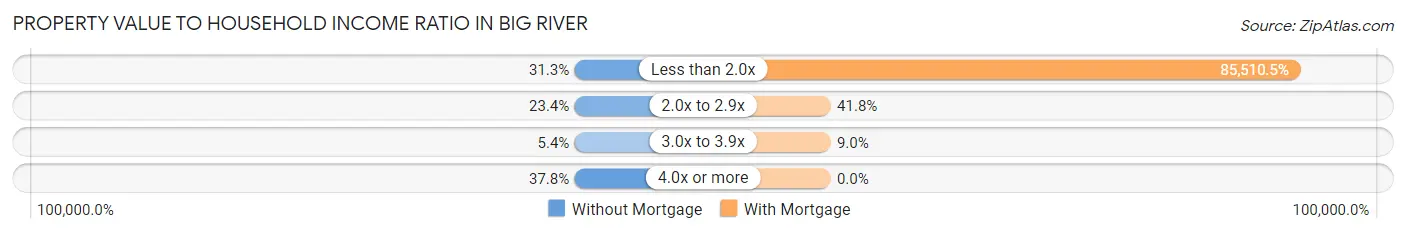
| Value-to-Income Ratio | Without Mortgage | With Mortgage |
| Less than 2.0x | 111 (31.3%) | 57,292 (85,510.5%) |
| 2.0x to 2.9x | 83 (23.4%) | 28 (41.8%) |
| 3.0x to 3.9x | 19 (5.3%) | 6 (9.0%) |
| 4.0x or more | 134 (37.8%) | 0 (0.0%) |
| Total | 355 (100.0%) | 67 (100.0%) |
Real Estate Taxes by Mortgage Status in Big River
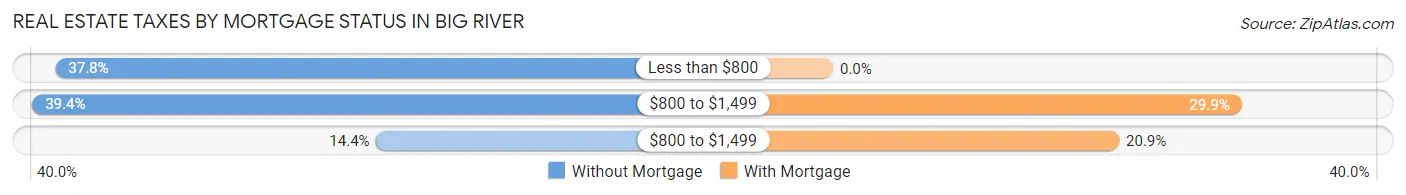
| Property Taxes | Without Mortgage | With Mortgage |
| Less than $800 | 134 (37.8%) | 0 (0.0%) |
| $800 to $1,499 | 140 (39.4%) | 20 (29.8%) |
| $800 to $1,499 | 51 (14.4%) | 14 (20.9%) |
| Total | 355 (100.0%) | 67 (100.0%) |
Health & Disability in Big River
Health Insurance Coverage by Age in Big River
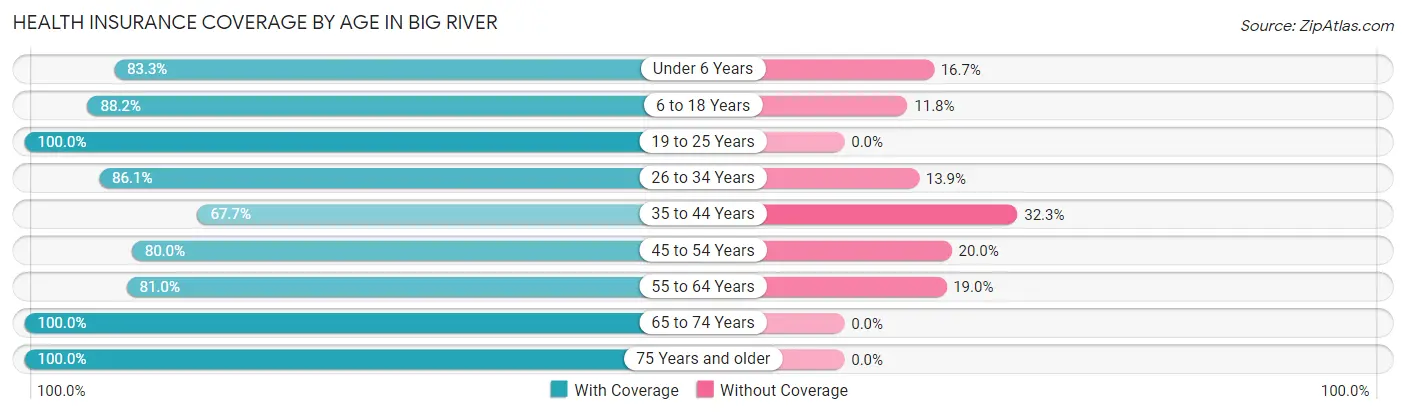
| Age Bracket | With Coverage | Without Coverage |
| Under 6 Years | 35 (83.3%) | 7 (16.7%) |
| 6 to 18 Years | 90 (88.2%) | 12 (11.8%) |
| 19 to 25 Years | 33 (100.0%) | 0 (0.0%) |
| 26 to 34 Years | 31 (86.1%) | 5 (13.9%) |
| 35 to 44 Years | 42 (67.7%) | 20 (32.3%) |
| 45 to 54 Years | 72 (80.0%) | 18 (20.0%) |
| 55 to 64 Years | 277 (81.0%) | 65 (19.0%) |
| 65 to 74 Years | 153 (100.0%) | 0 (0.0%) |
| 75 Years and older | 168 (100.0%) | 0 (0.0%) |
| Total | 901 (87.6%) | 127 (12.3%) |
Health Insurance Coverage by Citizenship Status in Big River
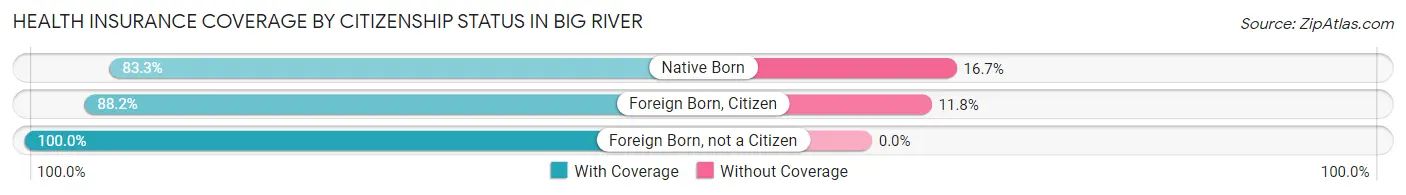
| Citizenship Status | With Coverage | Without Coverage |
| Native Born | 35 (83.3%) | 7 (16.7%) |
| Foreign Born, Citizen | 90 (88.2%) | 12 (11.8%) |
| Foreign Born, not a Citizen | 33 (100.0%) | 0 (0.0%) |
Health Insurance Coverage by Household Income in Big River
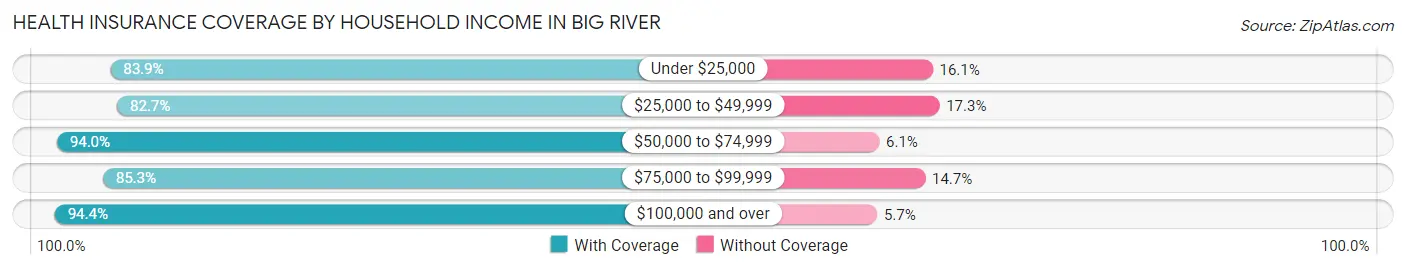
| Household Income | With Coverage | Without Coverage |
| Under $25,000 | 162 (83.9%) | 31 (16.1%) |
| $25,000 to $49,999 | 191 (82.7%) | 40 (17.3%) |
| $50,000 to $74,999 | 233 (94.0%) | 15 (6.0%) |
| $75,000 to $99,999 | 198 (85.3%) | 34 (14.7%) |
| $100,000 and over | 117 (94.4%) | 7 (5.7%) |
Public vs Private Health Insurance Coverage by Age in Big River
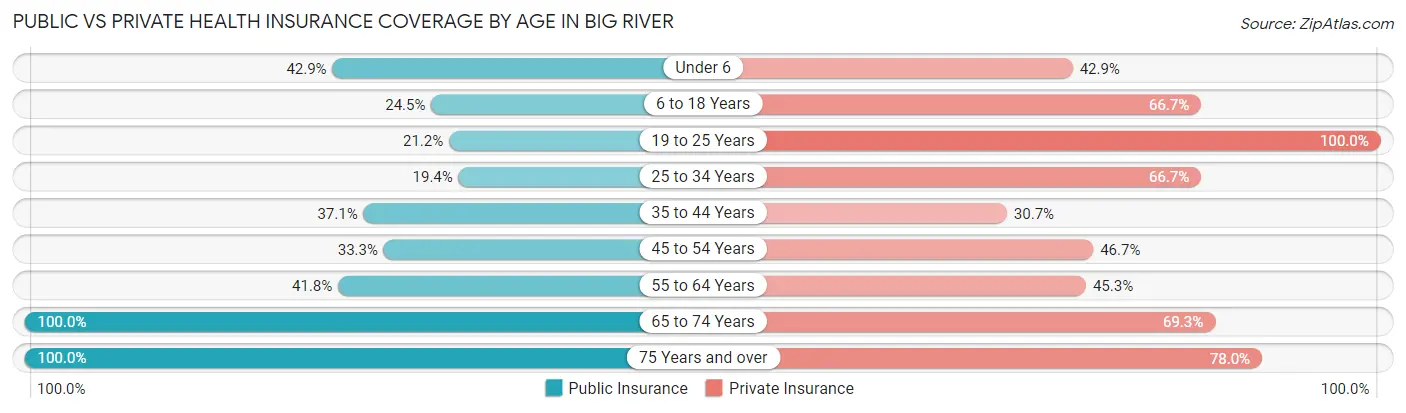
| Age Bracket | Public Insurance | Private Insurance |
| Under 6 | 18 (42.9%) | 18 (42.9%) |
| 6 to 18 Years | 25 (24.5%) | 68 (66.7%) |
| 19 to 25 Years | 7 (21.2%) | 33 (100.0%) |
| 25 to 34 Years | 7 (19.4%) | 24 (66.7%) |
| 35 to 44 Years | 23 (37.1%) | 19 (30.6%) |
| 45 to 54 Years | 30 (33.3%) | 42 (46.7%) |
| 55 to 64 Years | 143 (41.8%) | 155 (45.3%) |
| 65 to 74 Years | 153 (100.0%) | 106 (69.3%) |
| 75 Years and over | 168 (100.0%) | 131 (78.0%) |
| Total | 574 (55.8%) | 596 (58.0%) |
Disability Status by Sex by Age in Big River
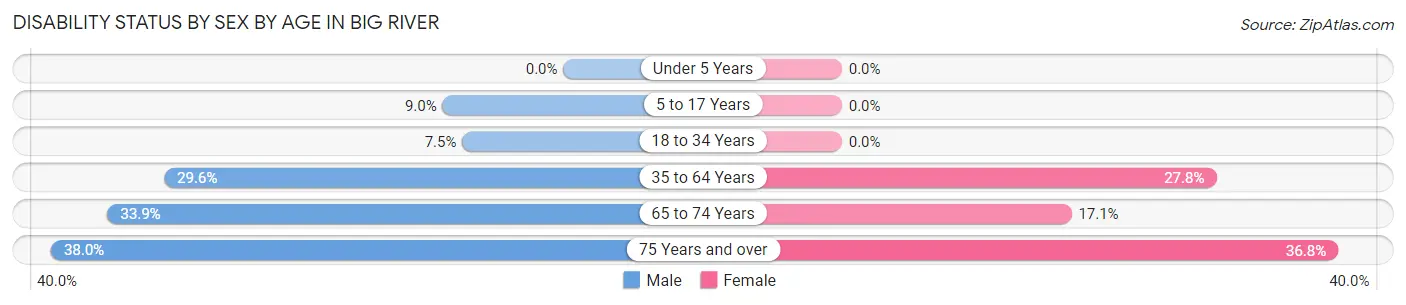
| Age Bracket | Male | Female |
| Under 5 Years | 0 (0.0%) | 0 (0.0%) |
| 5 to 17 Years | 7 (9.0%) | 0 (0.0%) |
| 18 to 34 Years | 3 (7.5%) | 0 (0.0%) |
| 35 to 64 Years | 75 (29.6%) | 67 (27.8%) |
| 65 to 74 Years | 22 (33.9%) | 15 (17.1%) |
| 75 Years and over | 35 (38.0%) | 28 (36.8%) |
Disability Class by Sex by Age in Big River
Disability Class: Hearing Difficulty
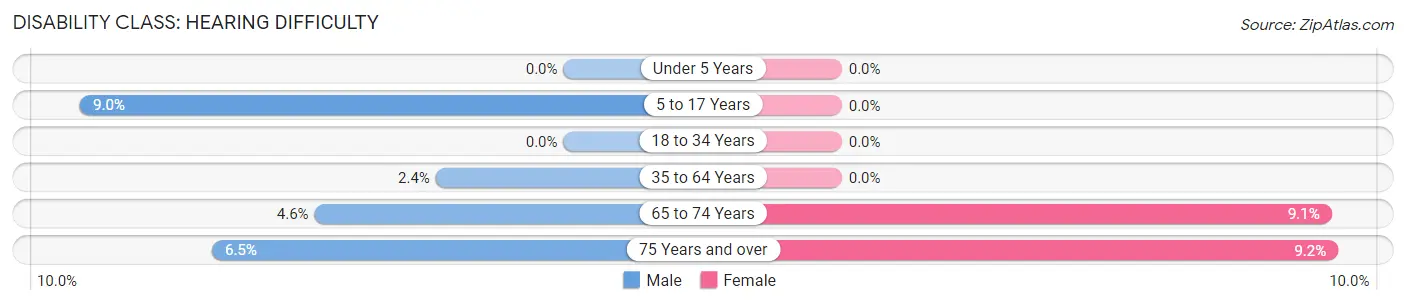
| Age Bracket | Male | Female |
| Under 5 Years | 0 (0.0%) | 0 (0.0%) |
| 5 to 17 Years | 7 (9.0%) | 0 (0.0%) |
| 18 to 34 Years | 0 (0.0%) | 0 (0.0%) |
| 35 to 64 Years | 6 (2.4%) | 0 (0.0%) |
| 65 to 74 Years | 3 (4.6%) | 8 (9.1%) |
| 75 Years and over | 6 (6.5%) | 7 (9.2%) |
Disability Class: Vision Difficulty
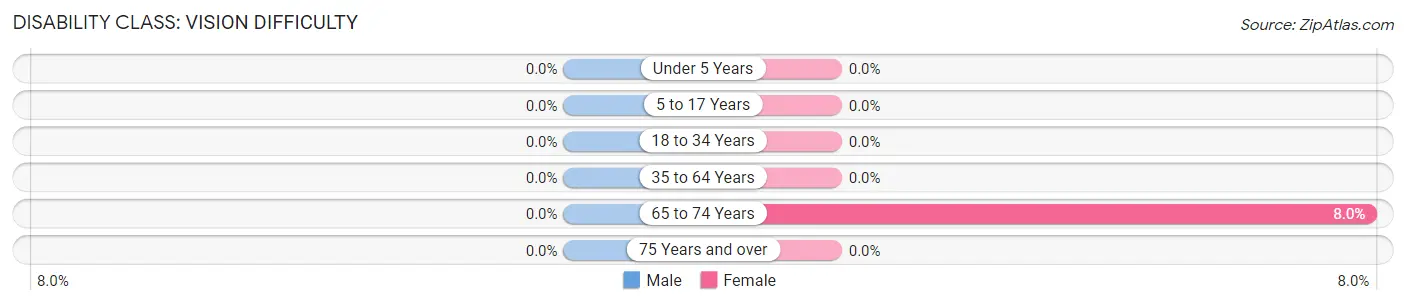
| Age Bracket | Male | Female |
| Under 5 Years | 0 (0.0%) | 0 (0.0%) |
| 5 to 17 Years | 0 (0.0%) | 0 (0.0%) |
| 18 to 34 Years | 0 (0.0%) | 0 (0.0%) |
| 35 to 64 Years | 0 (0.0%) | 0 (0.0%) |
| 65 to 74 Years | 0 (0.0%) | 7 (8.0%) |
| 75 Years and over | 0 (0.0%) | 0 (0.0%) |
Disability Class: Cognitive Difficulty
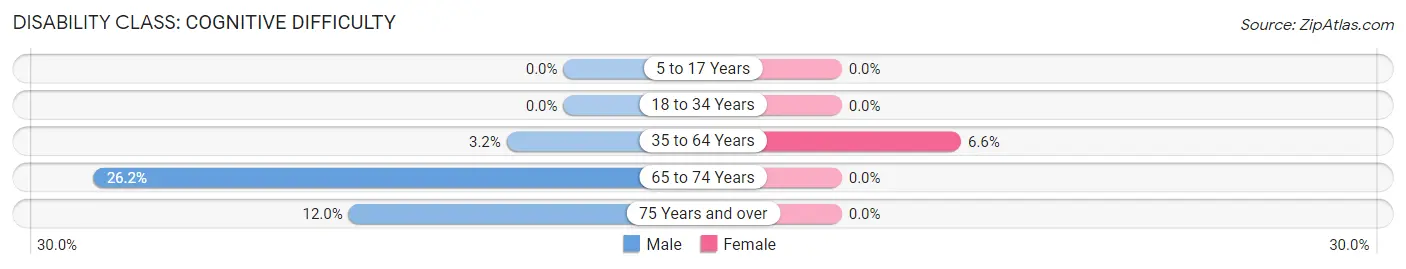
| Age Bracket | Male | Female |
| 5 to 17 Years | 0 (0.0%) | 0 (0.0%) |
| 18 to 34 Years | 0 (0.0%) | 0 (0.0%) |
| 35 to 64 Years | 8 (3.2%) | 16 (6.6%) |
| 65 to 74 Years | 17 (26.2%) | 0 (0.0%) |
| 75 Years and over | 11 (12.0%) | 0 (0.0%) |
Disability Class: Ambulatory Difficulty
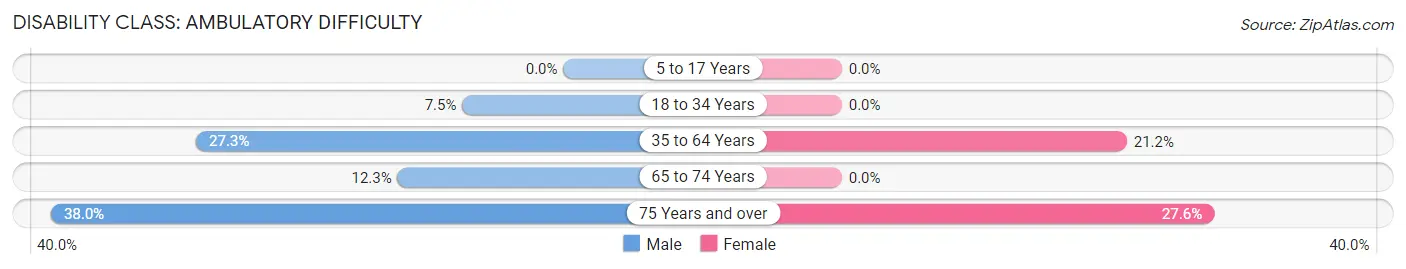
| Age Bracket | Male | Female |
| 5 to 17 Years | 0 (0.0%) | 0 (0.0%) |
| 18 to 34 Years | 3 (7.5%) | 0 (0.0%) |
| 35 to 64 Years | 69 (27.3%) | 51 (21.2%) |
| 65 to 74 Years | 8 (12.3%) | 0 (0.0%) |
| 75 Years and over | 35 (38.0%) | 21 (27.6%) |
Disability Class: Self-Care Difficulty
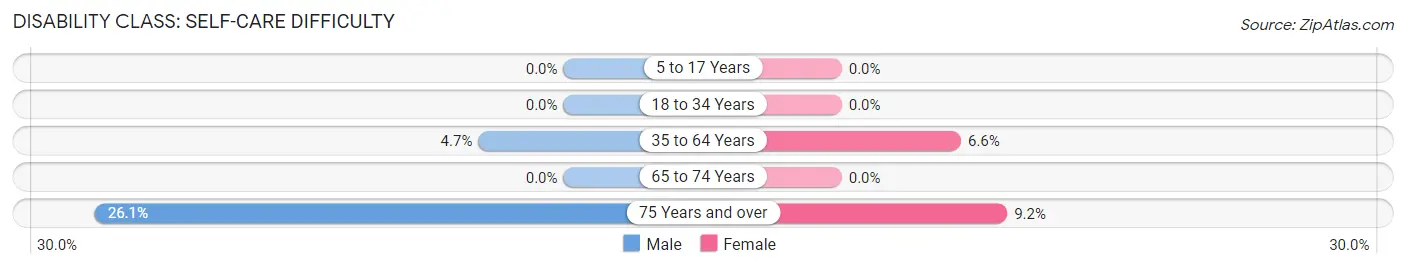
| Age Bracket | Male | Female |
| 5 to 17 Years | 0 (0.0%) | 0 (0.0%) |
| 18 to 34 Years | 0 (0.0%) | 0 (0.0%) |
| 35 to 64 Years | 12 (4.7%) | 16 (6.6%) |
| 65 to 74 Years | 0 (0.0%) | 0 (0.0%) |
| 75 Years and over | 24 (26.1%) | 7 (9.2%) |
Technology Access in Big River
Computing Device Access in Big River
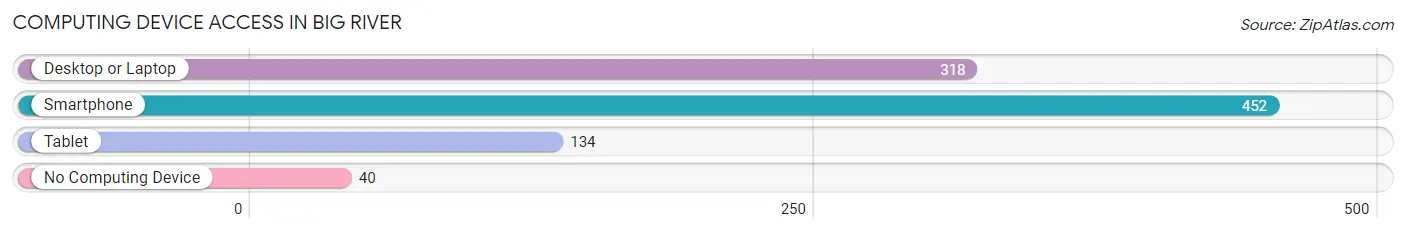
| Device Type | # Households | % Households |
| Desktop or Laptop | 318 | 60.9% |
| Smartphone | 452 | 86.6% |
| Tablet | 134 | 25.7% |
| No Computing Device | 40 | 7.7% |
| Total | 522 | 100.0% |
Internet Access in Big River
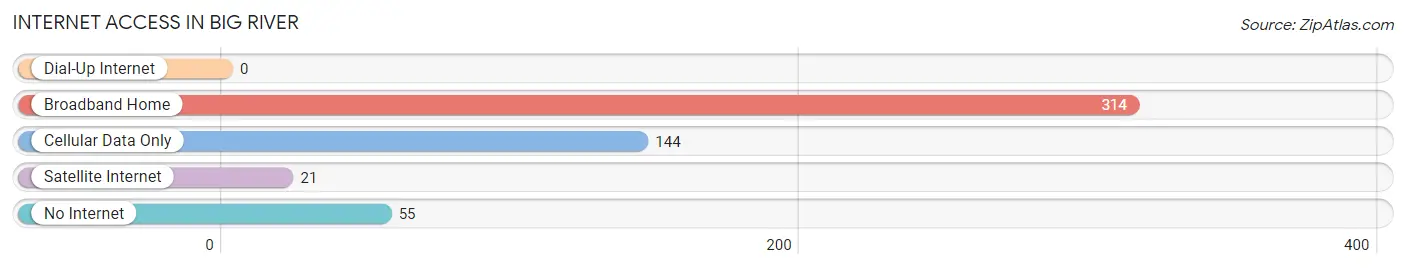
| Internet Type | # Households | % Households |
| Dial-Up Internet | 0 | 0.0% |
| Broadband Home | 314 | 60.2% |
| Cellular Data Only | 144 | 27.6% |
| Satellite Internet | 21 | 4.0% |
| No Internet | 55 | 10.5% |
| Total | 522 | 100.0% |
Big River Summary
River, CA is a small town located in the northern part of California, in the Sierra Nevada foothills. It is situated on the banks of the Big River, a tributary of the Sacramento River. The town has a population of just over 1,000 people and is known for its rural charm and small-town atmosphere.
History
The area around Big River has been inhabited for thousands of years by Native American tribes, including the Maidu, Miwok, and Wintun. The first European settlers arrived in the area in the mid-1800s, and the town of Big River was officially established in 1854. The town was named after the Big River, which was an important source of water for the early settlers.
In the late 1800s, the town became a popular destination for gold miners, and the population grew rapidly. The town also became a hub for logging and timber production, and the lumber industry was a major source of employment for many years.
Geography
Big River is located in the northern part of California, in the Sierra Nevada foothills. The town is situated on the banks of the Big River, a tributary of the Sacramento River. The town is surrounded by rolling hills and forests, and the climate is mild and temperate.
The town is located about 50 miles northeast of Sacramento, and about 100 miles northwest of Lake Tahoe. The nearest major cities are Redding and Chico, both of which are about an hour away.
Economy
The economy of Big River is largely based on tourism and agriculture. The town is a popular destination for outdoor enthusiasts, and there are several campgrounds and recreational areas nearby. The town is also home to several wineries, and the local wine industry is a major source of income for the town.
Agriculture is also an important part of the local economy. The town is surrounded by farms and ranches, and the local farmers produce a variety of crops, including apples, pears, and walnuts.
Demographics
As of the 2010 census, the population of Big River was 1,072. The racial makeup of the town was 94.3% White, 0.7% African American, 0.7% Native American, 0.7% Asian, 0.3% Pacific Islander, and 2.7% from other races. The median household income was $41,250, and the median family income was $48,750.
The town is served by the Big River Unified School District, which includes two elementary schools, one middle school, and one high school. The town also has a public library and a community center.
Big River is a small town with a rich history and a unique culture. The town is a popular destination for outdoor enthusiasts, and the local economy is largely based on tourism and agriculture. The town is also home to a diverse population, and the median household income is slightly above the state average.
Common Questions
What is Per Capita Income in Big River?
Per Capita income in Big River is $30,860.
What is the Median Family Income in Big River?
Median Family Income in Big River is $54,567.
What is the Median Household income in Big River?
Median Household Income in Big River is $47,222.
What is Income or Wage Gap in Big River?
Income or Wage Gap in Big River is 11.1%.
Women in Big River earn 88.9 cents for every dollar earned by a man.
What is Inequality or Gini Index in Big River?
Inequality or Gini Index in Big River is 0.48.
What is the Total Population of Big River?
Total Population of Big River is 1,028.
What is the Total Male Population of Big River?
Total Male Population of Big River is 552.
What is the Total Female Population of Big River?
Total Female Population of Big River is 476.
What is the Ratio of Males per 100 Females in Big River?
There are 115.97 Males per 100 Females in Big River.
What is the Ratio of Females per 100 Males in Big River?
There are 86.23 Females per 100 Males in Big River.
What is the Median Population Age in Big River?
Median Population Age in Big River is 58.5 Years.
What is the Average Family Size in Big River
Average Family Size in Big River is 2.6 People.
What is the Average Household Size in Big River
Average Household Size in Big River is 2.0 People.
How Large is the Labor Force in Big River?
There are 388 People in the Labor Forcein in Big River.
What is the Percentage of People in the Labor Force in Big River?
43.4% of People are in the Labor Force in Big River.
What is the Unemployment Rate in Big River?
Unemployment Rate in Big River is 11.3%.