Campo, CA Map & Demographics
Campo Map
Campo Overview
$25,419
PER CAPITA INCOME
$74,722
AVG FAMILY INCOME
$55,529
AVG HOUSEHOLD INCOME
5.9%
WAGE / INCOME GAP [ % ]
94.1¢/ $1
WAGE / INCOME GAP [ $ ]
$5,123
FAMILY INCOME DEFICIT
0.41
INEQUALITY / GINI INDEX
3,468
TOTAL POPULATION
2,049
MALE POPULATION
1,419
FEMALE POPULATION
144.40
MALES / 100 FEMALES
69.25
FEMALES / 100 MALES
33.3
MEDIAN AGE
3.7
AVG FAMILY SIZE
3.3
AVG HOUSEHOLD SIZE
1,401
LABOR FORCE [ PEOPLE ]
56.5%
PERCENT IN LABOR FORCE
3.1%
UNEMPLOYMENT RATE
Campo Zip Codes
Campo Area Codes
Income in Campo
Income Overview in Campo
Per Capita Income in Campo is $25,419, while median incomes of families and households are $74,722 and $55,529 respectively.
| Characteristic | Number | Measure |
| Per Capita Income | 3,468 | $25,419 |
| Median Family Income | 746 | $74,722 |
| Mean Family Income | 746 | $93,761 |
| Median Household Income | 986 | $55,529 |
| Mean Household Income | 986 | $84,275 |
| Income Deficit | 746 | $5,123 |
| Wage / Income Gap (%) | 3,468 | 5.86% |
| Wage / Income Gap ($) | 3,468 | 94.14¢ per $1 |
| Gini / Inequality Index | 3,468 | 0.41 |
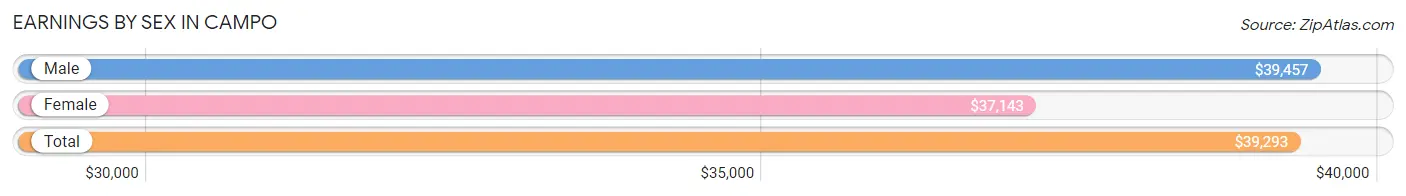
Earnings by Sex in Campo
Average Earnings in Campo are $39,293, $39,457 for men and $37,143 for women, a difference of 5.9%.
| Sex | Number | Average Earnings |
| Male | 896 (60.9%) | $39,457 |
| Female | 576 (39.1%) | $37,143 |
| Total | 1,472 (100.0%) | $39,293 |
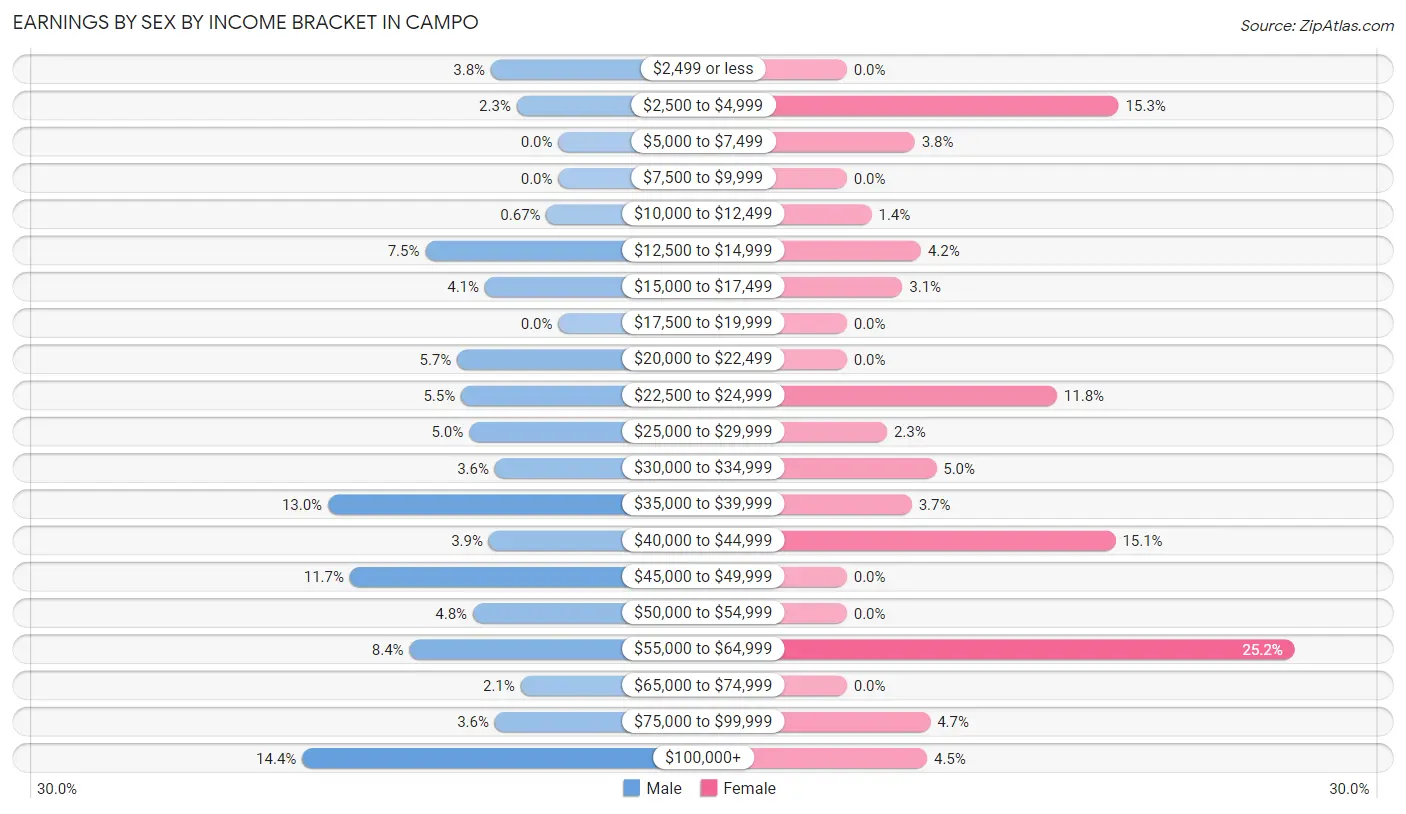
Earnings by Sex by Income Bracket in Campo
The most common earnings brackets in Campo are $100,000+ for men (129 | 14.4%) and $55,000 to $64,999 for women (145 | 25.2%).
| Income | Male | Female |
| $2,499 or less | 34 (3.8%) | 0 (0.0%) |
| $2,500 to $4,999 | 21 (2.3%) | 88 (15.3%) |
| $5,000 to $7,499 | 0 (0.0%) | 22 (3.8%) |
| $7,500 to $9,999 | 0 (0.0%) | 0 (0.0%) |
| $10,000 to $12,499 | 6 (0.7%) | 8 (1.4%) |
| $12,500 to $14,999 | 67 (7.5%) | 24 (4.2%) |
| $15,000 to $17,499 | 37 (4.1%) | 18 (3.1%) |
| $17,500 to $19,999 | 0 (0.0%) | 0 (0.0%) |
| $20,000 to $22,499 | 51 (5.7%) | 0 (0.0%) |
| $22,500 to $24,999 | 49 (5.5%) | 68 (11.8%) |
| $25,000 to $29,999 | 45 (5.0%) | 13 (2.3%) |
| $30,000 to $34,999 | 32 (3.6%) | 29 (5.0%) |
| $35,000 to $39,999 | 116 (13.0%) | 21 (3.6%) |
| $40,000 to $44,999 | 35 (3.9%) | 87 (15.1%) |
| $45,000 to $49,999 | 105 (11.7%) | 0 (0.0%) |
| $50,000 to $54,999 | 43 (4.8%) | 0 (0.0%) |
| $55,000 to $64,999 | 75 (8.4%) | 145 (25.2%) |
| $65,000 to $74,999 | 19 (2.1%) | 0 (0.0%) |
| $75,000 to $99,999 | 32 (3.6%) | 27 (4.7%) |
| $100,000+ | 129 (14.4%) | 26 (4.5%) |
| Total | 896 (100.0%) | 576 (100.0%) |
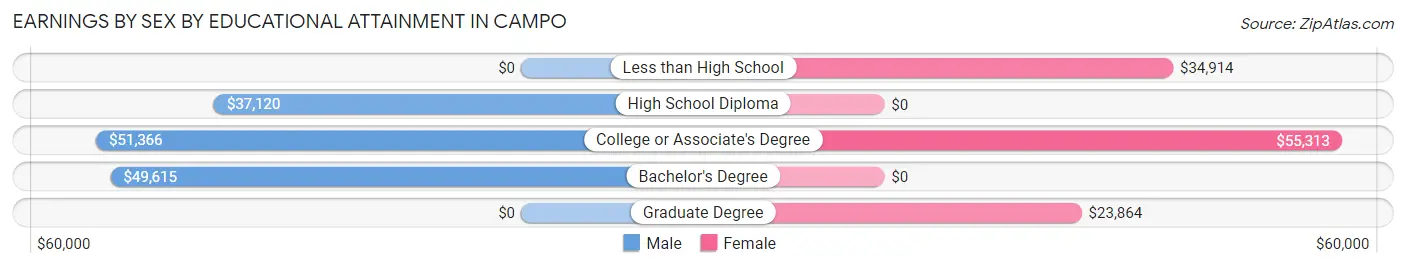
Earnings by Sex by Educational Attainment in Campo
Average earnings in Campo are $45,139 for men and $41,992 for women, a difference of 7.0%. Men with an educational attainment of college or associate's degree enjoy the highest average annual earnings of $51,366, while those with high school diploma education earn the least with $37,120. Women with an educational attainment of college or associate's degree earn the most with the average annual earnings of $55,313, while those with graduate degree education have the smallest earnings of $23,864.
| Educational Attainment | Male Income | Female Income |
| Less than High School | - | - |
| High School Diploma | $37,120 | $0 |
| College or Associate's Degree | $51,366 | $55,313 |
| Bachelor's Degree | $49,615 | $0 |
| Graduate Degree | - | - |
| Total | $45,139 | $41,992 |
Family Income in Campo
Family Income Brackets in Campo
According to the Campo family income data, there are 244 families falling into the $100,000 to $149,999 income range, which is the most common income bracket and makes up 32.7% of all families. Conversely, the $10,000 to $14,999 income bracket is the least frequent group with only 6 families (0.8%) belonging to this category.
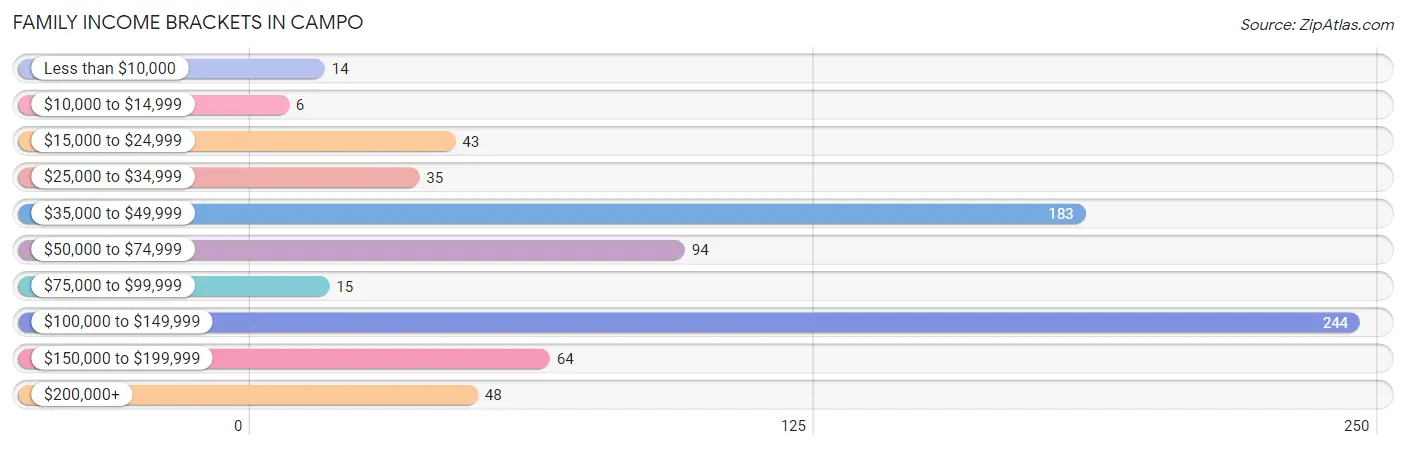
| Income Bracket | # Families | % Families |
| Less than $10,000 | 14 | 1.9% |
| $10,000 to $14,999 | 6 | 0.8% |
| $15,000 to $24,999 | 43 | 5.8% |
| $25,000 to $34,999 | 35 | 4.7% |
| $35,000 to $49,999 | 183 | 24.5% |
| $50,000 to $74,999 | 94 | 12.6% |
| $75,000 to $99,999 | 15 | 2.0% |
| $100,000 to $149,999 | 244 | 32.7% |
| $150,000 to $199,999 | 64 | 8.6% |
| $200,000+ | 48 | 6.4% |
Family Income by Famaliy Size in Campo
3-person families (182 | 24.4%) account for the highest median family income in Campo with $119,667 per family, while 3-person families (182 | 24.4%) have the highest median income of $39,889 per family member.
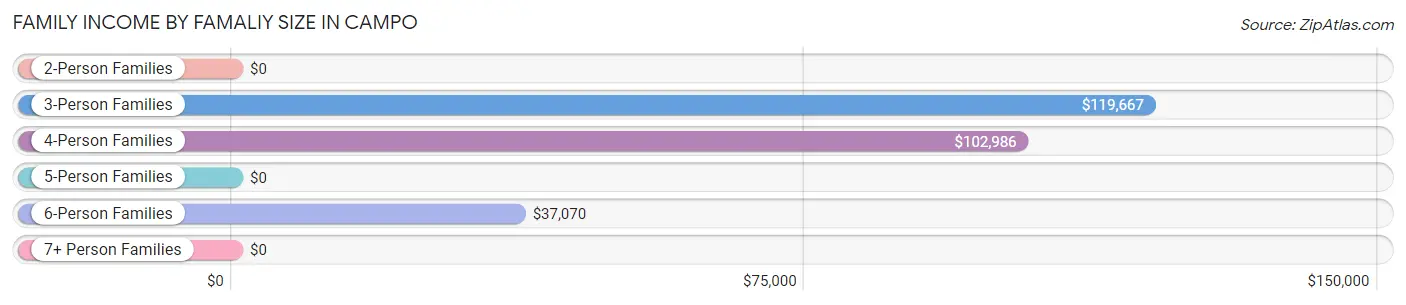
| Income Bracket | # Families | Median Income |
| 2-Person Families | 269 (36.1%) | $0 |
| 3-Person Families | 182 (24.4%) | $119,667 |
| 4-Person Families | 87 (11.7%) | $102,986 |
| 5-Person Families | 66 (8.8%) | $0 |
| 6-Person Families | 110 (14.7%) | $37,070 |
| 7+ Person Families | 32 (4.3%) | $0 |
| Total | 746 (100.0%) | $74,722 |
Family Income by Number of Earners in Campo
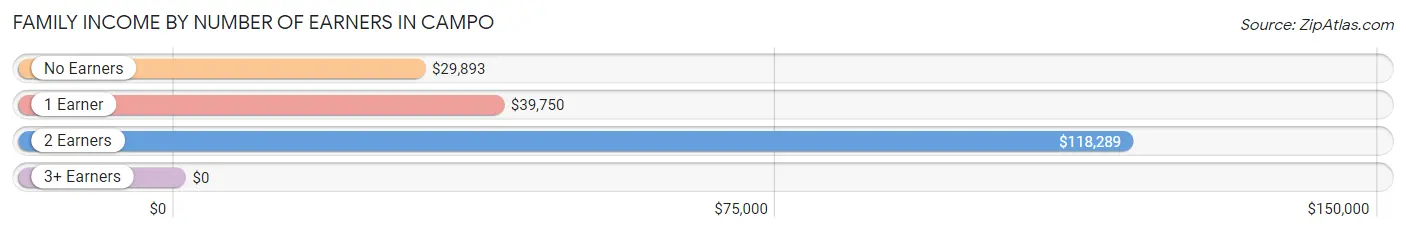
| Number of Earners | # Families | Median Income |
| No Earners | 97 (13.0%) | $29,893 |
| 1 Earner | 305 (40.9%) | $39,750 |
| 2 Earners | 286 (38.3%) | $118,289 |
| 3+ Earners | 58 (7.8%) | $0 |
| Total | 746 (100.0%) | $74,722 |
Household Income in Campo
Household Income Brackets in Campo
With 288 households falling in the category, the $35,000 to $49,999 income range is the most frequent in Campo, accounting for 29.2% of all households. In contrast, only 6 households (0.6%) fall into the $10,000 to $14,999 income bracket, making it the least populous group.
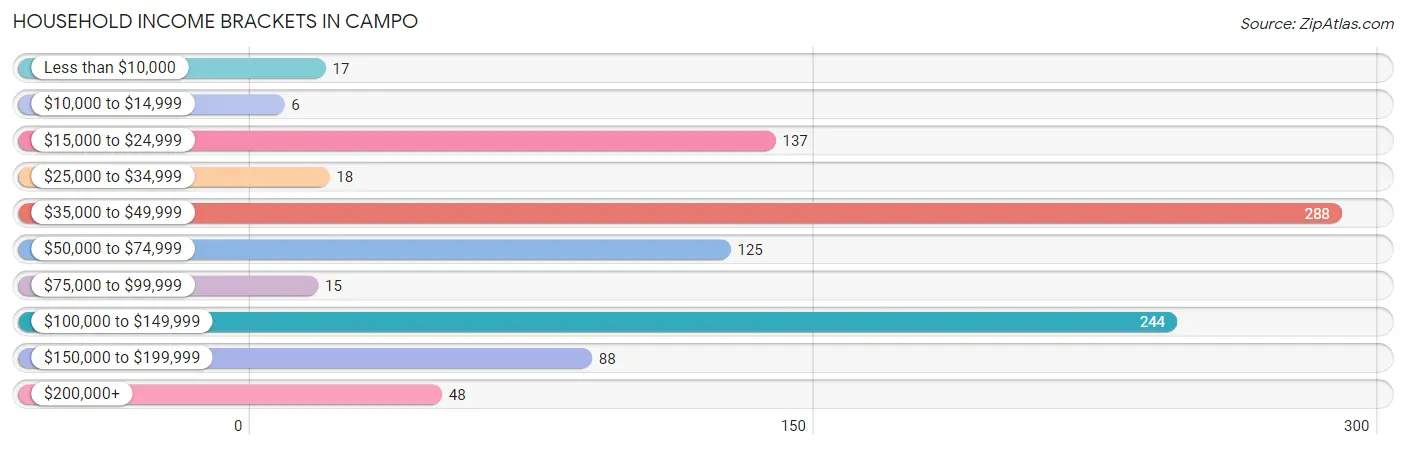
| Income Bracket | # Households | % Households |
| Less than $10,000 | 17 | 1.7% |
| $10,000 to $14,999 | 6 | 0.6% |
| $15,000 to $24,999 | 137 | 13.9% |
| $25,000 to $34,999 | 18 | 1.8% |
| $35,000 to $49,999 | 288 | 29.2% |
| $50,000 to $74,999 | 125 | 12.7% |
| $75,000 to $99,999 | 15 | 1.5% |
| $100,000 to $149,999 | 244 | 24.7% |
| $150,000 to $199,999 | 88 | 8.9% |
| $200,000+ | 48 | 4.9% |
Household Income by Householder Age in Campo
The median household income in Campo is $55,529, with the highest median household income of $90,250 found in the 45 to 64 years age bracket for the primary householder. A total of 475 households (48.2%) fall into this category.
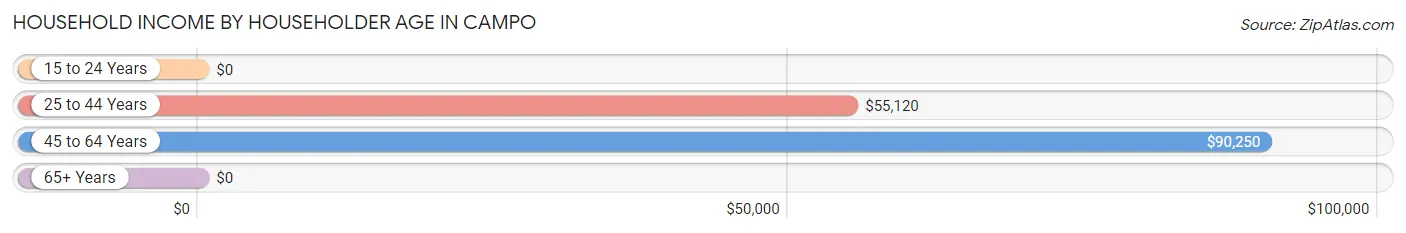
| Income Bracket | # Households | Median Income |
| 15 to 24 Years | 0 (0.0%) | $0 |
| 25 to 44 Years | 253 (25.7%) | $55,120 |
| 45 to 64 Years | 475 (48.2%) | $90,250 |
| 65+ Years | 258 (26.2%) | $0 |
| Total | 986 (100.0%) | $55,529 |
Poverty in Campo
Income Below Poverty by Sex and Age in Campo
With 22.8% poverty level for males and 33.8% for females among the residents of Campo, 5 year old males and 6 to 11 year old females are the most vulnerable to poverty, with 2 males (100.0%) and 165 females (85.5%) in their respective age groups living below the poverty level.
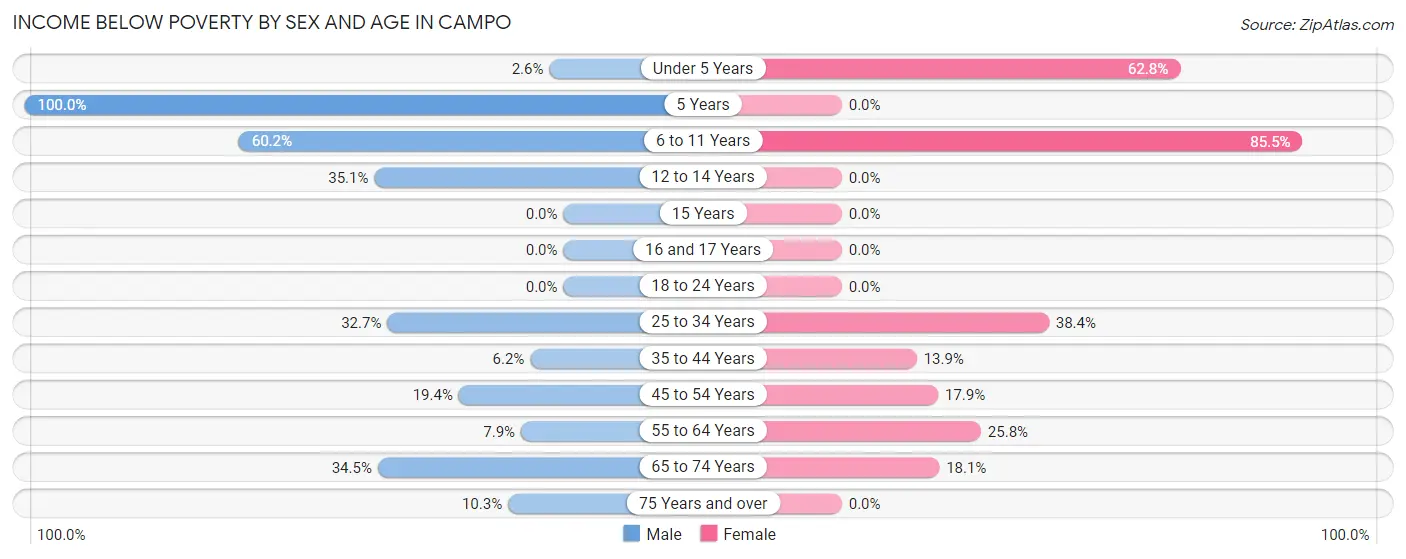
| Age Bracket | Male | Female |
| Under 5 Years | 4 (2.6%) | 113 (62.8%) |
| 5 Years | 2 (100.0%) | 0 (0.0%) |
| 6 to 11 Years | 100 (60.2%) | 165 (85.5%) |
| 12 to 14 Years | 60 (35.1%) | 0 (0.0%) |
| 15 Years | 0 (0.0%) | 0 (0.0%) |
| 16 and 17 Years | 0 (0.0%) | 0 (0.0%) |
| 18 to 24 Years | 0 (0.0%) | 0 (0.0%) |
| 25 to 34 Years | 101 (32.7%) | 68 (38.4%) |
| 35 to 44 Years | 4 (6.1%) | 26 (13.9%) |
| 45 to 54 Years | 40 (19.4%) | 20 (17.9%) |
| 55 to 64 Years | 28 (7.9%) | 55 (25.8%) |
| 65 to 74 Years | 72 (34.4%) | 32 (18.1%) |
| 75 Years and over | 11 (10.3%) | 0 (0.0%) |
| Total | 422 (22.8%) | 479 (33.8%) |
Income Above Poverty by Sex and Age in Campo
According to the poverty statistics in Campo, males aged 16 and 17 years and females aged 5 years are the age groups that are most secure financially, with 100.0% of males and 100.0% of females in these age groups living above the poverty line.
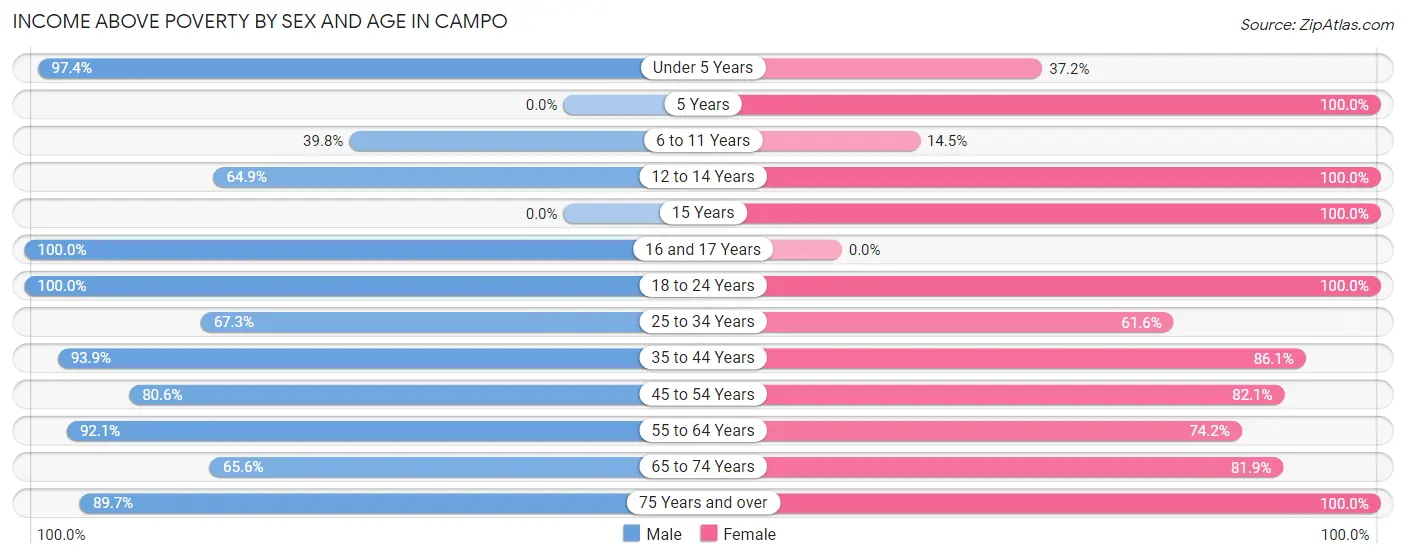
| Age Bracket | Male | Female |
| Under 5 Years | 149 (97.4%) | 67 (37.2%) |
| 5 Years | 0 (0.0%) | 30 (100.0%) |
| 6 to 11 Years | 66 (39.8%) | 28 (14.5%) |
| 12 to 14 Years | 111 (64.9%) | 59 (100.0%) |
| 15 Years | 0 (0.0%) | 1 (100.0%) |
| 16 and 17 Years | 23 (100.0%) | 0 (0.0%) |
| 18 to 24 Years | 81 (100.0%) | 57 (100.0%) |
| 25 to 34 Years | 208 (67.3%) | 109 (61.6%) |
| 35 to 44 Years | 61 (93.9%) | 161 (86.1%) |
| 45 to 54 Years | 166 (80.6%) | 92 (82.1%) |
| 55 to 64 Years | 328 (92.1%) | 158 (74.2%) |
| 65 to 74 Years | 137 (65.5%) | 145 (81.9%) |
| 75 Years and over | 96 (89.7%) | 33 (100.0%) |
| Total | 1,426 (77.2%) | 940 (66.2%) |
Income Below Poverty Among Married-Couple Families in Campo
The poverty statistics for married-couple families in Campo show that 17.8% or 101 of the total 566 families live below the poverty line. Families with 5 or more children have the highest poverty rate of 96.9%, comprising of 31 families. On the other hand, families with 1 or 2 children have the lowest poverty rate of 0.0%, which includes 0 families.
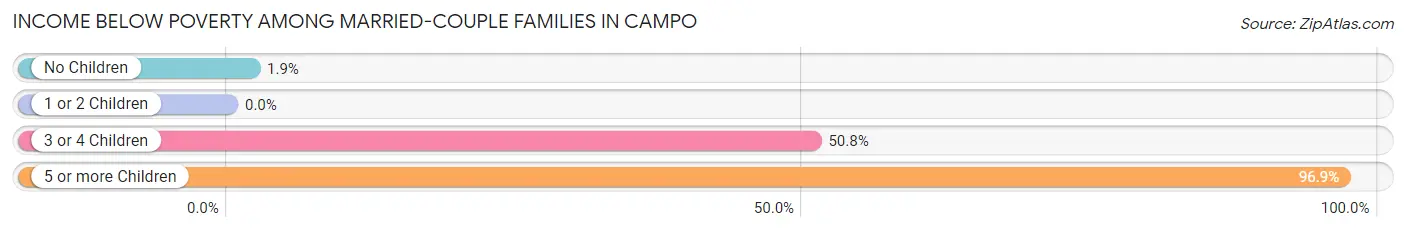
| Children | Above Poverty | Below Poverty |
| No Children | 307 (98.1%) | 6 (1.9%) |
| 1 or 2 Children | 95 (100.0%) | 0 (0.0%) |
| 3 or 4 Children | 62 (49.2%) | 64 (50.8%) |
| 5 or more Children | 1 (3.1%) | 31 (96.9%) |
| Total | 465 (82.2%) | 101 (17.8%) |
Income Below Poverty Among Single-Parent Households in Campo
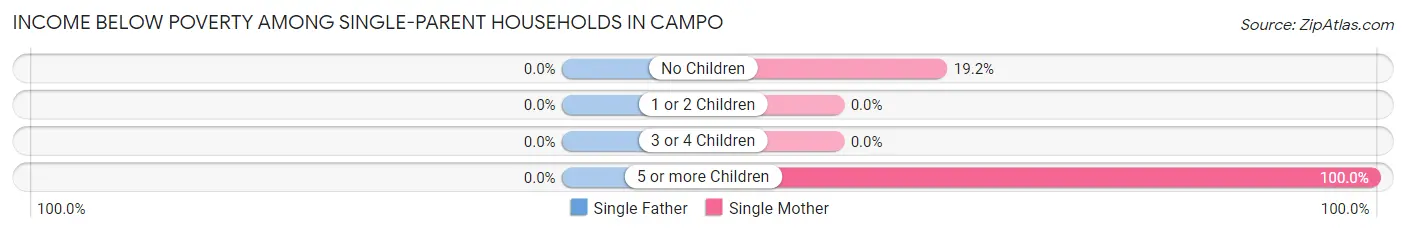
| Children | Single Father | Single Mother |
| No Children | 0 (0.0%) | 15 (19.2%) |
| 1 or 2 Children | 0 (0.0%) | 0 (0.0%) |
| 3 or 4 Children | 0 (0.0%) | 0 (0.0%) |
| 5 or more Children | 0 (0.0%) | 2 (100.0%) |
| Total | 0 (0.0%) | 17 (12.9%) |
Income Below Poverty Among Married-Couple vs Single-Parent Households in Campo
The poverty data for Campo shows that 101 of the married-couple family households (17.8%) and 17 of the single-parent households (9.4%) are living below the poverty level. Within the married-couple family households, those with 5 or more children have the highest poverty rate, with 31 households (96.9%) falling below the poverty line. Among the single-parent households, those with 5 or more children have the highest poverty rate, with 2 household (100.0%) living below poverty.
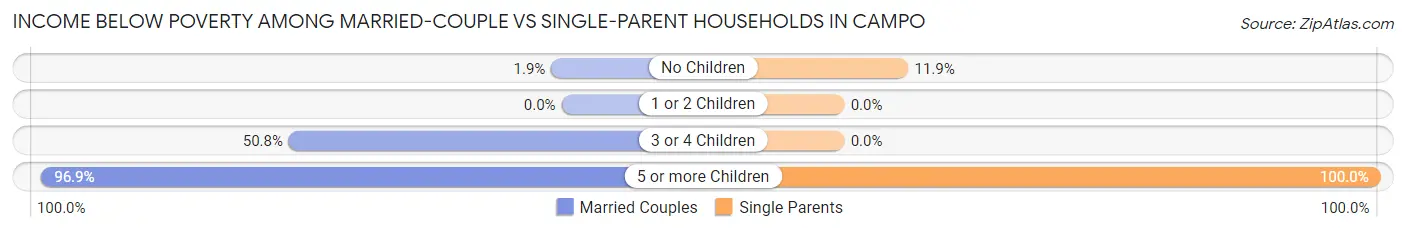
| Children | Married-Couple Families | Single-Parent Households |
| No Children | 6 (1.9%) | 15 (11.9%) |
| 1 or 2 Children | 0 (0.0%) | 0 (0.0%) |
| 3 or 4 Children | 64 (50.8%) | 0 (0.0%) |
| 5 or more Children | 31 (96.9%) | 2 (100.0%) |
| Total | 101 (17.8%) | 17 (9.4%) |
Race in Campo
The most populous races in Campo are White / Caucasian (2,183 | 62.9%), Hispanic or Latino (1,370 | 39.5%), and Some other Race (817 | 23.6%).
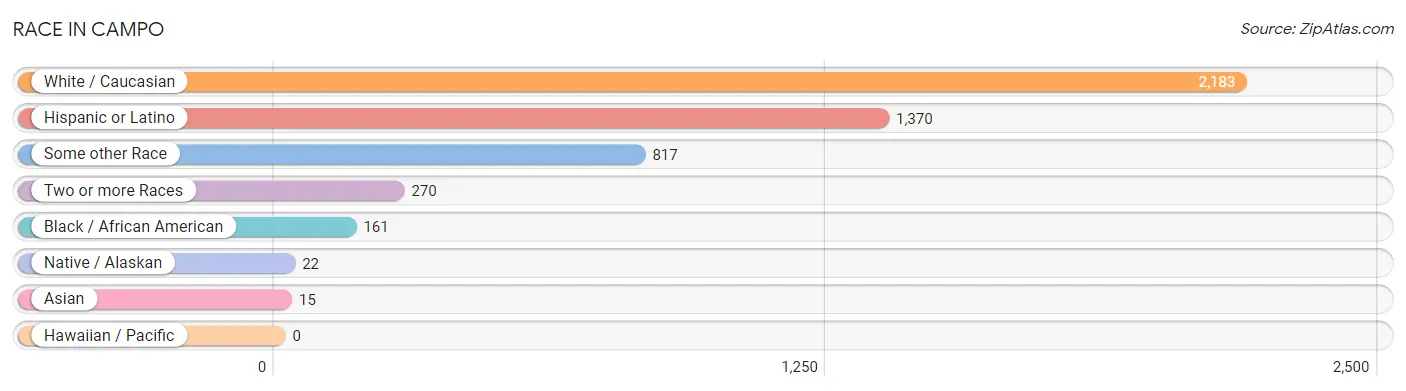
| Race | # Population | % Population |
| Asian | 15 | 0.4% |
| Black / African American | 161 | 4.6% |
| Hawaiian / Pacific | 0 | 0.0% |
| Hispanic or Latino | 1,370 | 39.5% |
| Native / Alaskan | 22 | 0.6% |
| White / Caucasian | 2,183 | 62.9% |
| Two or more Races | 270 | 7.8% |
| Some other Race | 817 | 23.6% |
| Total | 3,468 | 100.0% |
Ancestry in Campo
The most populous ancestries reported in Campo are Mexican (1,370 | 39.5%), German (471 | 13.6%), Irish (361 | 10.4%), English (211 | 6.1%), and Swedish (102 | 2.9%), together accounting for 72.5% of all Campo residents.
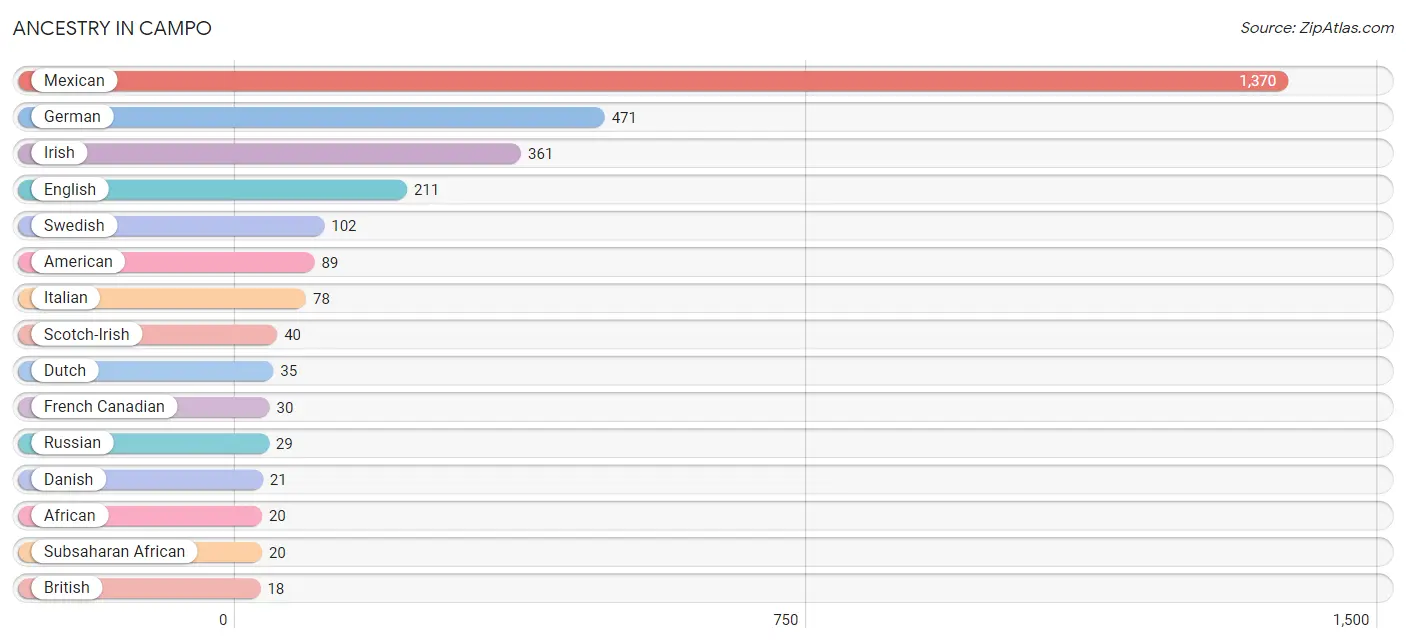
| Ancestry | # Population | % Population |
| African | 20 | 0.6% |
| American | 89 | 2.6% |
| British | 18 | 0.5% |
| Danish | 21 | 0.6% |
| Dutch | 35 | 1.0% |
| English | 211 | 6.1% |
| French | 8 | 0.2% |
| French Canadian | 30 | 0.9% |
| German | 471 | 13.6% |
| Irish | 361 | 10.4% |
| Italian | 78 | 2.2% |
| Korean | 8 | 0.2% |
| Mexican | 1,370 | 39.5% |
| Mexican American Indian | 18 | 0.5% |
| Native Hawaiian | 8 | 0.2% |
| Norwegian | 17 | 0.5% |
| Polish | 17 | 0.5% |
| Portuguese | 16 | 0.5% |
| Russian | 29 | 0.8% |
| Scotch-Irish | 40 | 1.1% |
| Scottish | 6 | 0.2% |
| Sri Lankan | 4 | 0.1% |
| Subsaharan African | 20 | 0.6% |
| Swedish | 102 | 2.9% |
| Thai | 11 | 0.3% | View All 25 Rows |
Immigrants in Campo
The most numerous immigrant groups reported in Campo came from Central America (404 | 11.7%), Latin America (404 | 11.7%), Mexico (404 | 11.7%), Asia (9 | 0.3%), and India (9 | 0.3%), together accounting for 35.5% of all Campo residents.
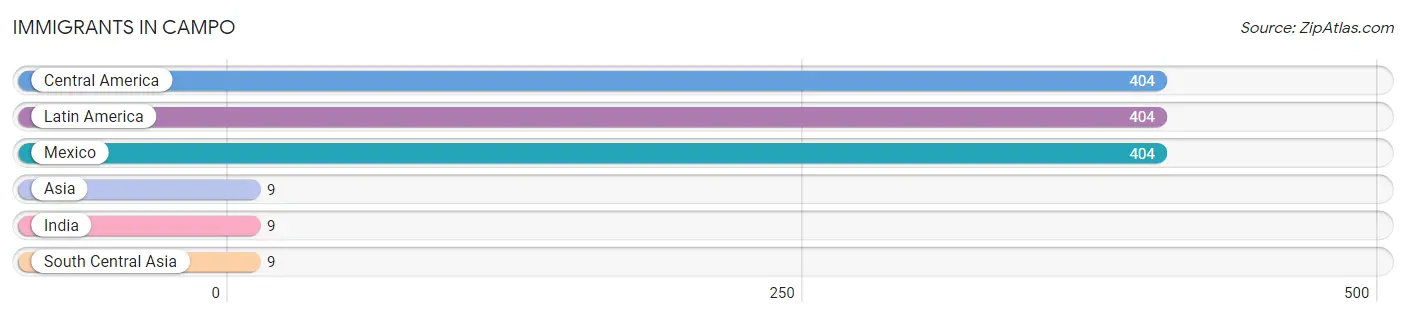
| Immigration Origin | # Population | % Population |
| Asia | 9 | 0.3% |
| Central America | 404 | 11.7% |
| India | 9 | 0.3% |
| Latin America | 404 | 11.7% |
| Mexico | 404 | 11.7% |
| South Central Asia | 9 | 0.3% | View All 6 Rows |
Sex and Age in Campo
Sex and Age in Campo
The most populous age groups in Campo are 10 to 14 Years (247 | 12.0%) for men and Under 5 Years (180 | 12.7%) for women.
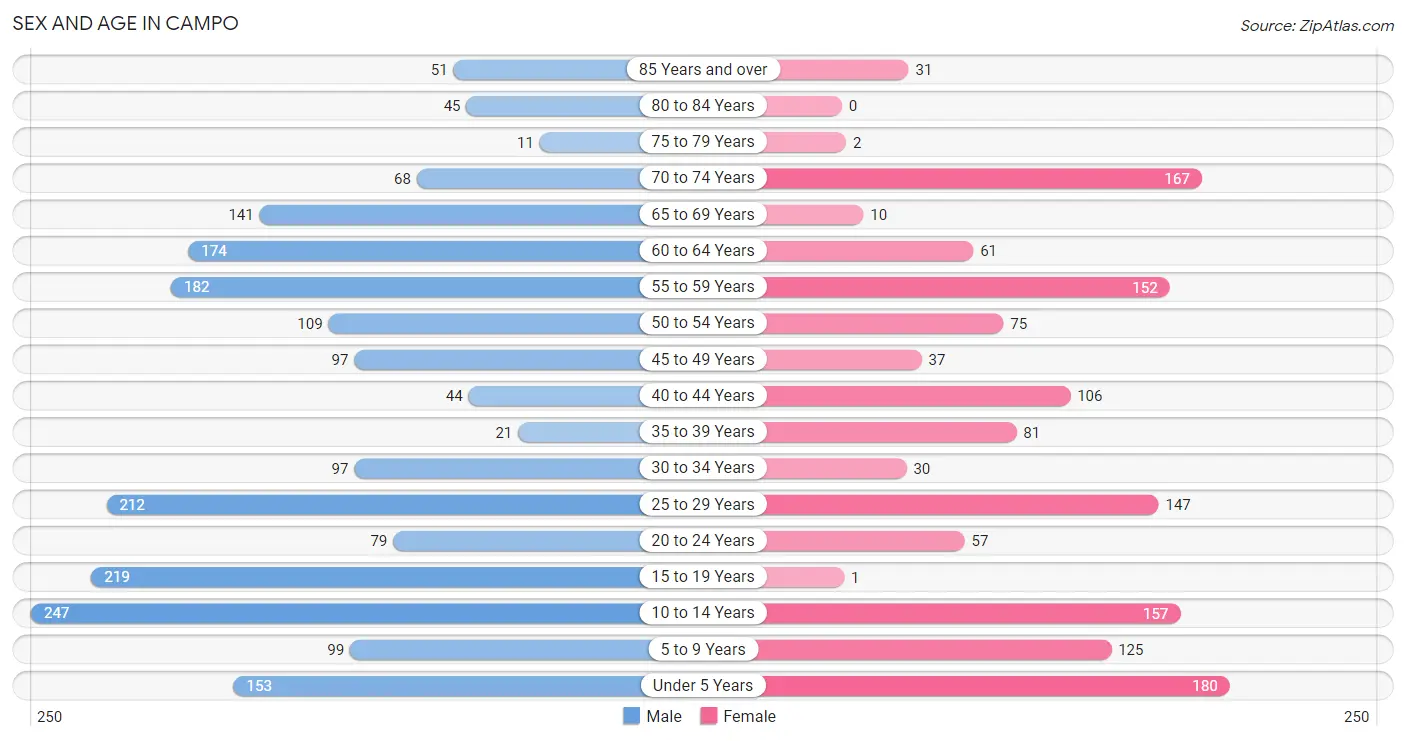
| Age Bracket | Male | Female |
| Under 5 Years | 153 (7.5%) | 180 (12.7%) |
| 5 to 9 Years | 99 (4.8%) | 125 (8.8%) |
| 10 to 14 Years | 247 (12.0%) | 157 (11.1%) |
| 15 to 19 Years | 219 (10.7%) | 1 (0.1%) |
| 20 to 24 Years | 79 (3.9%) | 57 (4.0%) |
| 25 to 29 Years | 212 (10.3%) | 147 (10.4%) |
| 30 to 34 Years | 97 (4.7%) | 30 (2.1%) |
| 35 to 39 Years | 21 (1.0%) | 81 (5.7%) |
| 40 to 44 Years | 44 (2.1%) | 106 (7.5%) |
| 45 to 49 Years | 97 (4.7%) | 37 (2.6%) |
| 50 to 54 Years | 109 (5.3%) | 75 (5.3%) |
| 55 to 59 Years | 182 (8.9%) | 152 (10.7%) |
| 60 to 64 Years | 174 (8.5%) | 61 (4.3%) |
| 65 to 69 Years | 141 (6.9%) | 10 (0.7%) |
| 70 to 74 Years | 68 (3.3%) | 167 (11.8%) |
| 75 to 79 Years | 11 (0.5%) | 2 (0.1%) |
| 80 to 84 Years | 45 (2.2%) | 0 (0.0%) |
| 85 Years and over | 51 (2.5%) | 31 (2.2%) |
| Total | 2,049 (100.0%) | 1,419 (100.0%) |
Families and Households in Campo
Median Family Size in Campo
The median family size in Campo is 3.74 persons per family, with married-couple families (566 | 75.9%) accounting for the largest median family size of 3.99 persons per family. On the other hand, single male/father families (48 | 6.4%) represent the smallest median family size with 2.40 persons per family.
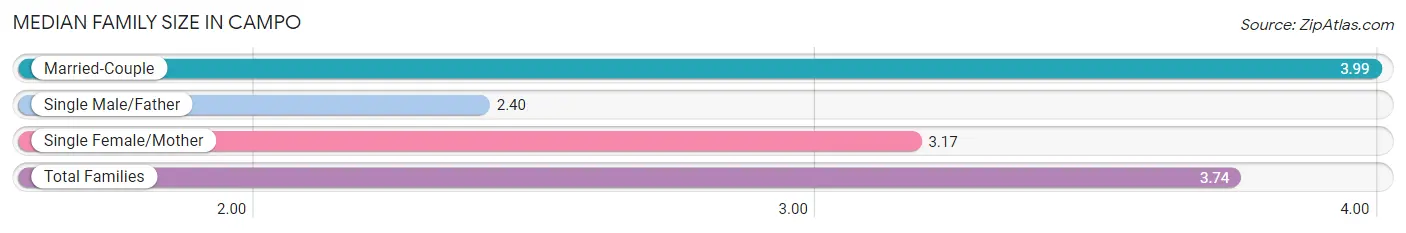
| Family Type | # Families | Family Size |
| Married-Couple | 566 (75.9%) | 3.99 |
| Single Male/Father | 48 (6.4%) | 2.40 |
| Single Female/Mother | 132 (17.7%) | 3.17 |
| Total Families | 746 (100.0%) | 3.74 |
Median Household Size in Campo
The median household size in Campo is 3.30 persons per household, with single male/father households (48 | 4.9%) accounting for the largest median household size of 4.08 persons per household. non-family households (240 | 24.3%) represent the smallest median household size with 1.30 persons per household.
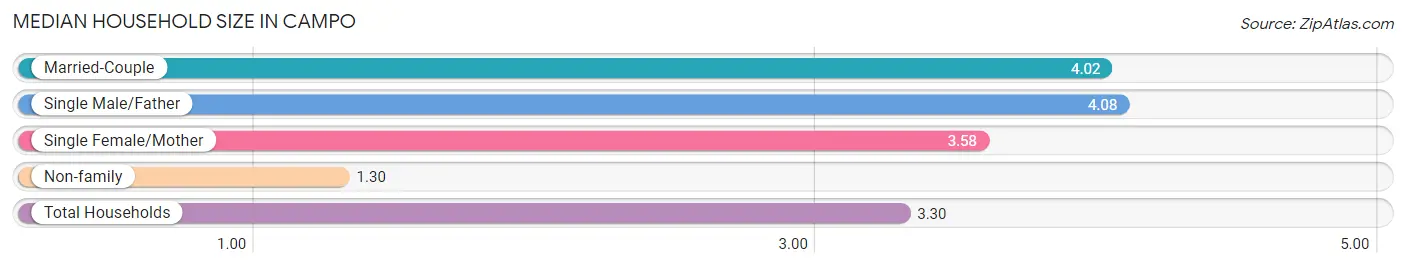
| Household Type | # Households | Household Size |
| Married-Couple | 566 (57.4%) | 4.02 |
| Single Male/Father | 48 (4.9%) | 4.08 |
| Single Female/Mother | 132 (13.4%) | 3.58 |
| Non-family | 240 (24.3%) | 1.30 |
| Total Households | 986 (100.0%) | 3.30 |
Household Size by Marriage Status in Campo
Out of a total of 986 households in Campo, 746 (75.7%) are family households, while 240 (24.3%) are nonfamily households. The most numerous type of family households are 2-person households, comprising 234, and the most common type of nonfamily households are 1-person households, comprising 178.
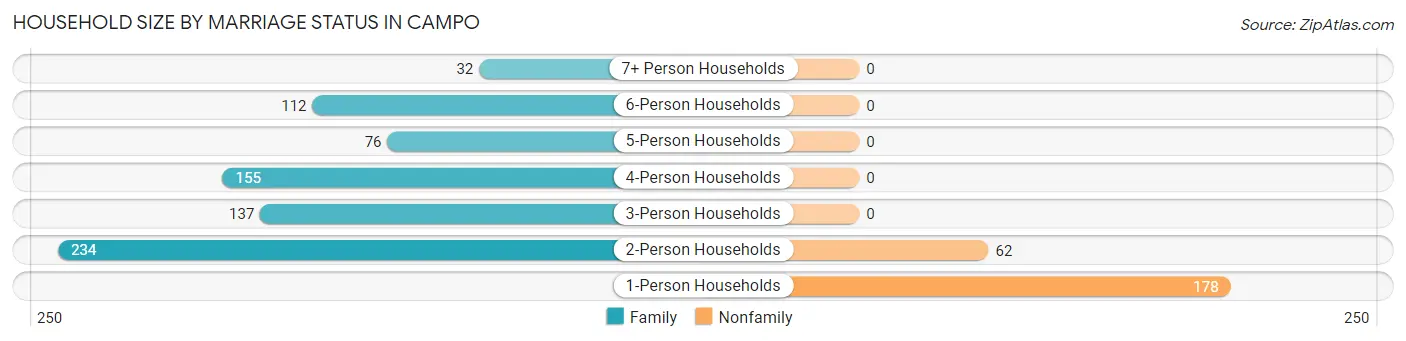
| Household Size | Family Households | Nonfamily Households |
| 1-Person Households | - | 178 (18.0%) |
| 2-Person Households | 234 (23.7%) | 62 (6.3%) |
| 3-Person Households | 137 (13.9%) | 0 (0.0%) |
| 4-Person Households | 155 (15.7%) | 0 (0.0%) |
| 5-Person Households | 76 (7.7%) | 0 (0.0%) |
| 6-Person Households | 112 (11.4%) | 0 (0.0%) |
| 7+ Person Households | 32 (3.3%) | 0 (0.0%) |
| Total | 746 (75.7%) | 240 (24.3%) |
Female Fertility in Campo
Fertility by Age in Campo
| Age Bracket | Women with Births | Births / 1,000 Women |
| 15 to 19 years | 0 (0.0%) | 0.0 |
| 20 to 34 years | 0 (0.0%) | 0.0 |
| 35 to 50 years | 0 (0.0%) | 0.0 |
| Total | 0 (0.0%) | 0.0 |
Fertility by Age by Marriage Status in Campo
| Age Bracket | Married | Unmarried |
| 15 to 19 years | 0 (0.0%) | 0 (0.0%) |
| 20 to 34 years | 0 (0.0%) | 0 (0.0%) |
| 35 to 50 years | 0 (0.0%) | 0 (0.0%) |
| Total | 0 (0.0%) | 0 (0.0%) |
Fertility by Education in Campo
| Educational Attainment | Women with Births | Births / 1,000 Women |
| Less than High School | 0 (0.0%) | 0.0 |
| High School Diploma | 0 (0.0%) | 0.0 |
| College or Associate's Degree | 0 (0.0%) | 0.0 |
| Bachelor's Degree | 0 (0.0%) | 0.0 |
| Graduate Degree | 0 (0.0%) | 0.0 |
| Total | 0 (0.0%) | 0.0 |
Fertility by Education by Marriage Status in Campo
| Educational Attainment | Married | Unmarried |
| Less than High School | 0 (0.0%) | 0 (0.0%) |
| High School Diploma | 0 (0.0%) | 0 (0.0%) |
| College or Associate's Degree | 0 (0.0%) | 0 (0.0%) |
| Bachelor's Degree | 0 (0.0%) | 0 (0.0%) |
| Graduate Degree | 0 (0.0%) | 0 (0.0%) |
| Total | 0 (0.0%) | 0 (0.0%) |
Employment Characteristics in Campo
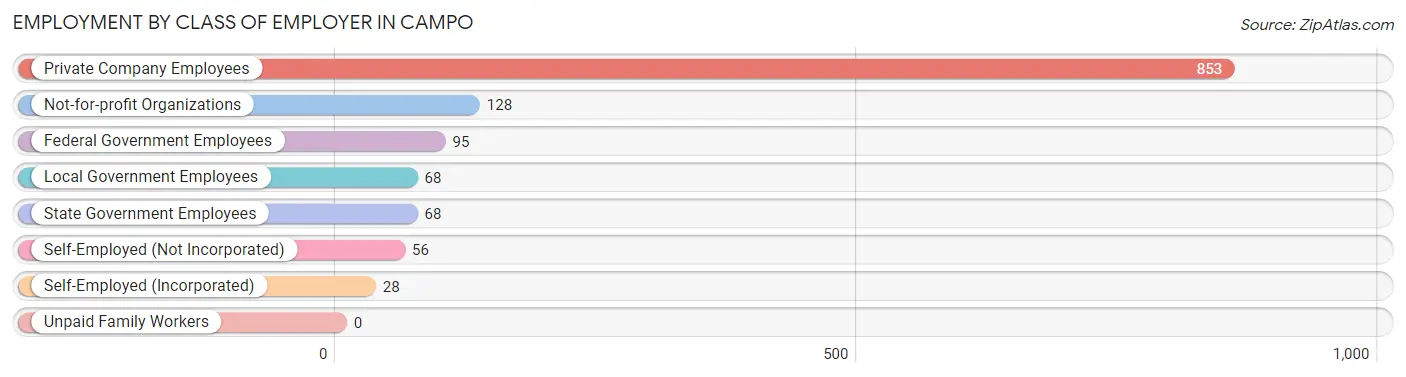
Employment by Class of Employer in Campo
Among the 1,296 employed individuals in Campo, private company employees (853 | 65.8%), not-for-profit organizations (128 | 9.9%), and federal government employees (95 | 7.3%) make up the most common classes of employment.
| Employer Class | # Employees | % Employees |
| Private Company Employees | 853 | 65.8% |
| Self-Employed (Incorporated) | 28 | 2.2% |
| Self-Employed (Not Incorporated) | 56 | 4.3% |
| Not-for-profit Organizations | 128 | 9.9% |
| Local Government Employees | 68 | 5.2% |
| State Government Employees | 68 | 5.2% |
| Federal Government Employees | 95 | 7.3% |
| Unpaid Family Workers | 0 | 0.0% |
| Total | 1,296 | 100.0% |
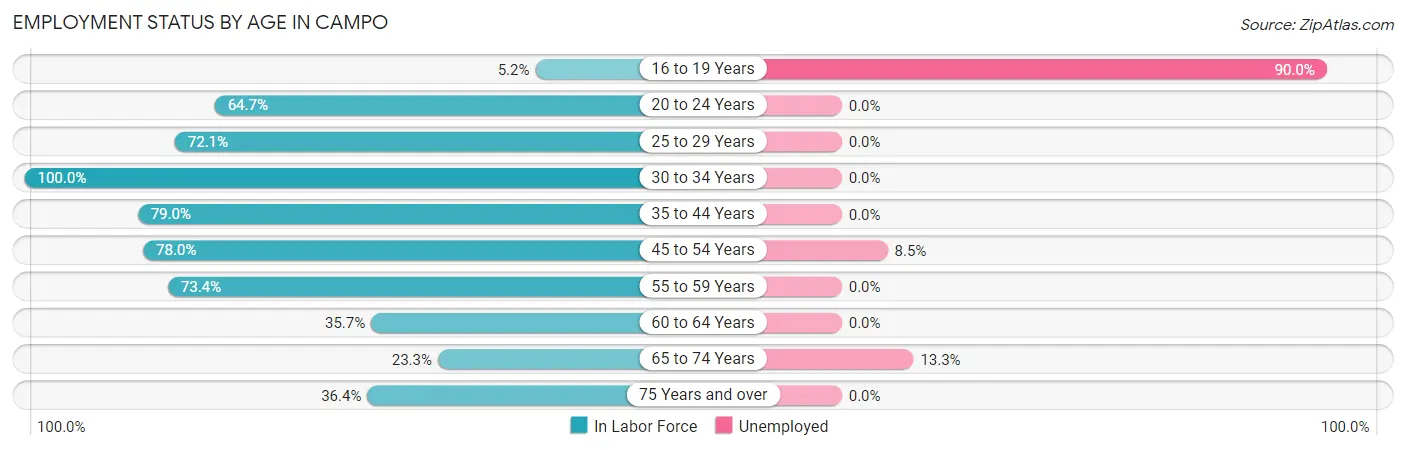
Employment Status by Age in Campo
According to the labor force statistics for Campo, out of the total population over 16 years of age (2,480), 56.5% or 1,401 individuals are in the labor force, with 3.1% or 43 of them unemployed. The age group with the highest labor force participation rate is 30 to 34 years, with 100.0% or 127 individuals in the labor force. Within the labor force, the 16 to 19 years age range has the highest percentage of unemployed individuals, with 90.0% or 9 of them being unemployed.
| Age Bracket | In Labor Force | Unemployed |
| 16 to 19 Years | 10 (5.2%) | 9 (90.0%) |
| 20 to 24 Years | 88 (64.7%) | 0 (0.0%) |
| 25 to 29 Years | 259 (72.1%) | 0 (0.0%) |
| 30 to 34 Years | 127 (100.0%) | 0 (0.0%) |
| 35 to 44 Years | 199 (79.0%) | 0 (0.0%) |
| 45 to 54 Years | 248 (78.0%) | 21 (8.5%) |
| 55 to 59 Years | 245 (73.4%) | 0 (0.0%) |
| 60 to 64 Years | 84 (35.7%) | 0 (0.0%) |
| 65 to 74 Years | 90 (23.3%) | 12 (13.3%) |
| 75 Years and over | 51 (36.4%) | 0 (0.0%) |
| Total | 1,401 (56.5%) | 43 (3.1%) |
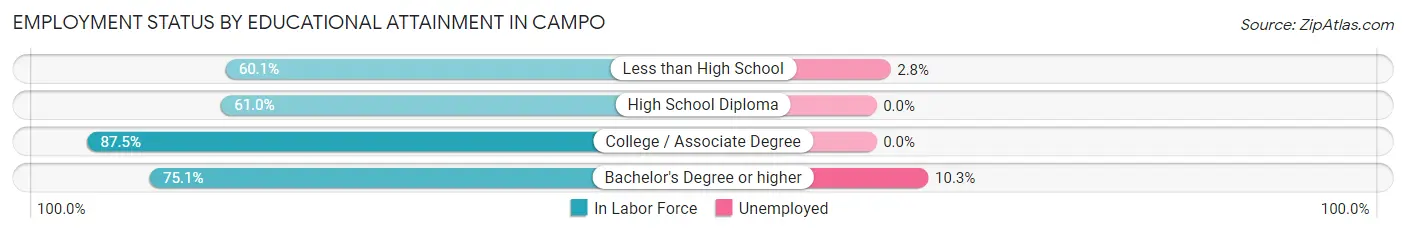
Employment Status by Educational Attainment in Campo
According to labor force statistics for Campo, 71.5% of individuals (1,162) out of the total population between 25 and 64 years of age (1,625) are in the labor force, with 1.9% or 22 of them being unemployed. The group with the highest labor force participation rate are those with the educational attainment of college / associate degree, with 87.5% or 491 individuals in the labor force. Within the labor force, individuals with bachelor's degree or higher education have the highest percentage of unemployment, with 10.3% or 14 of them being unemployed.
| Educational Attainment | In Labor Force | Unemployed |
| Less than High School | 253 (60.1%) | 12 (2.8%) |
| High School Diploma | 282 (61.0%) | 0 (0.0%) |
| College / Associate Degree | 491 (87.5%) | 0 (0.0%) |
| Bachelor's Degree or higher | 136 (75.1%) | 19 (10.3%) |
| Total | 1,162 (71.5%) | 31 (1.9%) |
Employment Occupations by Sex in Campo
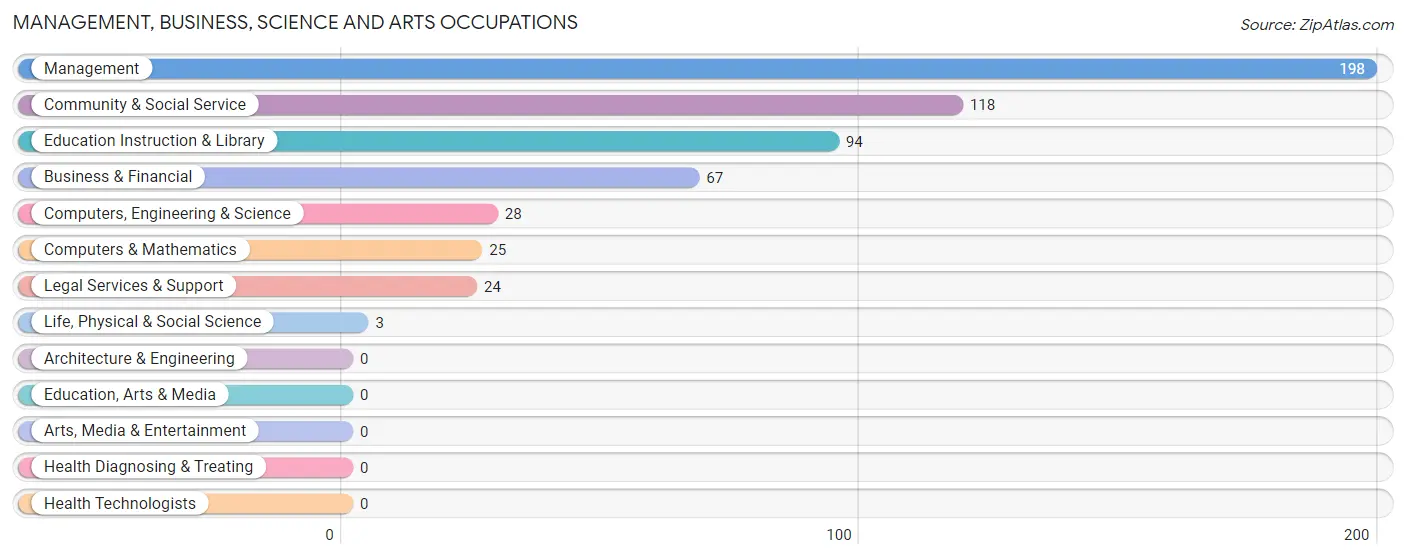
Management, Business, Science and Arts Occupations
The most common Management, Business, Science and Arts occupations in Campo are Management (198 | 15.1%), Community & Social Service (118 | 9.0%), Education Instruction & Library (94 | 7.1%), Business & Financial (67 | 5.1%), and Computers, Engineering & Science (28 | 2.1%).
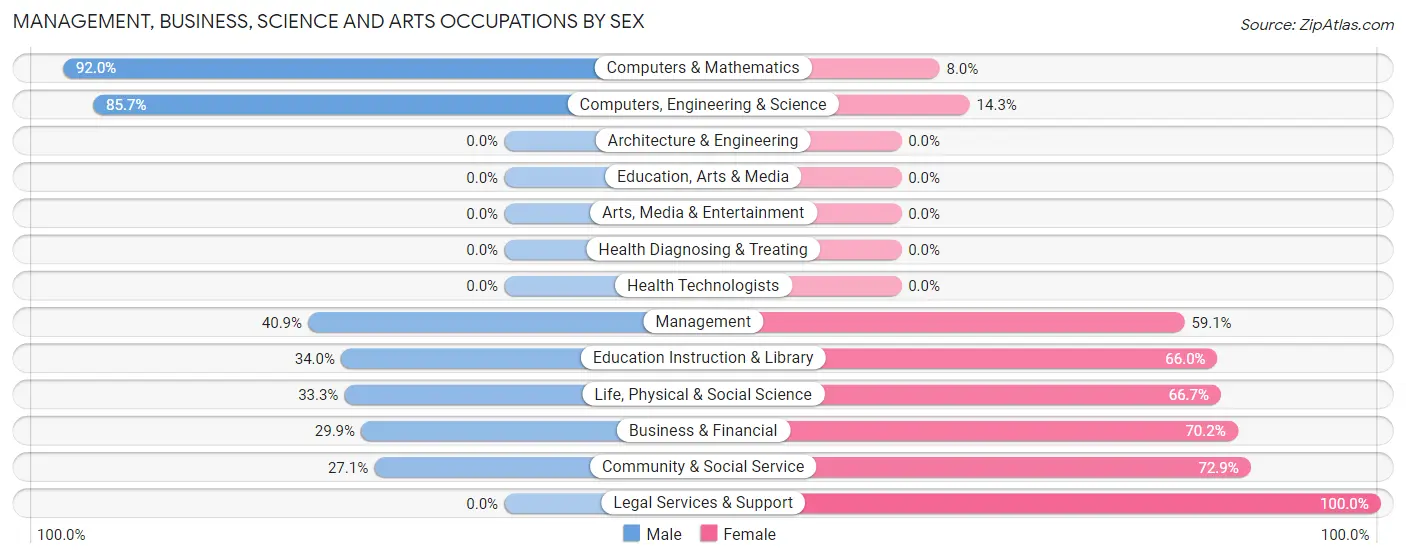
Management, Business, Science and Arts Occupations by Sex
Within the Management, Business, Science and Arts occupations in Campo, the most male-oriented occupations are Computers & Mathematics (92.0%), Computers, Engineering & Science (85.7%), and Management (40.9%), while the most female-oriented occupations are Legal Services & Support (100.0%), Community & Social Service (72.9%), and Business & Financial (70.2%).
| Occupation | Male | Female |
| Management | 81 (40.9%) | 117 (59.1%) |
| Business & Financial | 20 (29.8%) | 47 (70.2%) |
| Computers, Engineering & Science | 24 (85.7%) | 4 (14.3%) |
| Computers & Mathematics | 23 (92.0%) | 2 (8.0%) |
| Architecture & Engineering | 0 (0.0%) | 0 (0.0%) |
| Life, Physical & Social Science | 1 (33.3%) | 2 (66.7%) |
| Community & Social Service | 32 (27.1%) | 86 (72.9%) |
| Education, Arts & Media | 0 (0.0%) | 0 (0.0%) |
| Legal Services & Support | 0 (0.0%) | 24 (100.0%) |
| Education Instruction & Library | 32 (34.0%) | 62 (66.0%) |
| Arts, Media & Entertainment | 0 (0.0%) | 0 (0.0%) |
| Health Diagnosing & Treating | 0 (0.0%) | 0 (0.0%) |
| Health Technologists | 0 (0.0%) | 0 (0.0%) |
| Total (Category) | 157 (38.2%) | 254 (61.8%) |
| Total (Overall) | 740 (56.3%) | 574 (43.7%) |
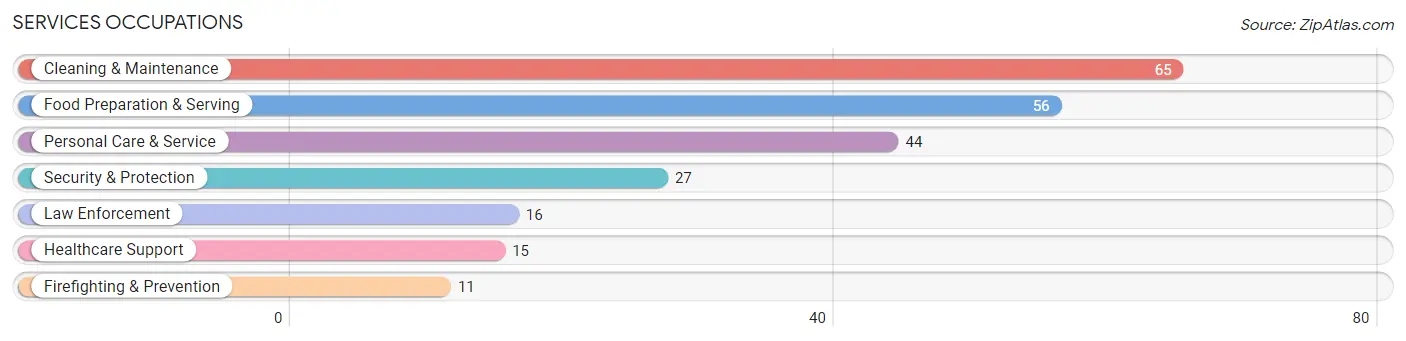
Services Occupations
The most common Services occupations in Campo are Cleaning & Maintenance (65 | 5.0%), Food Preparation & Serving (56 | 4.3%), Personal Care & Service (44 | 3.4%), Security & Protection (27 | 2.1%), and Law Enforcement (16 | 1.2%).
Services Occupations by Sex
Within the Services occupations in Campo, the most male-oriented occupations are Healthcare Support (100.0%), Security & Protection (100.0%), and Firefighting & Prevention (100.0%), while the most female-oriented occupations are Personal Care & Service (100.0%), and Food Preparation & Serving (82.1%).

| Occupation | Male | Female |
| Healthcare Support | 15 (100.0%) | 0 (0.0%) |
| Security & Protection | 27 (100.0%) | 0 (0.0%) |
| Firefighting & Prevention | 11 (100.0%) | 0 (0.0%) |
| Law Enforcement | 16 (100.0%) | 0 (0.0%) |
| Food Preparation & Serving | 10 (17.9%) | 46 (82.1%) |
| Cleaning & Maintenance | 65 (100.0%) | 0 (0.0%) |
| Personal Care & Service | 0 (0.0%) | 44 (100.0%) |
| Total (Category) | 117 (56.5%) | 90 (43.5%) |
| Total (Overall) | 740 (56.3%) | 574 (43.7%) |
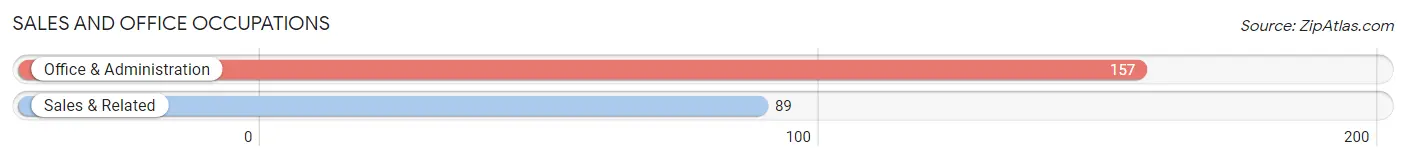
Sales and Office Occupations
The most common Sales and Office occupations in Campo are Office & Administration (157 | 11.9%), and Sales & Related (89 | 6.8%).
Sales and Office Occupations by Sex
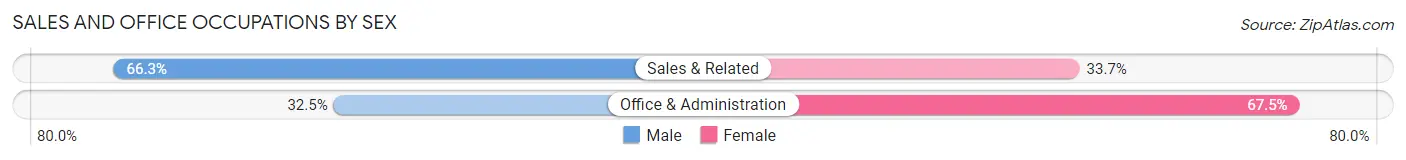
| Occupation | Male | Female |
| Sales & Related | 59 (66.3%) | 30 (33.7%) |
| Office & Administration | 51 (32.5%) | 106 (67.5%) |
| Total (Category) | 110 (44.7%) | 136 (55.3%) |
| Total (Overall) | 740 (56.3%) | 574 (43.7%) |
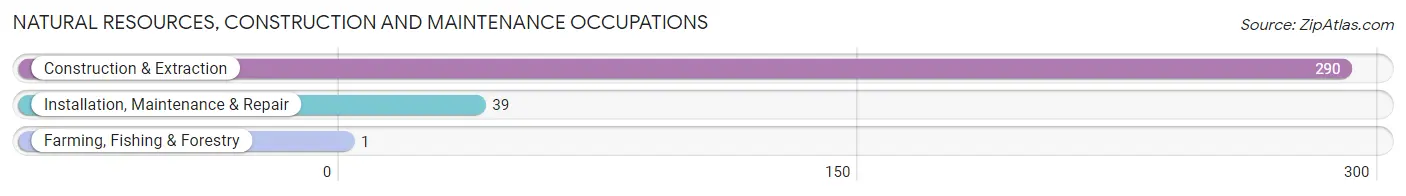
Natural Resources, Construction and Maintenance Occupations
The most common Natural Resources, Construction and Maintenance occupations in Campo are Construction & Extraction (290 | 22.1%), Installation, Maintenance & Repair (39 | 3.0%), and Farming, Fishing & Forestry (1 | 0.1%).
Natural Resources, Construction and Maintenance Occupations by Sex
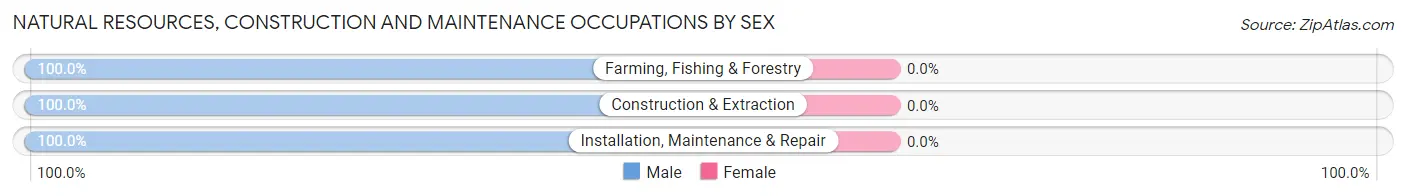
| Occupation | Male | Female |
| Farming, Fishing & Forestry | 1 (100.0%) | 0 (0.0%) |
| Construction & Extraction | 290 (100.0%) | 0 (0.0%) |
| Installation, Maintenance & Repair | 39 (100.0%) | 0 (0.0%) |
| Total (Category) | 330 (100.0%) | 0 (0.0%) |
| Total (Overall) | 740 (56.3%) | 574 (43.7%) |
Production, Transportation and Moving Occupations
The most common Production, Transportation and Moving occupations in Campo are Transportation (83 | 6.3%), Production (26 | 2.0%), and Material Moving (11 | 0.8%).
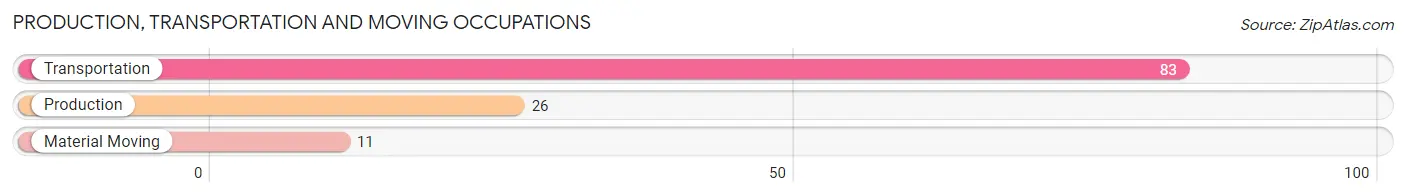
Production, Transportation and Moving Occupations by Sex
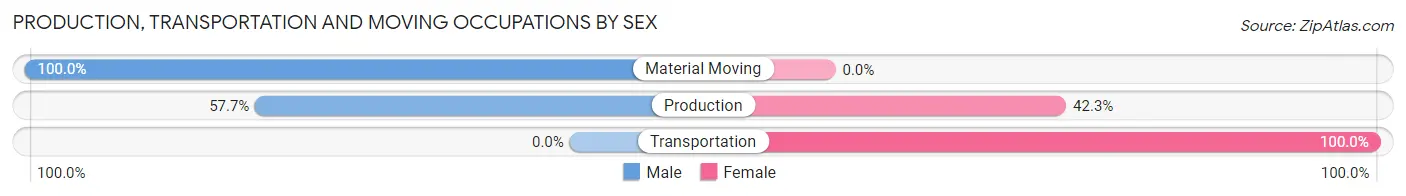
| Occupation | Male | Female |
| Production | 15 (57.7%) | 11 (42.3%) |
| Transportation | 0 (0.0%) | 83 (100.0%) |
| Material Moving | 11 (100.0%) | 0 (0.0%) |
| Total (Category) | 26 (21.7%) | 94 (78.3%) |
| Total (Overall) | 740 (56.3%) | 574 (43.7%) |
Employment Industries by Sex in Campo
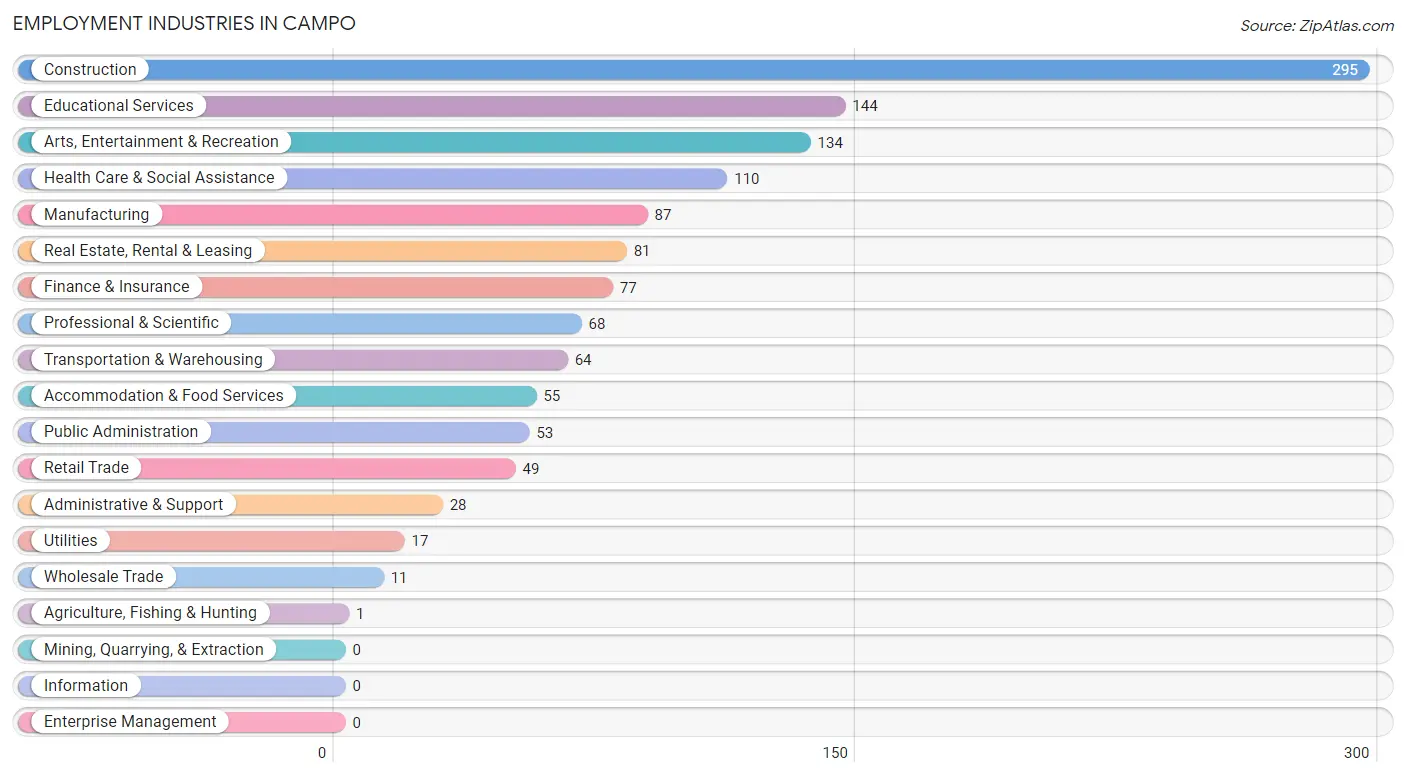
Employment Industries in Campo
The major employment industries in Campo include Construction (295 | 22.5%), Educational Services (144 | 11.0%), Arts, Entertainment & Recreation (134 | 10.2%), Health Care & Social Assistance (110 | 8.4%), and Manufacturing (87 | 6.6%).
Employment Industries by Sex in Campo
The Campo industries that see more men than women are Agriculture, Fishing & Hunting (100.0%), Manufacturing (100.0%), and Wholesale Trade (100.0%), whereas the industries that tend to have a higher number of women are Finance & Insurance (100.0%), Health Care & Social Assistance (79.1%), and Educational Services (77.8%).
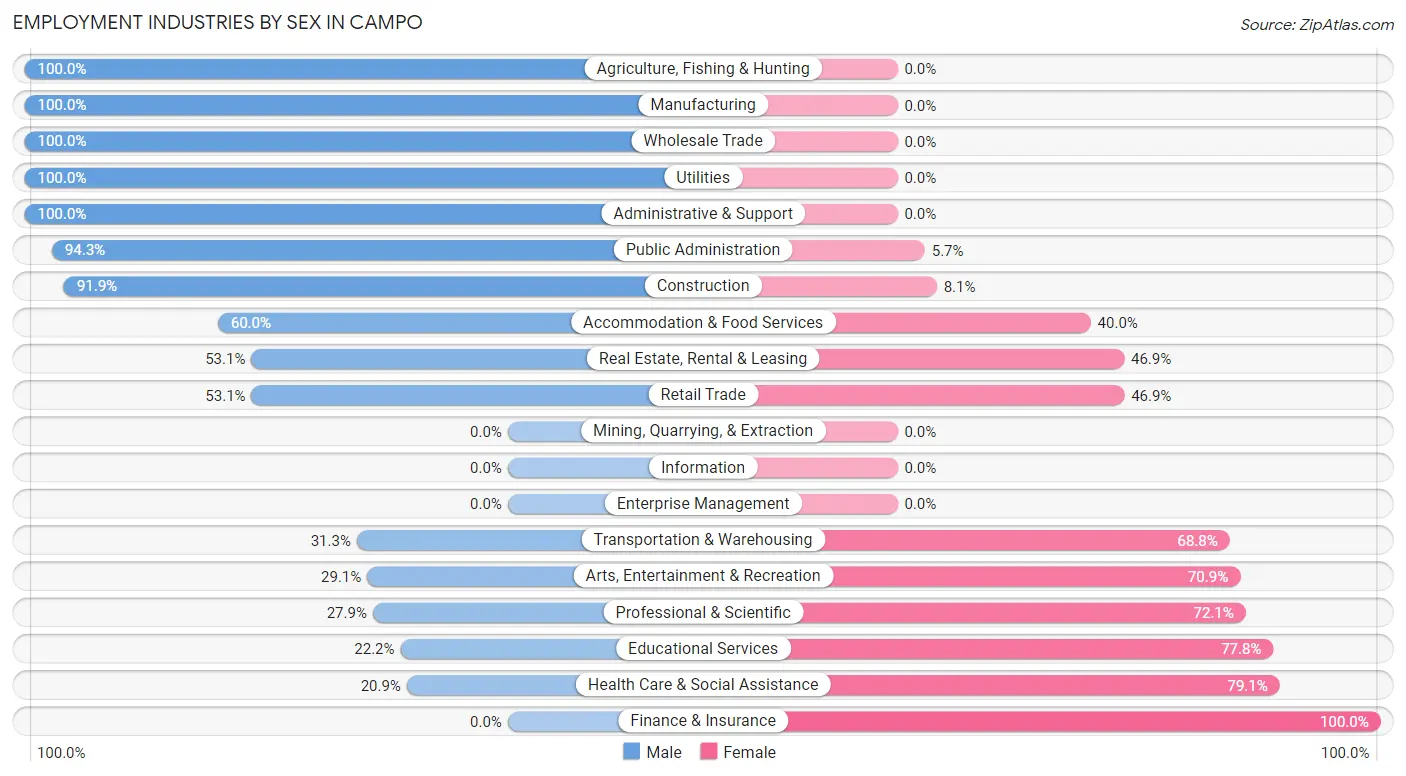
| Industry | Male | Female |
| Agriculture, Fishing & Hunting | 1 (100.0%) | 0 (0.0%) |
| Mining, Quarrying, & Extraction | 0 (0.0%) | 0 (0.0%) |
| Construction | 271 (91.9%) | 24 (8.1%) |
| Manufacturing | 87 (100.0%) | 0 (0.0%) |
| Wholesale Trade | 11 (100.0%) | 0 (0.0%) |
| Retail Trade | 26 (53.1%) | 23 (46.9%) |
| Transportation & Warehousing | 20 (31.2%) | 44 (68.8%) |
| Utilities | 17 (100.0%) | 0 (0.0%) |
| Information | 0 (0.0%) | 0 (0.0%) |
| Finance & Insurance | 0 (0.0%) | 77 (100.0%) |
| Real Estate, Rental & Leasing | 43 (53.1%) | 38 (46.9%) |
| Professional & Scientific | 19 (27.9%) | 49 (72.1%) |
| Enterprise Management | 0 (0.0%) | 0 (0.0%) |
| Administrative & Support | 28 (100.0%) | 0 (0.0%) |
| Educational Services | 32 (22.2%) | 112 (77.8%) |
| Health Care & Social Assistance | 23 (20.9%) | 87 (79.1%) |
| Arts, Entertainment & Recreation | 39 (29.1%) | 95 (70.9%) |
| Accommodation & Food Services | 33 (60.0%) | 22 (40.0%) |
| Public Administration | 50 (94.3%) | 3 (5.7%) |
| Total | 740 (56.3%) | 574 (43.7%) |
Education in Campo
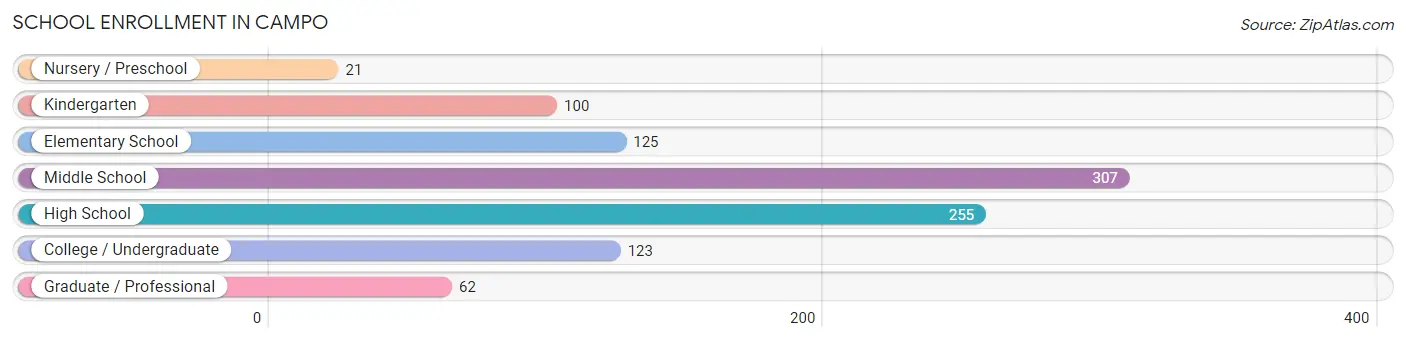
School Enrollment in Campo
The most common levels of schooling among the 993 students in Campo are middle school (307 | 30.9%), high school (255 | 25.7%), and elementary school (125 | 12.6%).
| School Level | # Students | % Students |
| Nursery / Preschool | 21 | 2.1% |
| Kindergarten | 100 | 10.1% |
| Elementary School | 125 | 12.6% |
| Middle School | 307 | 30.9% |
| High School | 255 | 25.7% |
| College / Undergraduate | 123 | 12.4% |
| Graduate / Professional | 62 | 6.2% |
| Total | 993 | 100.0% |
School Enrollment by Age by Funding Source in Campo
Out of a total of 993 students who are enrolled in schools in Campo, 86 (8.7%) attend a private institution, while the remaining 907 (91.3%) are enrolled in public schools. The age group of 3 to 4 year olds has the highest likelihood of being enrolled in private schools, with 19 (90.5% in the age bracket) enrolled. Conversely, the age group of 10 to 14 year olds has the lowest likelihood of being enrolled in a private school, with 404 (100.0% in the age bracket) attending a public institution.
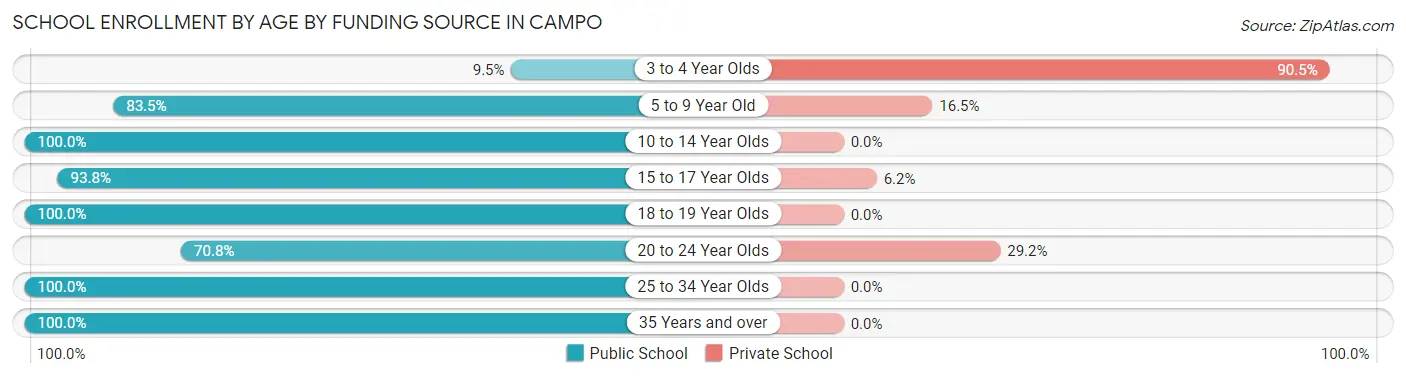
| Age Bracket | Public School | Private School |
| 3 to 4 Year Olds | 2 (9.5%) | 19 (90.5%) |
| 5 to 9 Year Old | 187 (83.5%) | 37 (16.5%) |
| 10 to 14 Year Olds | 404 (100.0%) | 0 (0.0%) |
| 15 to 17 Year Olds | 137 (93.8%) | 9 (6.2%) |
| 18 to 19 Year Olds | 24 (100.0%) | 0 (0.0%) |
| 20 to 24 Year Olds | 51 (70.8%) | 21 (29.2%) |
| 25 to 34 Year Olds | 93 (100.0%) | 0 (0.0%) |
| 35 Years and over | 9 (100.0%) | 0 (0.0%) |
| Total | 907 (91.3%) | 86 (8.7%) |
Educational Attainment by Field of Study in Campo
Literature & languages (69 | 26.9%), business (64 | 24.9%), bio, nature & agricultural (46 | 17.9%), education (25 | 9.7%), and engineering (24 | 9.3%) are the most common fields of study among 257 individuals in Campo who have obtained a bachelor's degree or higher.
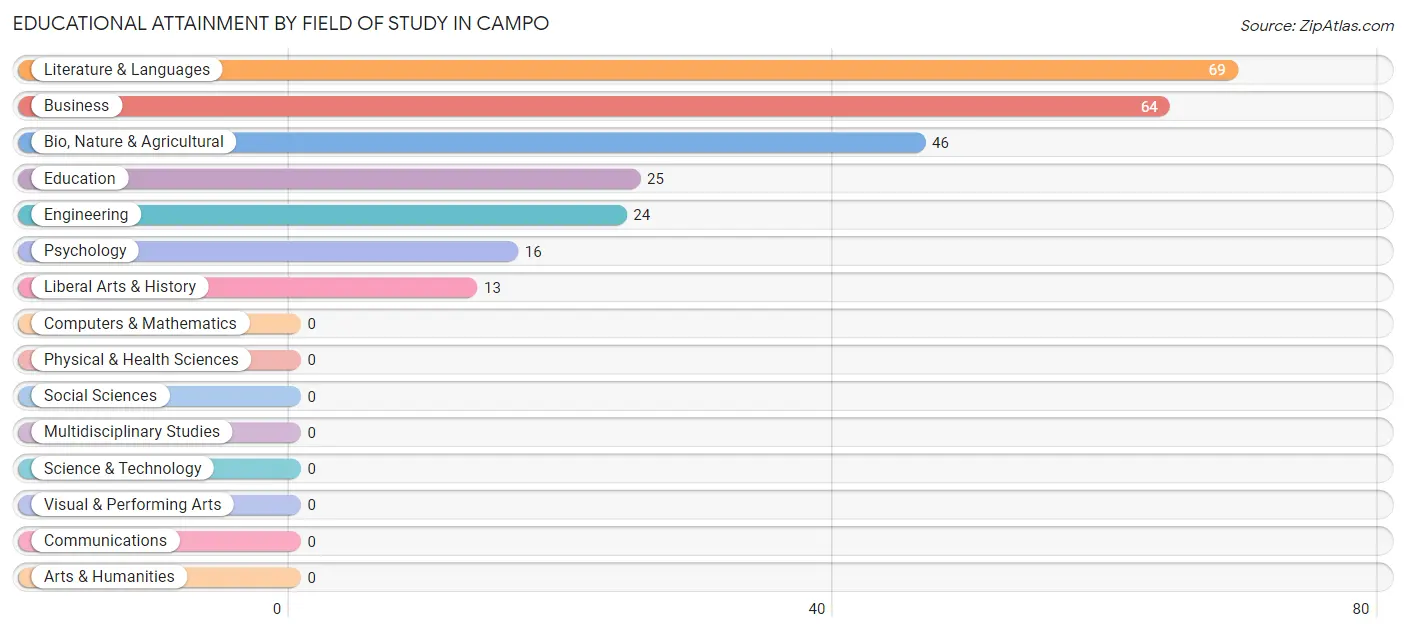
| Field of Study | # Graduates | % Graduates |
| Computers & Mathematics | 0 | 0.0% |
| Bio, Nature & Agricultural | 46 | 17.9% |
| Physical & Health Sciences | 0 | 0.0% |
| Psychology | 16 | 6.2% |
| Social Sciences | 0 | 0.0% |
| Engineering | 24 | 9.3% |
| Multidisciplinary Studies | 0 | 0.0% |
| Science & Technology | 0 | 0.0% |
| Business | 64 | 24.9% |
| Education | 25 | 9.7% |
| Literature & Languages | 69 | 26.9% |
| Liberal Arts & History | 13 | 5.1% |
| Visual & Performing Arts | 0 | 0.0% |
| Communications | 0 | 0.0% |
| Arts & Humanities | 0 | 0.0% |
| Total | 257 | 100.0% |
Transportation & Commute in Campo
Vehicle Availability by Sex in Campo
The most prevalent vehicle ownership categories in Campo are males with 2 vehicles (283, accounting for 39.8%) and females with 2 vehicles (150, making up 49.3%).
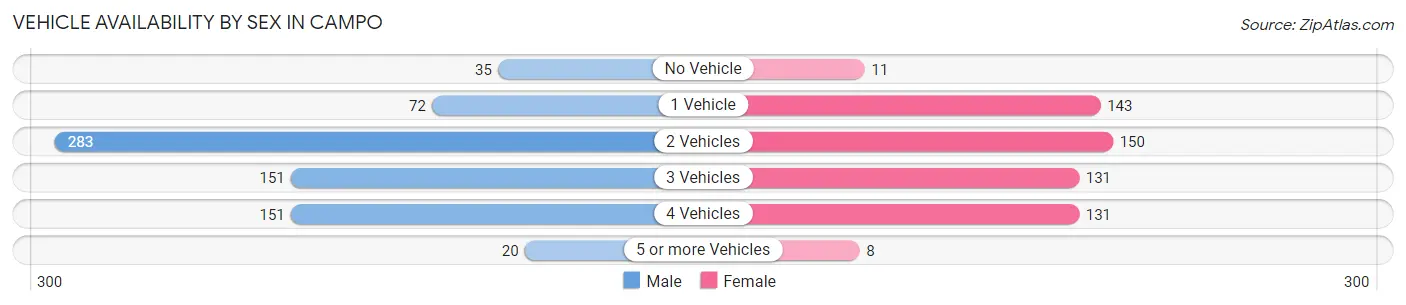
| Vehicles Available | Male | Female |
| No Vehicle | 35 (4.9%) | 11 (1.9%) |
| 1 Vehicle | 72 (10.1%) | 143 (24.9%) |
| 2 Vehicles | 283 (39.8%) | 150 (26.1%) |
| 3 Vehicles | 151 (21.2%) | 131 (22.8%) |
| 4 Vehicles | 151 (21.2%) | 131 (22.8%) |
| 5 or more Vehicles | 20 (2.8%) | 8 (1.4%) |
| Total | 712 (100.0%) | 574 (100.0%) |
Commute Time in Campo
The most frequently occuring commute durations in Campo are 60 to 89 minutes (401 commuters, 32.6%), 90 or more minutes (126 commuters, 10.2%), and 35 to 39 minutes (125 commuters, 10.2%).
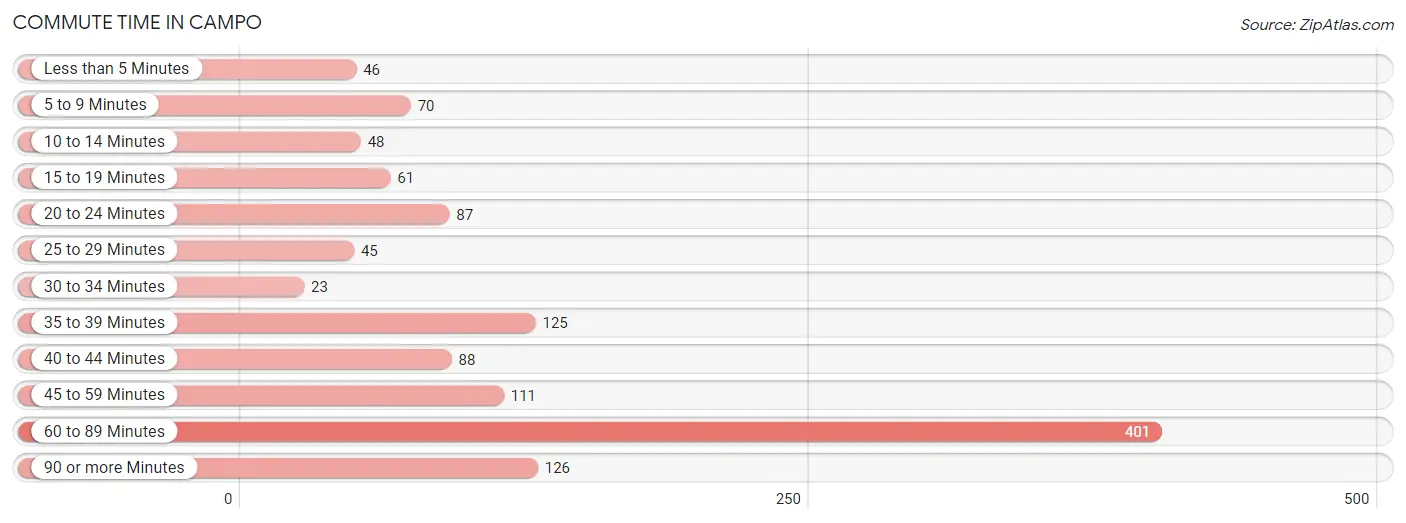
| Commute Time | # Commuters | % Commuters |
| Less than 5 Minutes | 46 | 3.7% |
| 5 to 9 Minutes | 70 | 5.7% |
| 10 to 14 Minutes | 48 | 3.9% |
| 15 to 19 Minutes | 61 | 5.0% |
| 20 to 24 Minutes | 87 | 7.1% |
| 25 to 29 Minutes | 45 | 3.7% |
| 30 to 34 Minutes | 23 | 1.9% |
| 35 to 39 Minutes | 125 | 10.2% |
| 40 to 44 Minutes | 88 | 7.1% |
| 45 to 59 Minutes | 111 | 9.0% |
| 60 to 89 Minutes | 401 | 32.6% |
| 90 or more Minutes | 126 | 10.2% |
Commute Time by Sex in Campo
The most common commute times in Campo are 60 to 89 minutes (243 commuters, 34.6%) for males and 60 to 89 minutes (158 commuters, 29.9%) for females.
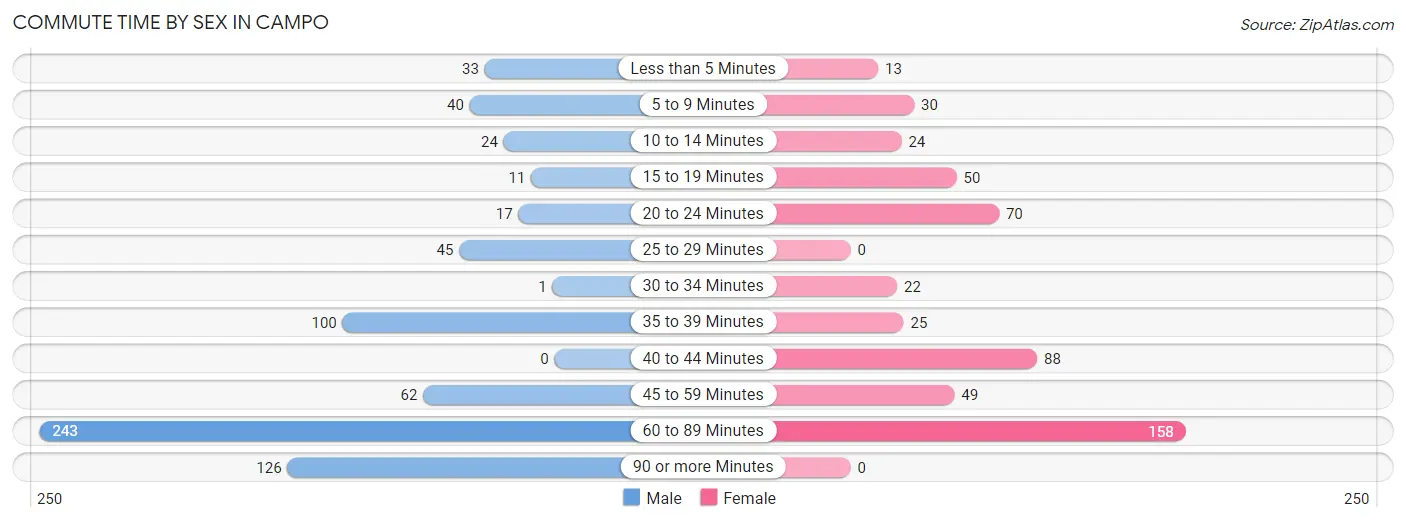
| Commute Time | Male | Female |
| Less than 5 Minutes | 33 (4.7%) | 13 (2.5%) |
| 5 to 9 Minutes | 40 (5.7%) | 30 (5.7%) |
| 10 to 14 Minutes | 24 (3.4%) | 24 (4.5%) |
| 15 to 19 Minutes | 11 (1.6%) | 50 (9.5%) |
| 20 to 24 Minutes | 17 (2.4%) | 70 (13.2%) |
| 25 to 29 Minutes | 45 (6.4%) | 0 (0.0%) |
| 30 to 34 Minutes | 1 (0.1%) | 22 (4.2%) |
| 35 to 39 Minutes | 100 (14.2%) | 25 (4.7%) |
| 40 to 44 Minutes | 0 (0.0%) | 88 (16.6%) |
| 45 to 59 Minutes | 62 (8.8%) | 49 (9.3%) |
| 60 to 89 Minutes | 243 (34.6%) | 158 (29.9%) |
| 90 or more Minutes | 126 (17.9%) | 0 (0.0%) |
Time of Departure to Work by Sex in Campo
The most frequent times of departure to work in Campo are 5:00 AM to 5:29 AM (164, 23.4%) for males and 12:00 AM to 4:59 AM (108, 20.4%) for females.
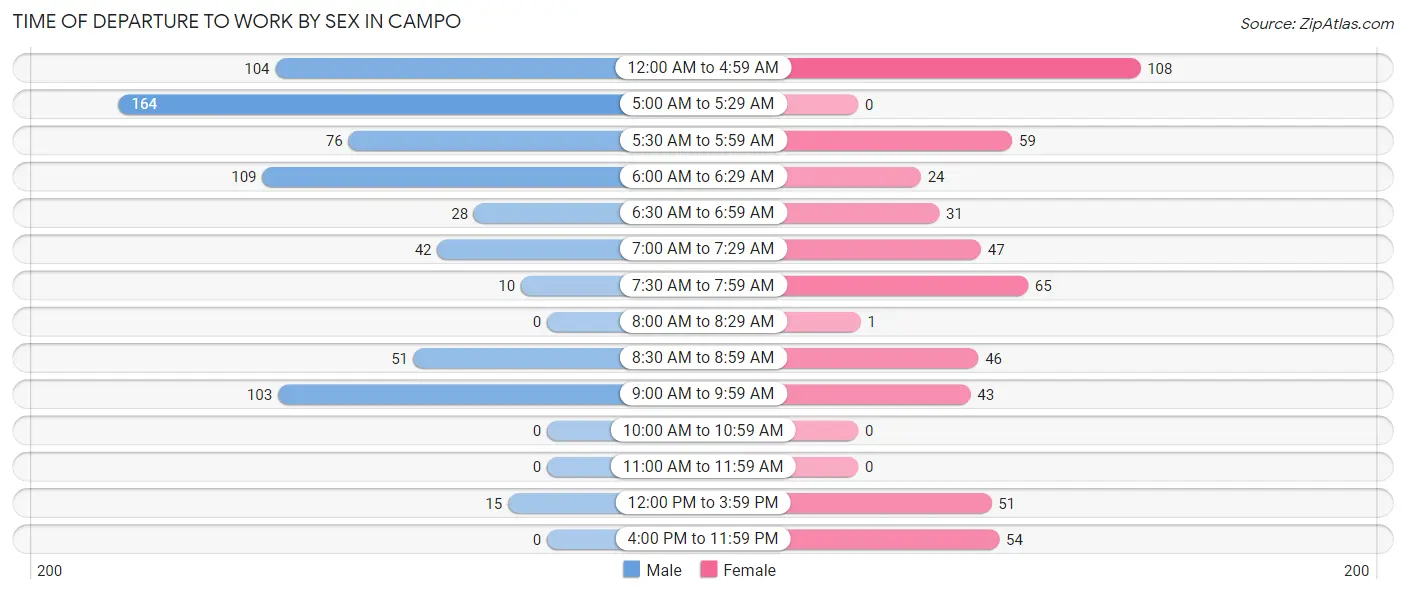
| Time of Departure | Male | Female |
| 12:00 AM to 4:59 AM | 104 (14.8%) | 108 (20.4%) |
| 5:00 AM to 5:29 AM | 164 (23.4%) | 0 (0.0%) |
| 5:30 AM to 5:59 AM | 76 (10.8%) | 59 (11.2%) |
| 6:00 AM to 6:29 AM | 109 (15.5%) | 24 (4.5%) |
| 6:30 AM to 6:59 AM | 28 (4.0%) | 31 (5.9%) |
| 7:00 AM to 7:29 AM | 42 (6.0%) | 47 (8.9%) |
| 7:30 AM to 7:59 AM | 10 (1.4%) | 65 (12.3%) |
| 8:00 AM to 8:29 AM | 0 (0.0%) | 1 (0.2%) |
| 8:30 AM to 8:59 AM | 51 (7.3%) | 46 (8.7%) |
| 9:00 AM to 9:59 AM | 103 (14.7%) | 43 (8.1%) |
| 10:00 AM to 10:59 AM | 0 (0.0%) | 0 (0.0%) |
| 11:00 AM to 11:59 AM | 0 (0.0%) | 0 (0.0%) |
| 12:00 PM to 3:59 PM | 15 (2.1%) | 51 (9.6%) |
| 4:00 PM to 11:59 PM | 0 (0.0%) | 54 (10.2%) |
| Total | 702 (100.0%) | 529 (100.0%) |
Housing Occupancy in Campo
Occupancy by Ownership in Campo
Of the total 986 dwellings in Campo, owner-occupied units account for 714 (72.4%), while renter-occupied units make up 272 (27.6%).
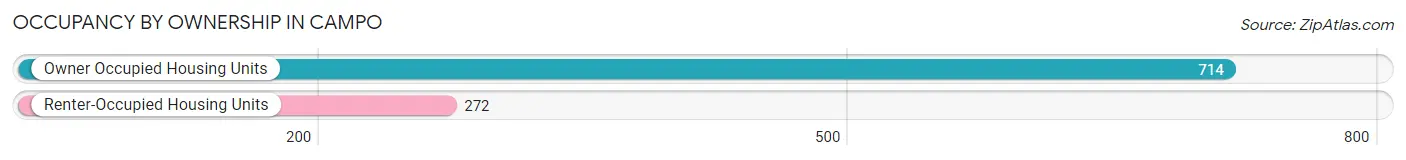
| Occupancy | # Housing Units | % Housing Units |
| Owner Occupied Housing Units | 714 | 72.4% |
| Renter-Occupied Housing Units | 272 | 27.6% |
| Total Occupied Housing Units | 986 | 100.0% |
Occupancy by Household Size in Campo
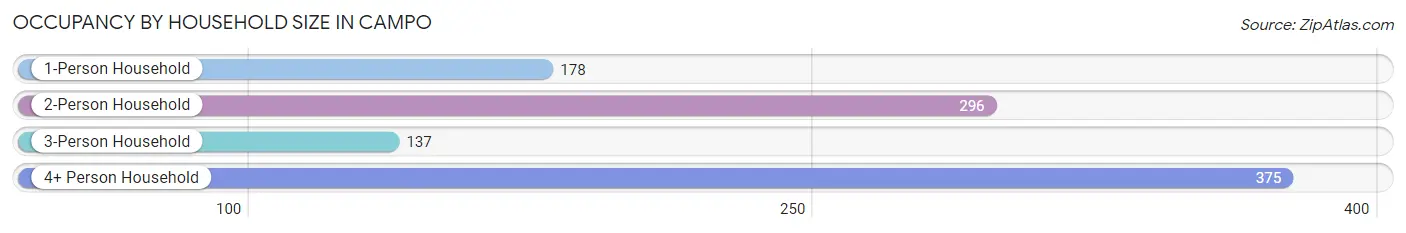
| Household Size | # Housing Units | % Housing Units |
| 1-Person Household | 178 | 18.0% |
| 2-Person Household | 296 | 30.0% |
| 3-Person Household | 137 | 13.9% |
| 4+ Person Household | 375 | 38.0% |
| Total Housing Units | 986 | 100.0% |
Occupancy by Ownership by Household Size in Campo
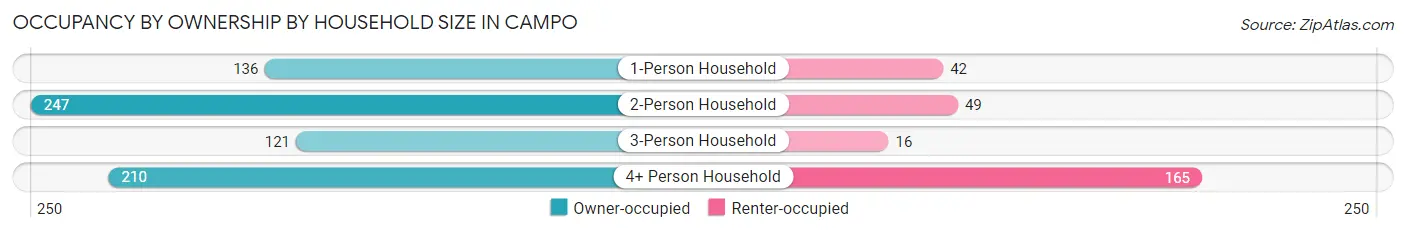
| Household Size | Owner-occupied | Renter-occupied |
| 1-Person Household | 136 (76.4%) | 42 (23.6%) |
| 2-Person Household | 247 (83.5%) | 49 (16.6%) |
| 3-Person Household | 121 (88.3%) | 16 (11.7%) |
| 4+ Person Household | 210 (56.0%) | 165 (44.0%) |
| Total Housing Units | 714 (72.4%) | 272 (27.6%) |
Occupancy by Educational Attainment in Campo
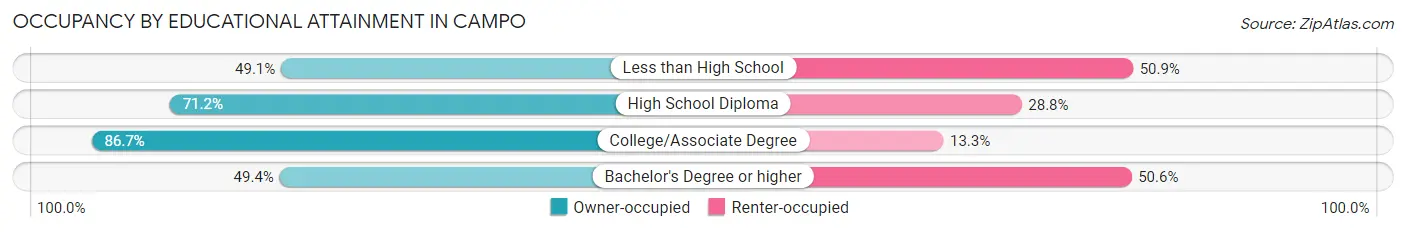
| Household Size | Owner-occupied | Renter-occupied |
| Less than High School | 114 (49.1%) | 118 (50.9%) |
| High School Diploma | 99 (71.2%) | 40 (28.8%) |
| College/Associate Degree | 458 (86.7%) | 70 (13.3%) |
| Bachelor's Degree or higher | 43 (49.4%) | 44 (50.6%) |
Occupancy by Age of Householder in Campo
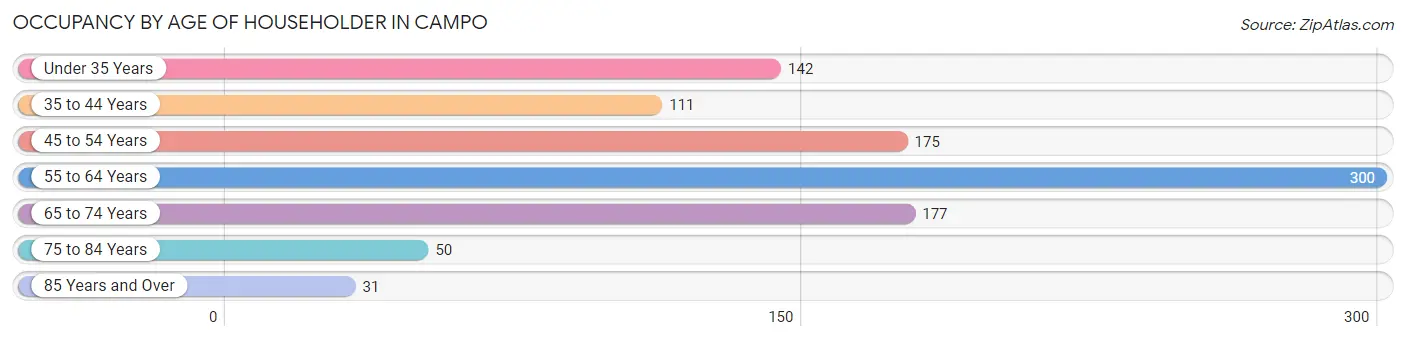
| Age Bracket | # Households | % Households |
| Under 35 Years | 142 | 14.4% |
| 35 to 44 Years | 111 | 11.3% |
| 45 to 54 Years | 175 | 17.7% |
| 55 to 64 Years | 300 | 30.4% |
| 65 to 74 Years | 177 | 17.9% |
| 75 to 84 Years | 50 | 5.1% |
| 85 Years and Over | 31 | 3.1% |
| Total | 986 | 100.0% |
Housing Finances in Campo
Median Income by Occupancy in Campo
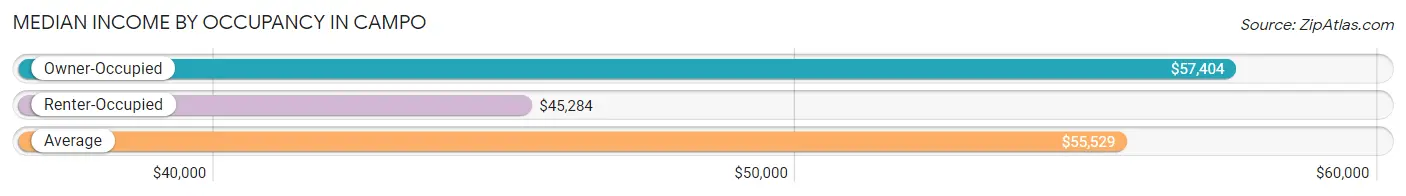
| Occupancy Type | # Households | Median Income |
| Owner-Occupied | 714 (72.4%) | $57,404 |
| Renter-Occupied | 272 (27.6%) | $45,284 |
| Average | 986 (100.0%) | $55,529 |
Occupancy by Householder Income Bracket in Campo
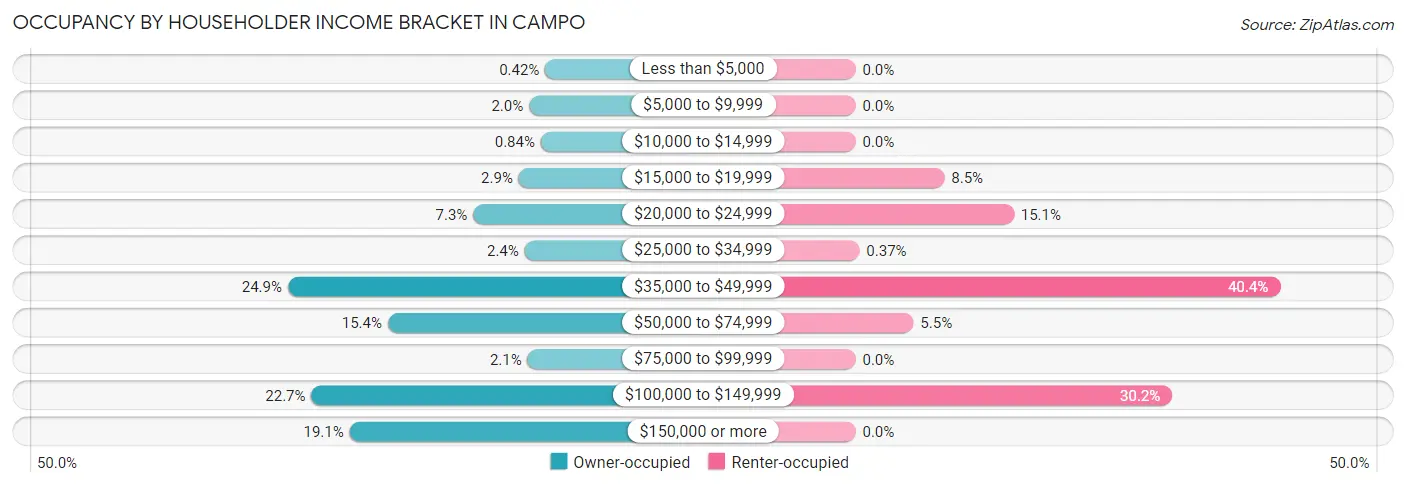
| Income Bracket | Owner-occupied | Renter-occupied |
| Less than $5,000 | 3 (0.4%) | 0 (0.0%) |
| $5,000 to $9,999 | 14 (2.0%) | 0 (0.0%) |
| $10,000 to $14,999 | 6 (0.8%) | 0 (0.0%) |
| $15,000 to $19,999 | 21 (2.9%) | 23 (8.5%) |
| $20,000 to $24,999 | 52 (7.3%) | 41 (15.1%) |
| $25,000 to $34,999 | 17 (2.4%) | 1 (0.4%) |
| $35,000 to $49,999 | 178 (24.9%) | 110 (40.4%) |
| $50,000 to $74,999 | 110 (15.4%) | 15 (5.5%) |
| $75,000 to $99,999 | 15 (2.1%) | 0 (0.0%) |
| $100,000 to $149,999 | 162 (22.7%) | 82 (30.1%) |
| $150,000 or more | 136 (19.1%) | 0 (0.0%) |
| Total | 714 (100.0%) | 272 (100.0%) |
Monthly Housing Cost Tiers in Campo
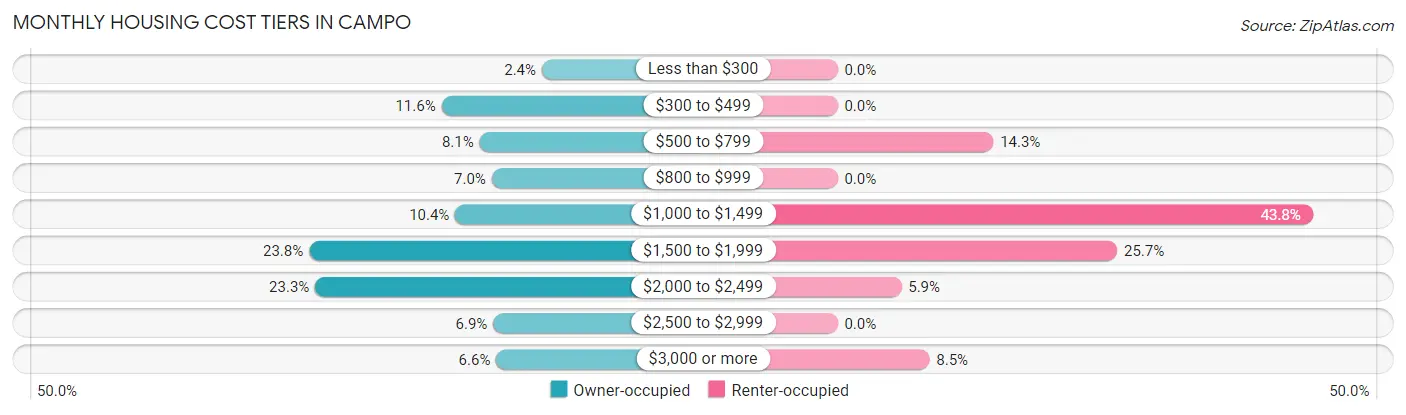
| Monthly Cost | Owner-occupied | Renter-occupied |
| Less than $300 | 17 (2.4%) | 0 (0.0%) |
| $300 to $499 | 83 (11.6%) | 0 (0.0%) |
| $500 to $799 | 58 (8.1%) | 39 (14.3%) |
| $800 to $999 | 50 (7.0%) | 0 (0.0%) |
| $1,000 to $1,499 | 74 (10.4%) | 119 (43.8%) |
| $1,500 to $1,999 | 170 (23.8%) | 70 (25.7%) |
| $2,000 to $2,499 | 166 (23.3%) | 16 (5.9%) |
| $2,500 to $2,999 | 49 (6.9%) | 0 (0.0%) |
| $3,000 or more | 47 (6.6%) | 23 (8.5%) |
| Total | 714 (100.0%) | 272 (100.0%) |
Physical Housing Characteristics in Campo
Housing Structures in Campo
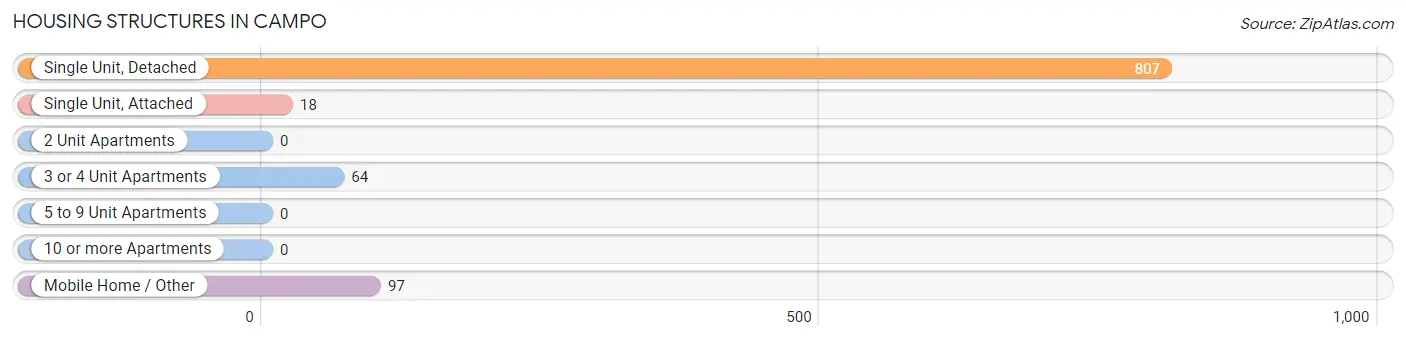
| Structure Type | # Housing Units | % Housing Units |
| Single Unit, Detached | 807 | 81.9% |
| Single Unit, Attached | 18 | 1.8% |
| 2 Unit Apartments | 0 | 0.0% |
| 3 or 4 Unit Apartments | 64 | 6.5% |
| 5 to 9 Unit Apartments | 0 | 0.0% |
| 10 or more Apartments | 0 | 0.0% |
| Mobile Home / Other | 97 | 9.8% |
| Total | 986 | 100.0% |
Housing Structures by Occupancy in Campo
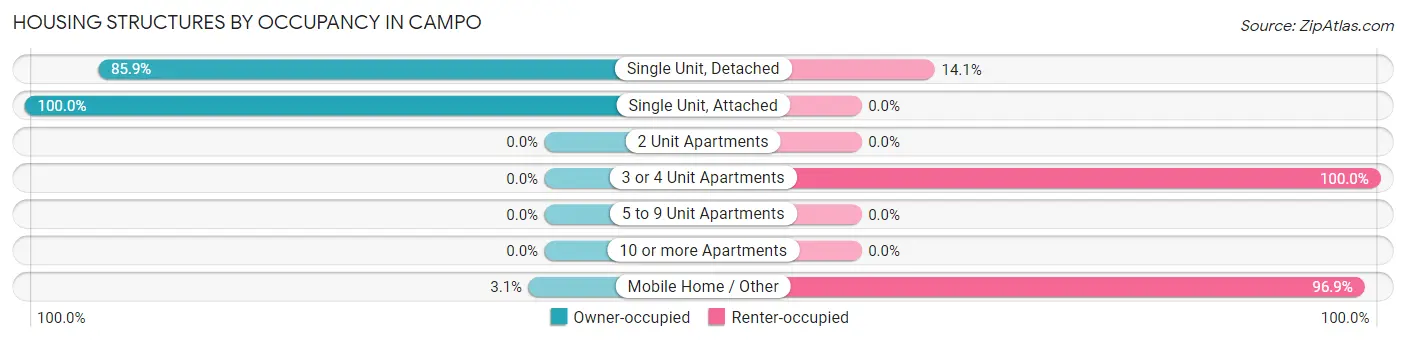
| Structure Type | Owner-occupied | Renter-occupied |
| Single Unit, Detached | 693 (85.9%) | 114 (14.1%) |
| Single Unit, Attached | 18 (100.0%) | 0 (0.0%) |
| 2 Unit Apartments | 0 (0.0%) | 0 (0.0%) |
| 3 or 4 Unit Apartments | 0 (0.0%) | 64 (100.0%) |
| 5 to 9 Unit Apartments | 0 (0.0%) | 0 (0.0%) |
| 10 or more Apartments | 0 (0.0%) | 0 (0.0%) |
| Mobile Home / Other | 3 (3.1%) | 94 (96.9%) |
| Total | 714 (72.4%) | 272 (27.6%) |
Housing Structures by Number of Rooms in Campo
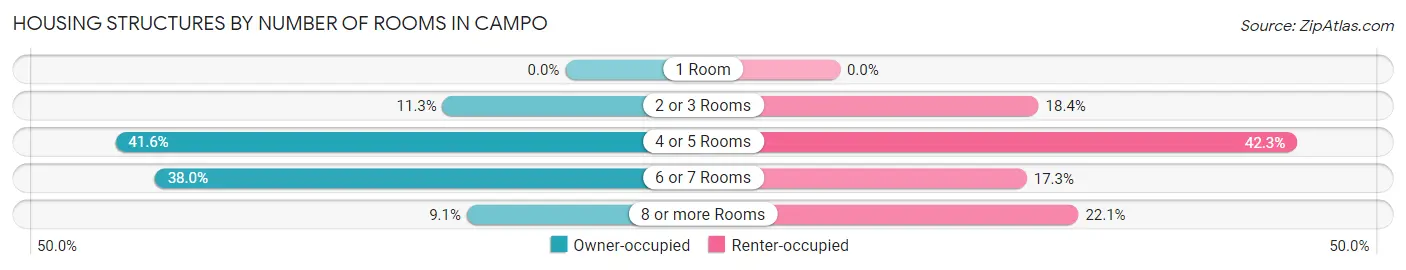
| Number of Rooms | Owner-occupied | Renter-occupied |
| 1 Room | 0 (0.0%) | 0 (0.0%) |
| 2 or 3 Rooms | 81 (11.3%) | 50 (18.4%) |
| 4 or 5 Rooms | 297 (41.6%) | 115 (42.3%) |
| 6 or 7 Rooms | 271 (38.0%) | 47 (17.3%) |
| 8 or more Rooms | 65 (9.1%) | 60 (22.1%) |
| Total | 714 (100.0%) | 272 (100.0%) |
Housing Structure by Heating Type in Campo
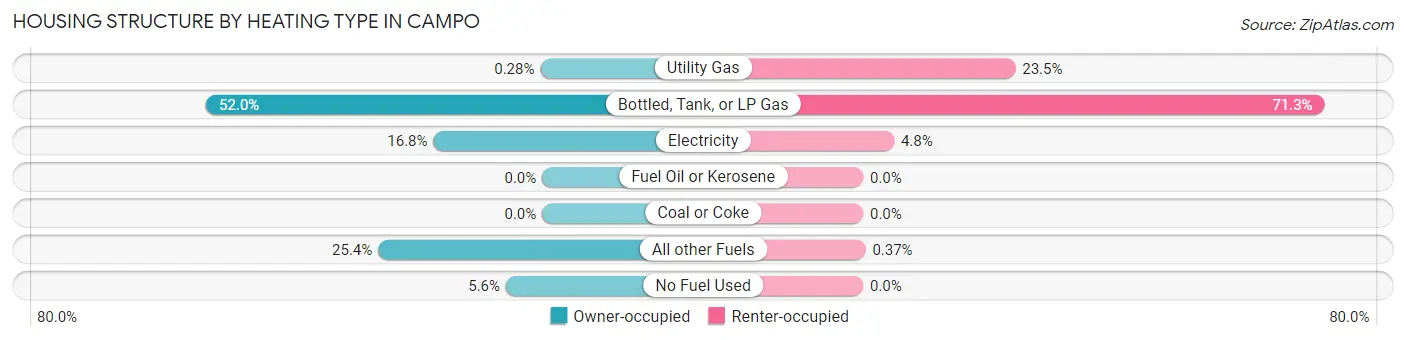
| Heating Type | Owner-occupied | Renter-occupied |
| Utility Gas | 2 (0.3%) | 64 (23.5%) |
| Bottled, Tank, or LP Gas | 371 (52.0%) | 194 (71.3%) |
| Electricity | 120 (16.8%) | 13 (4.8%) |
| Fuel Oil or Kerosene | 0 (0.0%) | 0 (0.0%) |
| Coal or Coke | 0 (0.0%) | 0 (0.0%) |
| All other Fuels | 181 (25.4%) | 1 (0.4%) |
| No Fuel Used | 40 (5.6%) | 0 (0.0%) |
| Total | 714 (100.0%) | 272 (100.0%) |
Household Vehicle Usage in Campo
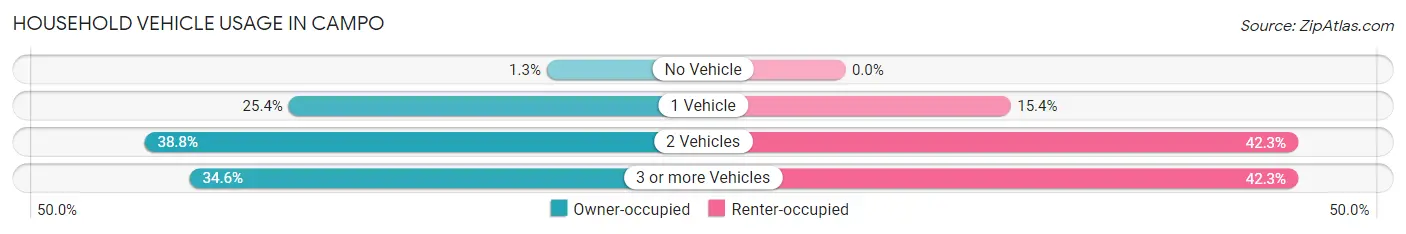
| Vehicles per Household | Owner-occupied | Renter-occupied |
| No Vehicle | 9 (1.3%) | 0 (0.0%) |
| 1 Vehicle | 181 (25.4%) | 42 (15.4%) |
| 2 Vehicles | 277 (38.8%) | 115 (42.3%) |
| 3 or more Vehicles | 247 (34.6%) | 115 (42.3%) |
| Total | 714 (100.0%) | 272 (100.0%) |
Real Estate & Mortgages in Campo
Real Estate and Mortgage Overview in Campo
| Characteristic | Without Mortgage | With Mortgage |
| Housing Units | 187 | 527 |
| Median Property Value | $274,700 | $324,100 |
| Median Household Income | $45,292 | $134 |
| Monthly Housing Costs | $488 | $47 |
| Real Estate Taxes | $2,049 | $18 |
Property Value by Mortgage Status in Campo
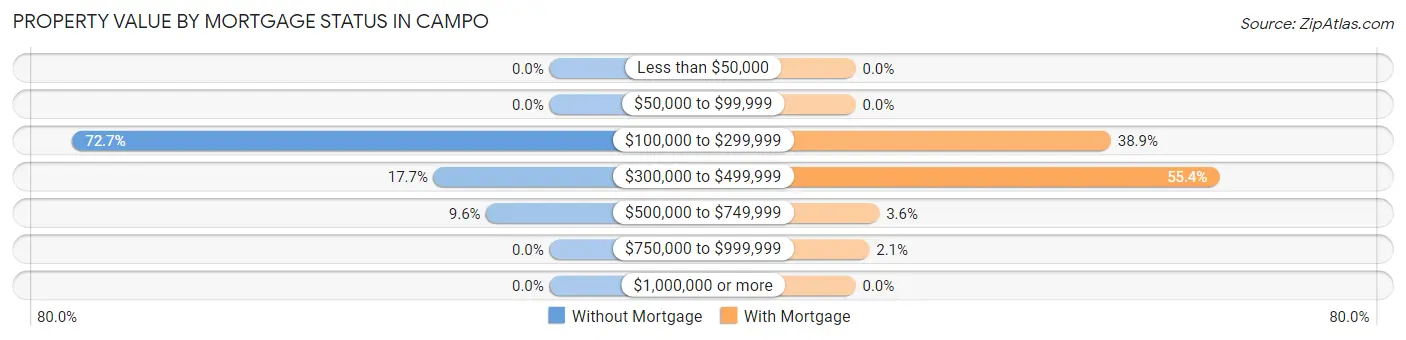
| Property Value | Without Mortgage | With Mortgage |
| Less than $50,000 | 0 (0.0%) | 0 (0.0%) |
| $50,000 to $99,999 | 0 (0.0%) | 0 (0.0%) |
| $100,000 to $299,999 | 136 (72.7%) | 205 (38.9%) |
| $300,000 to $499,999 | 33 (17.6%) | 292 (55.4%) |
| $500,000 to $749,999 | 18 (9.6%) | 19 (3.6%) |
| $750,000 to $999,999 | 0 (0.0%) | 11 (2.1%) |
| $1,000,000 or more | 0 (0.0%) | 0 (0.0%) |
| Total | 187 (100.0%) | 527 (100.0%) |
Household Income by Mortgage Status in Campo
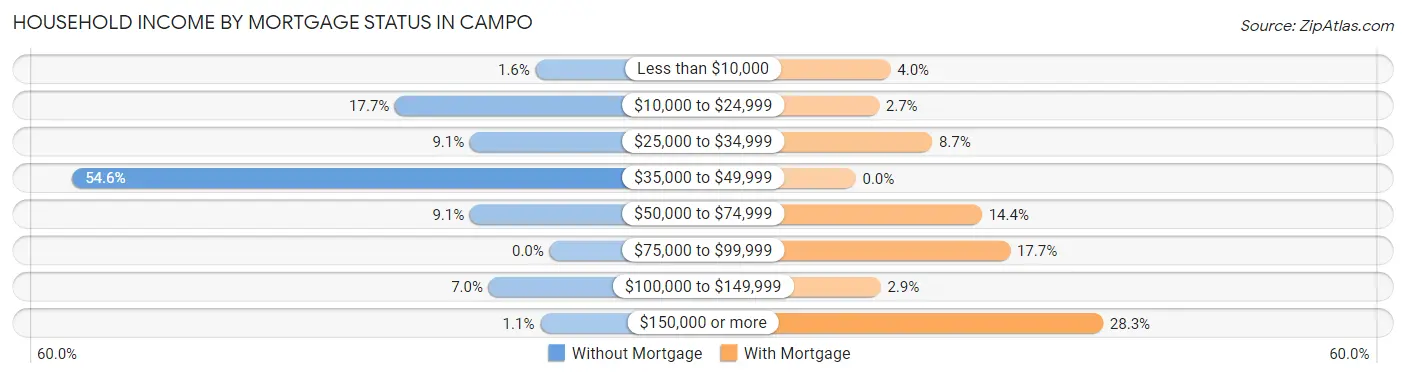
| Household Income | Without Mortgage | With Mortgage |
| Less than $10,000 | 3 (1.6%) | 21 (4.0%) |
| $10,000 to $24,999 | 33 (17.6%) | 14 (2.7%) |
| $25,000 to $34,999 | 17 (9.1%) | 46 (8.7%) |
| $35,000 to $49,999 | 102 (54.5%) | 0 (0.0%) |
| $50,000 to $74,999 | 17 (9.1%) | 76 (14.4%) |
| $75,000 to $99,999 | 0 (0.0%) | 93 (17.6%) |
| $100,000 to $149,999 | 13 (7.0%) | 15 (2.9%) |
| $150,000 or more | 2 (1.1%) | 149 (28.3%) |
| Total | 187 (100.0%) | 527 (100.0%) |
Property Value to Household Income Ratio in Campo
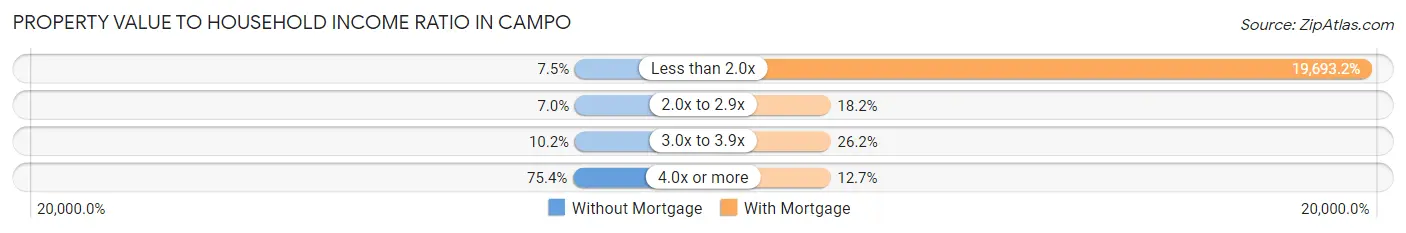
| Value-to-Income Ratio | Without Mortgage | With Mortgage |
| Less than 2.0x | 14 (7.5%) | 103,783 (19,693.2%) |
| 2.0x to 2.9x | 13 (7.0%) | 96 (18.2%) |
| 3.0x to 3.9x | 19 (10.2%) | 138 (26.2%) |
| 4.0x or more | 141 (75.4%) | 67 (12.7%) |
| Total | 187 (100.0%) | 527 (100.0%) |
Real Estate Taxes by Mortgage Status in Campo
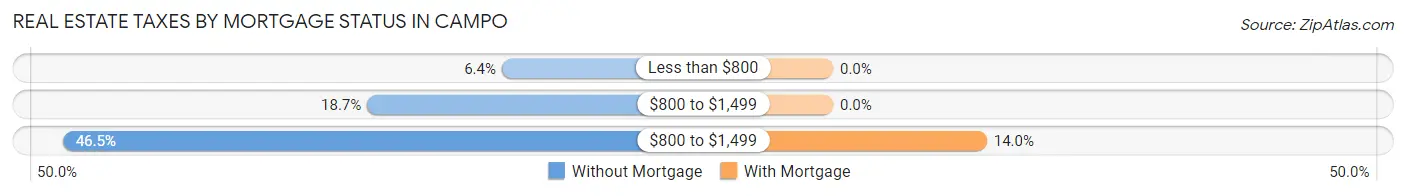
| Property Taxes | Without Mortgage | With Mortgage |
| Less than $800 | 12 (6.4%) | 0 (0.0%) |
| $800 to $1,499 | 35 (18.7%) | 0 (0.0%) |
| $800 to $1,499 | 87 (46.5%) | 74 (14.0%) |
| Total | 187 (100.0%) | 527 (100.0%) |
Health & Disability in Campo
Health Insurance Coverage by Age in Campo
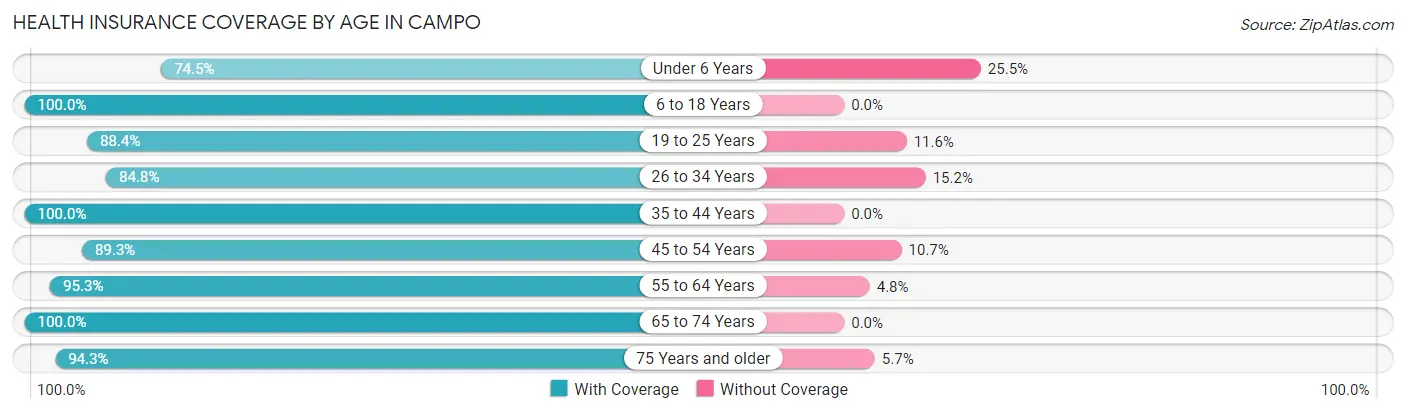
| Age Bracket | With Coverage | Without Coverage |
| Under 6 Years | 272 (74.5%) | 93 (25.5%) |
| 6 to 18 Years | 622 (100.0%) | 0 (0.0%) |
| 19 to 25 Years | 167 (88.4%) | 22 (11.6%) |
| 26 to 34 Years | 335 (84.8%) | 60 (15.2%) |
| 35 to 44 Years | 238 (100.0%) | 0 (0.0%) |
| 45 to 54 Years | 284 (89.3%) | 34 (10.7%) |
| 55 to 64 Years | 542 (95.3%) | 27 (4.8%) |
| 65 to 74 Years | 386 (100.0%) | 0 (0.0%) |
| 75 Years and older | 132 (94.3%) | 8 (5.7%) |
| Total | 2,978 (92.4%) | 244 (7.6%) |
Health Insurance Coverage by Citizenship Status in Campo
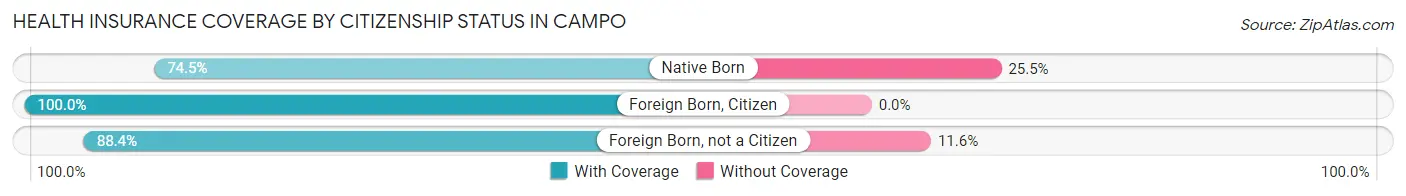
| Citizenship Status | With Coverage | Without Coverage |
| Native Born | 272 (74.5%) | 93 (25.5%) |
| Foreign Born, Citizen | 622 (100.0%) | 0 (0.0%) |
| Foreign Born, not a Citizen | 167 (88.4%) | 22 (11.6%) |
Health Insurance Coverage by Household Income in Campo
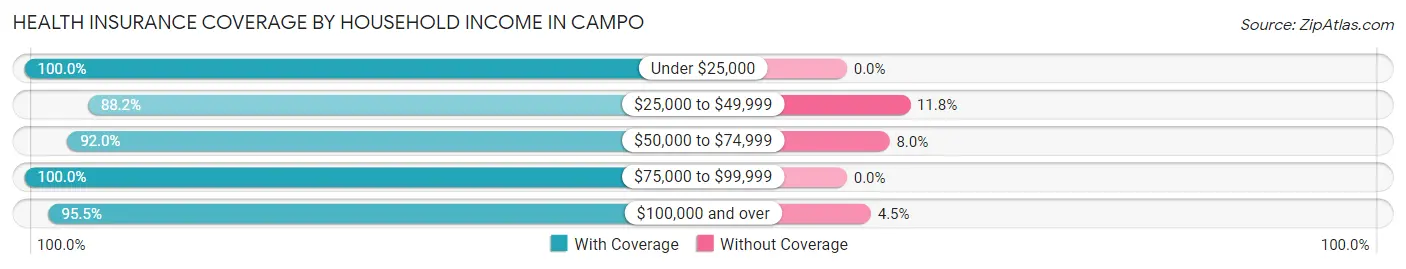
| Household Income | With Coverage | Without Coverage |
| Under $25,000 | 263 (100.0%) | 0 (0.0%) |
| $25,000 to $49,999 | 1,109 (88.2%) | 149 (11.8%) |
| $50,000 to $74,999 | 357 (92.0%) | 31 (8.0%) |
| $75,000 to $99,999 | 54 (100.0%) | 0 (0.0%) |
| $100,000 and over | 1,191 (95.5%) | 56 (4.5%) |
Public vs Private Health Insurance Coverage by Age in Campo
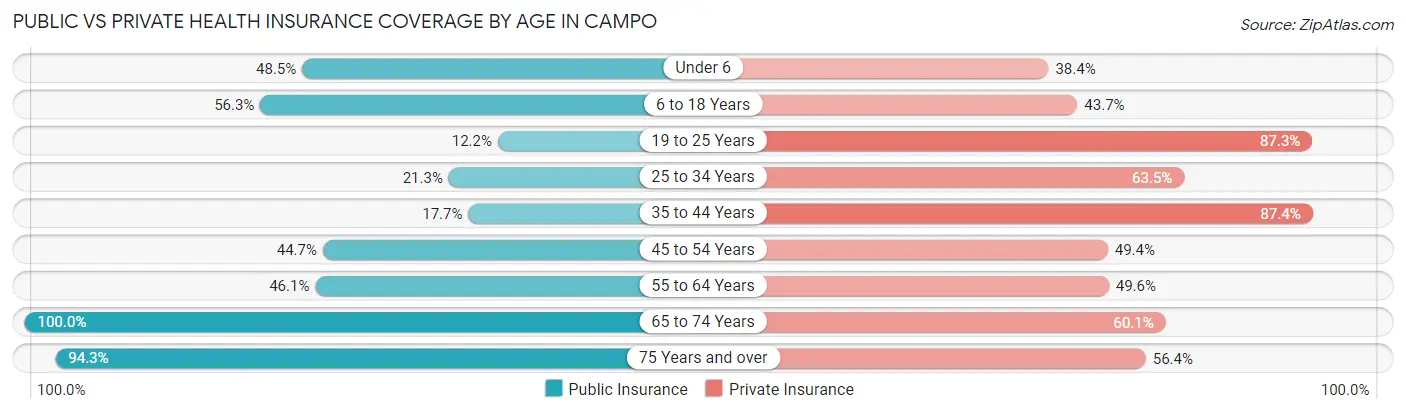
| Age Bracket | Public Insurance | Private Insurance |
| Under 6 | 177 (48.5%) | 140 (38.4%) |
| 6 to 18 Years | 350 (56.3%) | 272 (43.7%) |
| 19 to 25 Years | 23 (12.2%) | 165 (87.3%) |
| 25 to 34 Years | 84 (21.3%) | 251 (63.5%) |
| 35 to 44 Years | 42 (17.6%) | 208 (87.4%) |
| 45 to 54 Years | 142 (44.7%) | 157 (49.4%) |
| 55 to 64 Years | 262 (46.1%) | 282 (49.6%) |
| 65 to 74 Years | 386 (100.0%) | 232 (60.1%) |
| 75 Years and over | 132 (94.3%) | 79 (56.4%) |
| Total | 1,598 (49.6%) | 1,786 (55.4%) |
Disability Status by Sex by Age in Campo
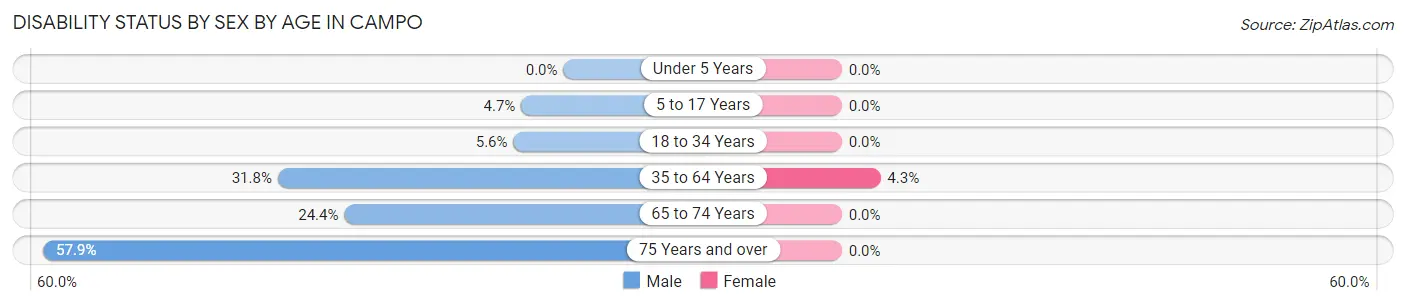
| Age Bracket | Male | Female |
| Under 5 Years | 0 (0.0%) | 0 (0.0%) |
| 5 to 17 Years | 17 (4.7%) | 0 (0.0%) |
| 18 to 34 Years | 20 (5.6%) | 0 (0.0%) |
| 35 to 64 Years | 195 (31.8%) | 22 (4.3%) |
| 65 to 74 Years | 51 (24.4%) | 0 (0.0%) |
| 75 Years and over | 62 (57.9%) | 0 (0.0%) |
Disability Class by Sex by Age in Campo
Disability Class: Hearing Difficulty
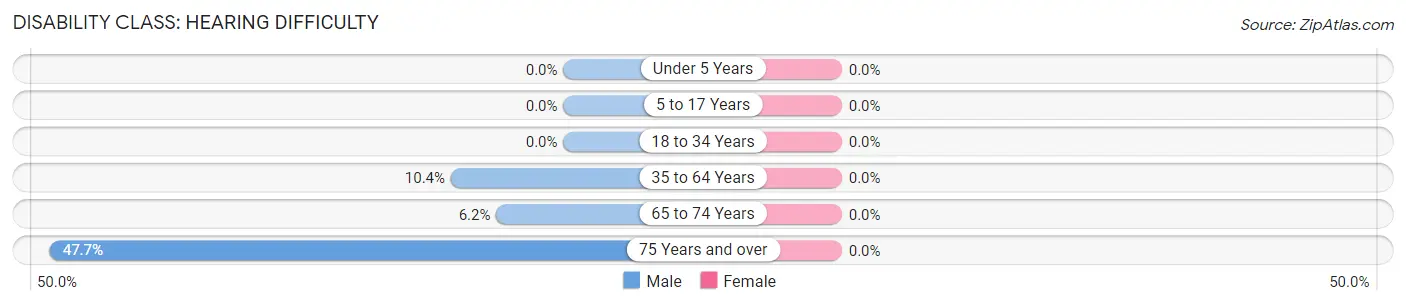
| Age Bracket | Male | Female |
| Under 5 Years | 0 (0.0%) | 0 (0.0%) |
| 5 to 17 Years | 0 (0.0%) | 0 (0.0%) |
| 18 to 34 Years | 0 (0.0%) | 0 (0.0%) |
| 35 to 64 Years | 64 (10.4%) | 0 (0.0%) |
| 65 to 74 Years | 13 (6.2%) | 0 (0.0%) |
| 75 Years and over | 51 (47.7%) | 0 (0.0%) |
Disability Class: Vision Difficulty
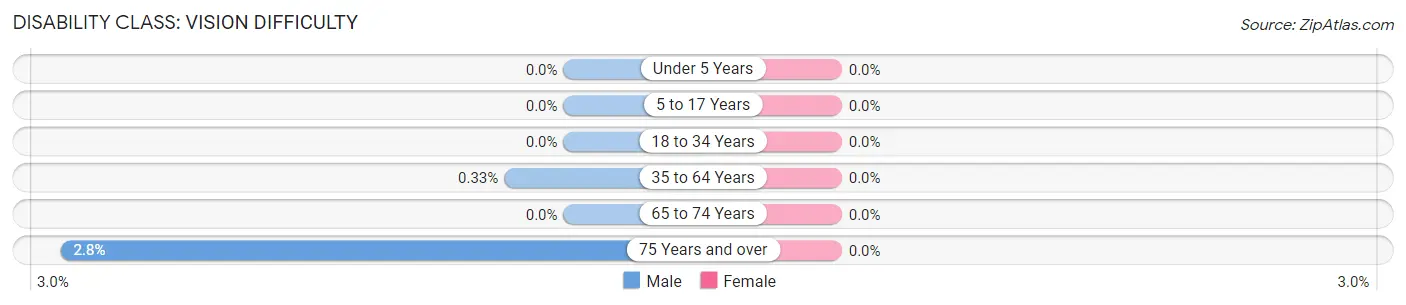
| Age Bracket | Male | Female |
| Under 5 Years | 0 (0.0%) | 0 (0.0%) |
| 5 to 17 Years | 0 (0.0%) | 0 (0.0%) |
| 18 to 34 Years | 0 (0.0%) | 0 (0.0%) |
| 35 to 64 Years | 2 (0.3%) | 0 (0.0%) |
| 65 to 74 Years | 0 (0.0%) | 0 (0.0%) |
| 75 Years and over | 3 (2.8%) | 0 (0.0%) |
Disability Class: Cognitive Difficulty
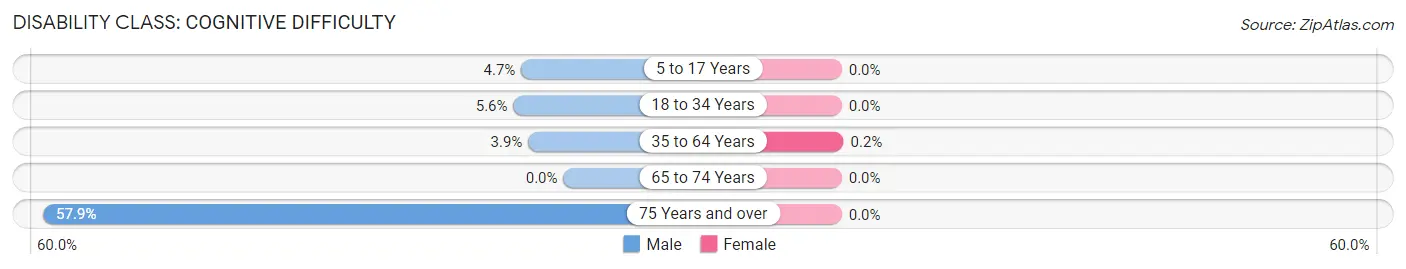
| Age Bracket | Male | Female |
| 5 to 17 Years | 17 (4.7%) | 0 (0.0%) |
| 18 to 34 Years | 20 (5.6%) | 0 (0.0%) |
| 35 to 64 Years | 24 (3.9%) | 1 (0.2%) |
| 65 to 74 Years | 0 (0.0%) | 0 (0.0%) |
| 75 Years and over | 62 (57.9%) | 0 (0.0%) |
Disability Class: Ambulatory Difficulty
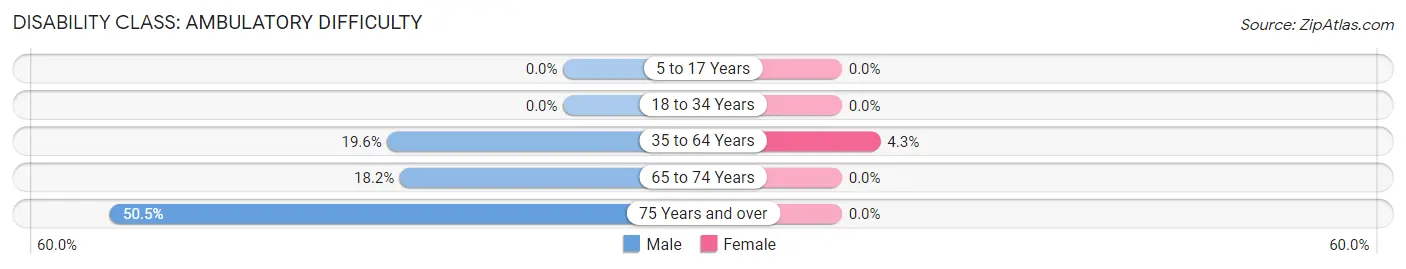
| Age Bracket | Male | Female |
| 5 to 17 Years | 0 (0.0%) | 0 (0.0%) |
| 18 to 34 Years | 0 (0.0%) | 0 (0.0%) |
| 35 to 64 Years | 120 (19.6%) | 22 (4.3%) |
| 65 to 74 Years | 38 (18.2%) | 0 (0.0%) |
| 75 Years and over | 54 (50.5%) | 0 (0.0%) |
Disability Class: Self-Care Difficulty
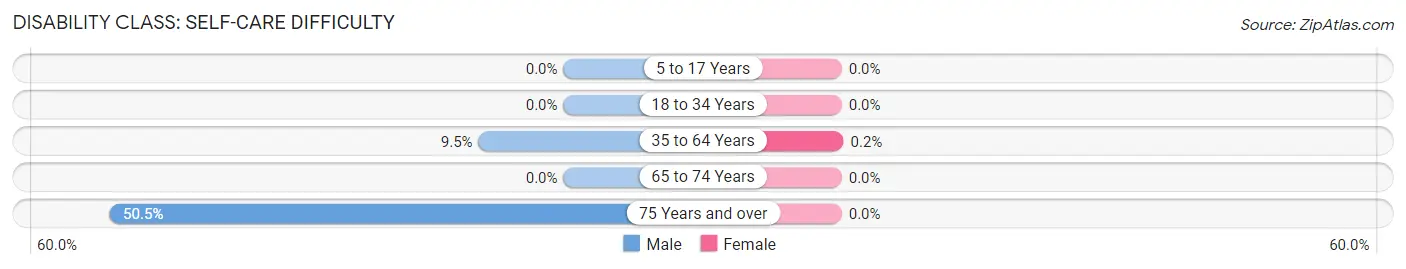
| Age Bracket | Male | Female |
| 5 to 17 Years | 0 (0.0%) | 0 (0.0%) |
| 18 to 34 Years | 0 (0.0%) | 0 (0.0%) |
| 35 to 64 Years | 58 (9.5%) | 1 (0.2%) |
| 65 to 74 Years | 0 (0.0%) | 0 (0.0%) |
| 75 Years and over | 54 (50.5%) | 0 (0.0%) |
Technology Access in Campo
Computing Device Access in Campo
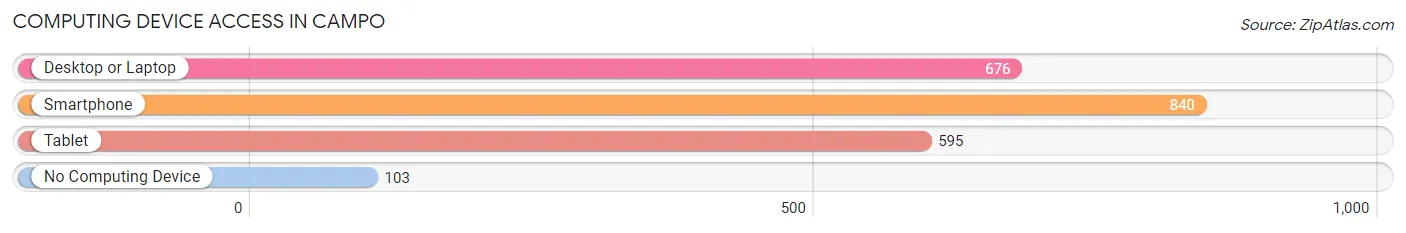
| Device Type | # Households | % Households |
| Desktop or Laptop | 676 | 68.6% |
| Smartphone | 840 | 85.2% |
| Tablet | 595 | 60.3% |
| No Computing Device | 103 | 10.4% |
| Total | 986 | 100.0% |
Internet Access in Campo
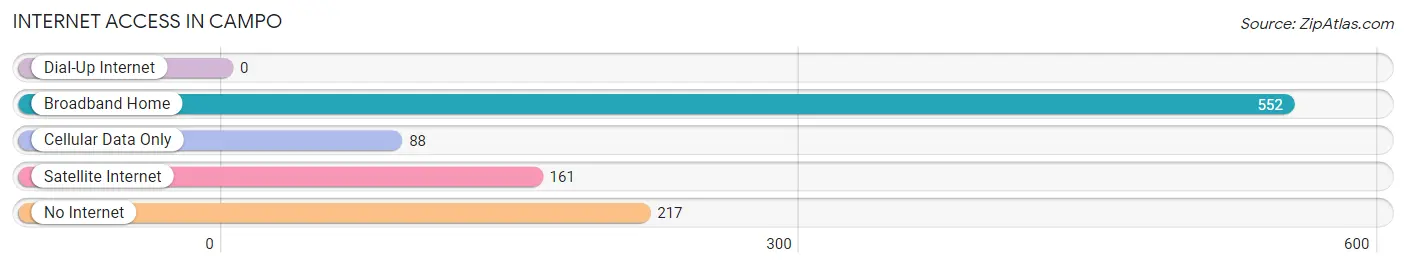
| Internet Type | # Households | % Households |
| Dial-Up Internet | 0 | 0.0% |
| Broadband Home | 552 | 56.0% |
| Cellular Data Only | 88 | 8.9% |
| Satellite Internet | 161 | 16.3% |
| No Internet | 217 | 22.0% |
| Total | 986 | 100.0% |
Campo Summary
Campo is a small unincorporated community located in San Diego County, California. It is situated in the southeastern corner of the county, near the Mexican border. The population of Campo was 2,684 as of the 2010 census.
History
The area that is now Campo was originally inhabited by the Kumeyaay people. The first Europeans to settle in the area were Spanish missionaries, who established a mission in the area in 1774. The mission was abandoned in 1834, and the area was subsequently settled by ranchers. The town of Campo was founded in 1887, and the first post office was established in 1888.
Geography
Campo is located in the southeastern corner of San Diego County, near the Mexican border. It is situated at an elevation of 2,845 feet (867 m). The town is located in a valley surrounded by mountains, including the Laguna Mountains to the east and the Cuyamaca Mountains to the west. The climate in Campo is semi-arid, with hot summers and mild winters.
Economy
The economy of Campo is largely based on agriculture. The town is home to several farms, which produce a variety of crops, including corn, wheat, and hay. The town is also home to several small businesses, including a gas station, a grocery store, and a restaurant.
Demographics
As of the 2010 census, the population of Campo was 2,684. The racial makeup of the town was 75.3% White, 0.7% African American, 0.7% Native American, 0.3% Asian, 0.1% Pacific Islander, 19.3% from other races, and 3.6% from two or more races. Hispanic or Latino of any race were 44.2% of the population.
The median household income in Campo was $37,917, and the median family income was $41,250. The per capita income was $17,845. About 16.3% of families and 19.2% of the population were below the poverty line, including 28.3% of those under age 18 and 8.2% of those age 65 or over.
Common Questions
What is Per Capita Income in Campo?
Per Capita income in Campo is $25,419.
What is the Median Family Income in Campo?
Median Family Income in Campo is $74,722.
What is the Median Household income in Campo?
Median Household Income in Campo is $55,529.
What is Income or Wage Gap in Campo?
Income or Wage Gap in Campo is 5.9%.
Women in Campo earn 94.1 cents for every dollar earned by a man.
What is Family Income Deficit in Campo?
Family Income Deficit in Campo is $5,123.
Families that are below poverty line in Campo earn $5,123 less on average than the poverty threshold level.
What is Inequality or Gini Index in Campo?
Inequality or Gini Index in Campo is 0.41.
What is the Total Population of Campo?
Total Population of Campo is 3,468.
What is the Total Male Population of Campo?
Total Male Population of Campo is 2,049.
What is the Total Female Population of Campo?
Total Female Population of Campo is 1,419.
What is the Ratio of Males per 100 Females in Campo?
There are 144.40 Males per 100 Females in Campo.
What is the Ratio of Females per 100 Males in Campo?
There are 69.25 Females per 100 Males in Campo.
What is the Median Population Age in Campo?
Median Population Age in Campo is 33.3 Years.
What is the Average Family Size in Campo
Average Family Size in Campo is 3.7 People.
What is the Average Household Size in Campo
Average Household Size in Campo is 3.3 People.
How Large is the Labor Force in Campo?
There are 1,401 People in the Labor Forcein in Campo.
What is the Percentage of People in the Labor Force in Campo?
56.5% of People are in the Labor Force in Campo.
What is the Unemployment Rate in Campo?
Unemployment Rate in Campo is 3.1%.