Cities with the Highest Percentage of Population Employed in Construction & Extraction in South Carolina
RELATED REPORTS & OPTIONS
Construction & Extraction
South Carolina
Compare Cities
Map of Cities with the Highest Percentage of Population Employed in Construction & Extraction in South Carolina
0.0%
80.0%
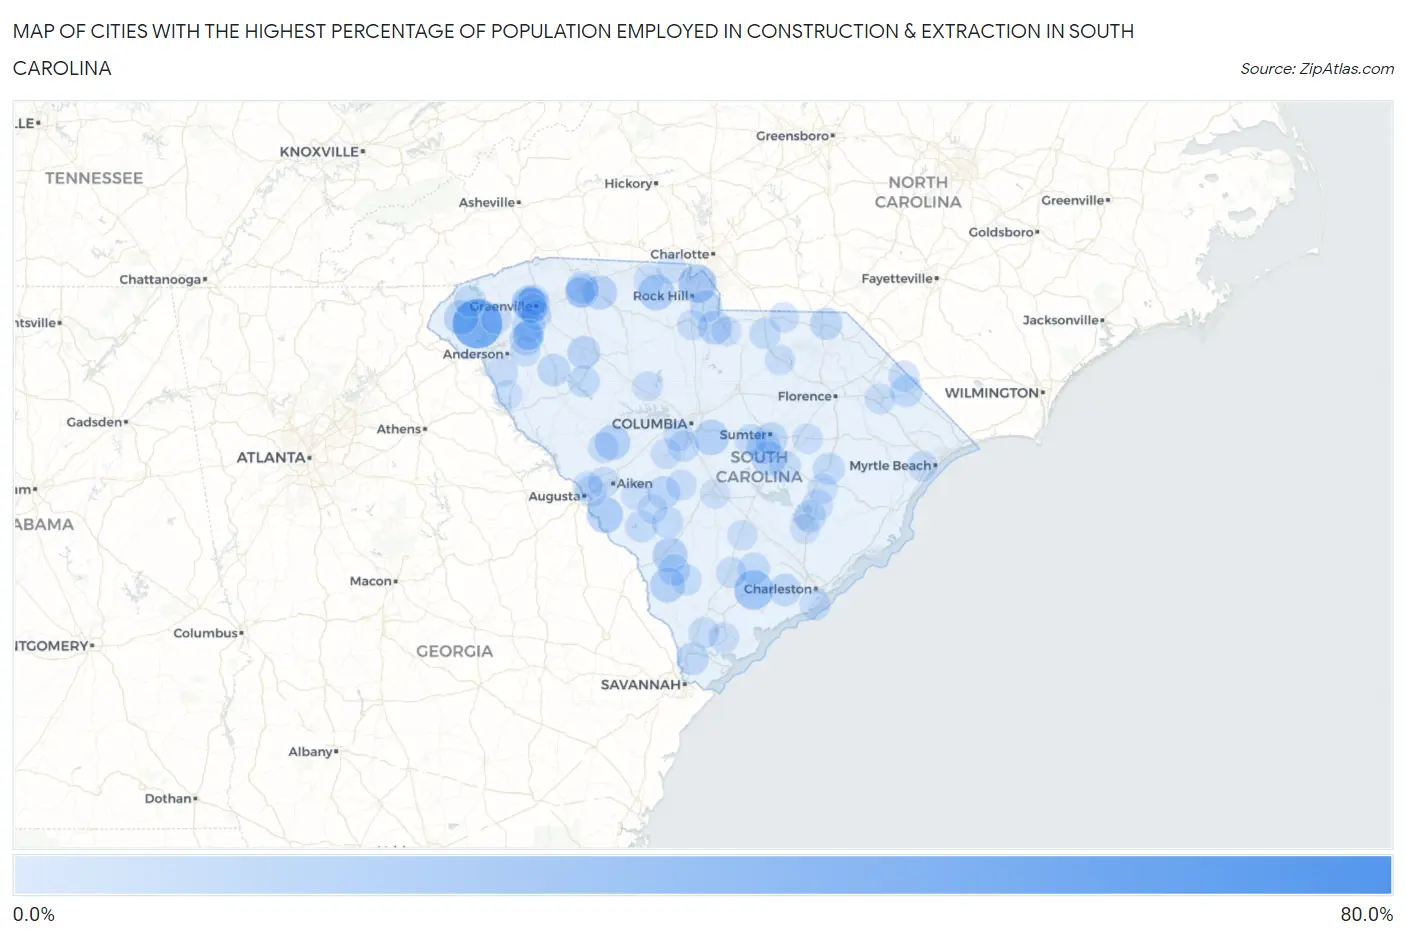
Cities with the Highest Percentage of Population Employed in Construction & Extraction in South Carolina
| City | % Employed | vs State | vs National | |
| 1. | Gillisonville | 78.2% | 5.0% (+73.2)#1 | 5.0% (+73.2)#51 |
| 2. | Newry | 53.1% | 5.0% (+48.2)#2 | 5.0% (+48.1)#138 |
| 3. | Finklea | 51.9% | 5.0% (+47.0)#3 | 5.0% (+46.9)#150 |
| 4. | Conestee | 44.6% | 5.0% (+39.6)#4 | 5.0% (+39.6)#223 |
| 5. | Cateechee | 32.4% | 5.0% (+27.5)#5 | 5.0% (+27.4)#454 |
| 6. | Jacksonboro | 28.9% | 5.0% (+23.9)#6 | 5.0% (+23.9)#594 |
| 7. | Dale | 27.8% | 5.0% (+22.9)#7 | 5.0% (+22.8)#652 |
| 8. | Little Rock | 26.6% | 5.0% (+21.6)#8 | 5.0% (+21.6)#744 |
| 9. | Riverview | 26.4% | 5.0% (+21.5)#9 | 5.0% (+21.5)#753 |
| 10. | Jackson | 21.9% | 5.0% (+16.9)#10 | 5.0% (+16.9)#1,145 |
| 11. | Sharon | 21.4% | 5.0% (+16.4)#11 | 5.0% (+16.4)#1,198 |
| 12. | Hopkins | 20.2% | 5.0% (+15.3)#12 | 5.0% (+15.2)#1,339 |
| 13. | Ward | 20.0% | 5.0% (+15.0)#13 | 5.0% (+15.0)#1,360 |
| 14. | Sycamore | 19.6% | 5.0% (+14.6)#14 | 5.0% (+14.6)#1,438 |
| 15. | Luray | 19.2% | 5.0% (+14.3)#15 | 5.0% (+14.2)#1,495 |
| 16. | Lobeco | 18.6% | 5.0% (+13.6)#16 | 5.0% (+13.6)#1,607 |
| 17. | Walhalla | 18.5% | 5.0% (+13.6)#17 | 5.0% (+13.5)#1,625 |
| 18. | City View | 18.3% | 5.0% (+13.4)#18 | 5.0% (+13.3)#1,655 |
| 19. | Parker | 18.0% | 5.0% (+13.0)#19 | 5.0% (+13.0)#1,744 |
| 20. | Glendale | 17.8% | 5.0% (+12.8)#20 | 5.0% (+12.8)#1,783 |
| 21. | Paxville | 17.6% | 5.0% (+12.7)#21 | 5.0% (+12.7)#1,815 |
| 22. | Berea | 17.6% | 5.0% (+12.6)#22 | 5.0% (+12.6)#1,829 |
| 23. | Irwin | 17.2% | 5.0% (+12.3)#23 | 5.0% (+12.2)#1,903 |
| 24. | Floydale | 17.0% | 5.0% (+12.1)#24 | 5.0% (+12.1)#1,953 |
| 25. | Privateer | 16.4% | 5.0% (+11.5)#25 | 5.0% (+11.4)#2,124 |
| 26. | Unity | 16.3% | 5.0% (+11.3)#26 | 5.0% (+11.3)#2,160 |
| 27. | Wyboo | 15.5% | 5.0% (+10.6)#27 | 5.0% (+10.5)#2,374 |
| 28. | Williamston | 15.2% | 5.0% (+10.3)#28 | 5.0% (+10.2)#2,469 |
| 29. | Arcadia | 15.2% | 5.0% (+10.3)#29 | 5.0% (+10.2)#2,470 |
| 30. | Chickasaw Point | 15.1% | 5.0% (+10.2)#30 | 5.0% (+10.1)#2,505 |
| 31. | Piedmont | 15.0% | 5.0% (+10.1)#31 | 5.0% (+10.1)#2,530 |
| 32. | Watts Mills | 15.0% | 5.0% (+10.1)#32 | 5.0% (+10.0)#2,539 |
| 33. | Springfield | 14.8% | 5.0% (+9.86)#33 | 5.0% (+9.82)#2,620 |
| 34. | Grover | 14.8% | 5.0% (+9.84)#34 | 5.0% (+9.79)#2,632 |
| 35. | Hardeeville | 14.7% | 5.0% (+9.76)#35 | 5.0% (+9.72)#2,661 |
| 36. | South Sumter | 14.7% | 5.0% (+9.72)#36 | 5.0% (+9.68)#2,679 |
| 37. | Southern Shops | 14.0% | 5.0% (+9.06)#37 | 5.0% (+9.02)#2,914 |
| 38. | Ravenel | 13.9% | 5.0% (+8.96)#38 | 5.0% (+8.91)#2,967 |
| 39. | Ware Shoals | 13.7% | 5.0% (+8.78)#39 | 5.0% (+8.73)#3,040 |
| 40. | Wallace | 13.6% | 5.0% (+8.65)#40 | 5.0% (+8.60)#3,099 |
| 41. | Snelling | 13.5% | 5.0% (+8.58)#41 | 5.0% (+8.54)#3,130 |
| 42. | Catawba | 13.5% | 5.0% (+8.55)#42 | 5.0% (+8.50)#3,145 |
| 43. | Bonneau Beach | 13.3% | 5.0% (+8.37)#43 | 5.0% (+8.33)#3,233 |
| 44. | Kingstree | 13.1% | 5.0% (+8.14)#44 | 5.0% (+8.10)#3,338 |
| 45. | Cottageville | 12.9% | 5.0% (+7.93)#45 | 5.0% (+7.89)#3,444 |
| 46. | Fairview Crossroads | 12.9% | 5.0% (+7.93)#46 | 5.0% (+7.89)#3,446 |
| 47. | Nichols | 12.9% | 5.0% (+7.91)#47 | 5.0% (+7.86)#3,461 |
| 48. | Wedgefield | 12.8% | 5.0% (+7.80)#48 | 5.0% (+7.76)#3,512 |
| 49. | Brunson | 12.7% | 5.0% (+7.77)#49 | 5.0% (+7.73)#3,532 |
| 50. | Cross Hill | 12.4% | 5.0% (+7.49)#50 | 5.0% (+7.45)#3,680 |
| 51. | Hilda | 12.1% | 5.0% (+7.13)#51 | 5.0% (+7.09)#3,881 |
| 52. | Homewood | 12.0% | 5.0% (+7.09)#52 | 5.0% (+7.05)#3,895 |
| 53. | Manning | 12.0% | 5.0% (+7.08)#53 | 5.0% (+7.04)#3,896 |
| 54. | Clearwater | 11.9% | 5.0% (+6.94)#54 | 5.0% (+6.90)#4,005 |
| 55. | Salem | 11.8% | 5.0% (+6.81)#55 | 5.0% (+6.77)#4,091 |
| 56. | Gaston | 11.5% | 5.0% (+6.52)#56 | 5.0% (+6.47)#4,288 |
| 57. | Jefferson | 11.3% | 5.0% (+6.37)#57 | 5.0% (+6.33)#4,397 |
| 58. | Walterboro | 10.9% | 5.0% (+5.96)#58 | 5.0% (+5.92)#4,729 |
| 59. | Elliott | 10.8% | 5.0% (+5.84)#59 | 5.0% (+5.80)#4,823 |
| 60. | St Stephen | 10.8% | 5.0% (+5.83)#60 | 5.0% (+5.79)#4,833 |
| 61. | Daviston | 10.8% | 5.0% (+5.80)#61 | 5.0% (+5.76)#4,856 |
| 62. | Varnville | 10.7% | 5.0% (+5.75)#62 | 5.0% (+5.71)#4,906 |
| 63. | Lake View | 10.7% | 5.0% (+5.70)#63 | 5.0% (+5.66)#4,948 |
| 64. | West Pelzer | 10.7% | 5.0% (+5.70)#64 | 5.0% (+5.66)#4,954 |
| 65. | Ridgeland | 10.5% | 5.0% (+5.59)#65 | 5.0% (+5.55)#5,029 |
| 66. | Johnston | 10.4% | 5.0% (+5.43)#66 | 5.0% (+5.38)#5,175 |
| 67. | Graniteville | 10.3% | 5.0% (+5.38)#67 | 5.0% (+5.34)#5,241 |
| 68. | Richburg | 10.2% | 5.0% (+5.27)#68 | 5.0% (+5.22)#5,339 |
| 69. | Folly Beach | 10.2% | 5.0% (+5.25)#69 | 5.0% (+5.21)#5,347 |
| 70. | Sandy Springs | 10.1% | 5.0% (+5.14)#70 | 5.0% (+5.10)#5,450 |
| 71. | Marion | 10.1% | 5.0% (+5.13)#71 | 5.0% (+5.09)#5,458 |
| 72. | Pelion | 10.0% | 5.0% (+5.09)#72 | 5.0% (+5.05)#5,501 |
| 73. | Norris | 10.0% | 5.0% (+5.08)#73 | 5.0% (+5.04)#5,513 |
| 74. | Smyrna | 10.0% | 5.0% (+5.05)#74 | 5.0% (+5.01)#5,580 |
| 75. | Socastee | 10.0% | 5.0% (+5.03)#75 | 5.0% (+4.99)#5,588 |
| 76. | Burton | 10.0% | 5.0% (+5.02)#76 | 5.0% (+4.98)#5,603 |
| 77. | Starr | 9.9% | 5.0% (+4.91)#77 | 5.0% (+4.87)#5,709 |
| 78. | Livingston | 9.8% | 5.0% (+4.85)#78 | 5.0% (+4.81)#5,753 |
| 79. | South Congaree | 9.7% | 5.0% (+4.72)#79 | 5.0% (+4.68)#5,888 |
| 80. | Belton | 9.6% | 5.0% (+4.65)#80 | 5.0% (+4.61)#5,951 |
| 81. | Sans Souci | 9.5% | 5.0% (+4.54)#81 | 5.0% (+4.50)#6,079 |
| 82. | Turbeville | 9.3% | 5.0% (+4.38)#82 | 5.0% (+4.34)#6,244 |
| 83. | Pomaria | 9.3% | 5.0% (+4.35)#83 | 5.0% (+4.31)#6,285 |
| 84. | Pelzer | 9.2% | 5.0% (+4.28)#84 | 5.0% (+4.24)#6,362 |
| 85. | Gantt | 9.1% | 5.0% (+4.20)#85 | 5.0% (+4.15)#6,460 |
| 86. | Mount Croghan | 9.1% | 5.0% (+4.14)#86 | 5.0% (+4.10)#6,536 |
| 87. | Mcbee | 9.1% | 5.0% (+4.11)#87 | 5.0% (+4.07)#6,583 |
| 88. | Fairforest | 9.1% | 5.0% (+4.10)#88 | 5.0% (+4.06)#6,594 |
| 89. | Lane | 8.9% | 5.0% (+3.92)#89 | 5.0% (+3.88)#6,780 |
| 90. | Pinopolis | 8.8% | 5.0% (+3.85)#90 | 5.0% (+3.81)#6,874 |
| 91. | Clover | 8.8% | 5.0% (+3.82)#91 | 5.0% (+3.78)#6,920 |
| 92. | Windsor | 8.8% | 5.0% (+3.82)#92 | 5.0% (+3.78)#6,925 |
| 93. | St George | 8.7% | 5.0% (+3.77)#93 | 5.0% (+3.72)#6,995 |
| 94. | Wilkinson Heights | 8.7% | 5.0% (+3.75)#94 | 5.0% (+3.71)#7,016 |
| 95. | La France | 8.7% | 5.0% (+3.73)#95 | 5.0% (+3.69)#7,058 |
| 96. | Belvedere | 8.6% | 5.0% (+3.63)#96 | 5.0% (+3.59)#7,189 |
| 97. | Lowndesville | 8.5% | 5.0% (+3.52)#97 | 5.0% (+3.48)#7,361 |
| 98. | Judson | 8.4% | 5.0% (+3.48)#98 | 5.0% (+3.44)#7,407 |
| 99. | Elgin | 8.3% | 5.0% (+3.39)#99 | 5.0% (+3.35)#7,527 |
| 100. | Elko | 8.3% | 5.0% (+3.38)#100 | 5.0% (+3.34)#7,550 |
Common Questions
What are the Top 10 Cities with the Highest Percentage of Population Employed in Construction & Extraction in South Carolina?
Top 10 Cities with the Highest Percentage of Population Employed in Construction & Extraction in South Carolina are:
What city has the Highest Percentage of Population Employed in Construction & Extraction in South Carolina?
Newry has the Highest Percentage of Population Employed in Construction & Extraction in South Carolina with 53.1%.
What is the Percentage of Population Employed in Construction & Extraction in the State of South Carolina?
Percentage of Population Employed in Construction & Extraction in South Carolina is 5.0%.
What is the Percentage of Population Employed in Construction & Extraction in the United States?
Percentage of Population Employed in Construction & Extraction in the United States is 5.0%.