Cities with the Highest Percentage of Population Employed in Construction & Extraction in West Virginia
RELATED REPORTS & OPTIONS
Construction & Extraction
West Virginia
Compare Cities
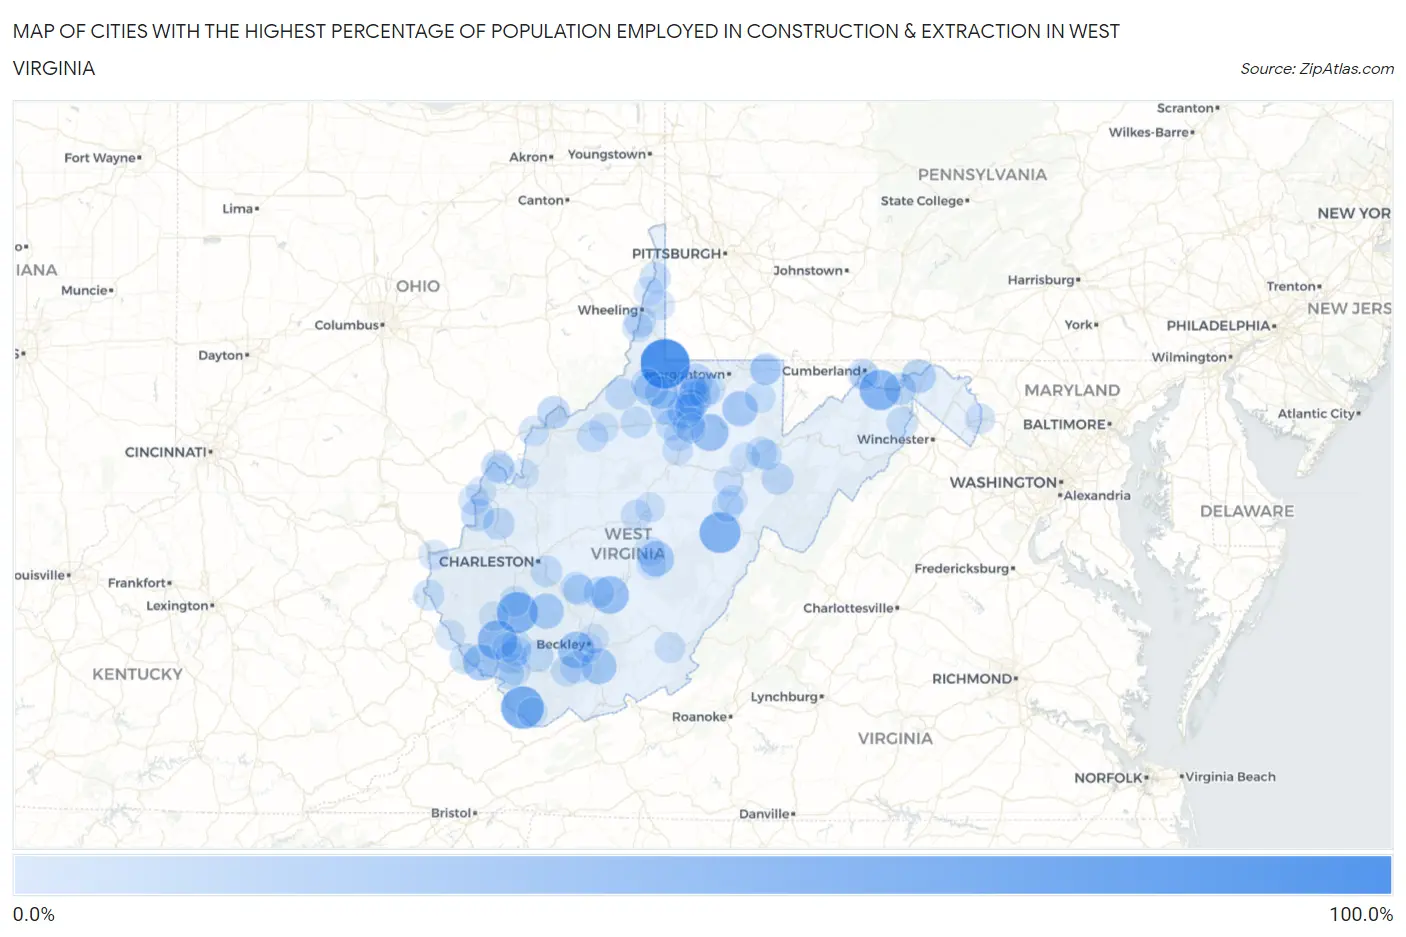
Map of Cities with the Highest Percentage of Population Employed in Construction & Extraction in West Virginia
0.0%
100.0%
Cities with the Highest Percentage of Population Employed in Construction & Extraction in West Virginia
| City | % Employed | vs State | vs National | |
| 1. | Littleton | 100.0% | 6.2%(+93.8)#1 | 5.0%(+95.0)#8 |
| 2. | Raysal | 66.7% | 6.2%(+60.4)#2 | 5.0%(+61.7)#70 |
| 3. | Valley Head | 60.0% | 6.2%(+53.8)#3 | 5.0%(+55.0)#97 |
| 4. | Greenview | 59.4% | 6.2%(+53.2)#4 | 5.0%(+54.4)#99 |
| 5. | Green Spring | 57.1% | 6.2%(+50.9)#5 | 5.0%(+52.1)#111 |
| 6. | Rossmore | 51.7% | 6.2%(+45.5)#6 | 5.0%(+46.7)#153 |
| 7. | Hico | 44.3% | 6.2%(+38.0)#7 | 5.0%(+39.3)#227 |
| 8. | Colcord | 41.9% | 6.2%(+35.7)#8 | 5.0%(+36.9)#253 |
| 9. | Galloway | 41.2% | 6.2%(+35.0)#9 | 5.0%(+36.2)#263 |
| 10. | Lester | 39.0% | 6.2%(+32.8)#10 | 5.0%(+34.1)#297 |
| 11. | Red Jacket | 37.6% | 6.2%(+31.4)#11 | 5.0%(+32.6)#320 |
| 12. | Ghent | 35.3% | 6.2%(+29.1)#12 | 5.0%(+30.3)#380 |
| 13. | Camden On Gauley | 34.0% | 6.2%(+27.7)#13 | 5.0%(+29.0)#404 |
| 14. | Newburg | 33.3% | 6.2%(+27.1)#14 | 5.0%(+28.3)#413 |
| 15. | Lumberport | 32.6% | 6.2%(+26.3)#15 | 5.0%(+27.6)#449 |
| 16. | Sylvester | 32.5% | 6.2%(+26.3)#16 | 5.0%(+27.5)#452 |
| 17. | Worthington | 30.0% | 6.2%(+23.8)#17 | 5.0%(+25.0)#550 |
| 18. | Sprague | 29.9% | 6.2%(+23.7)#18 | 5.0%(+24.9)#555 |
| 19. | Jacksonburg | 28.6% | 6.2%(+22.4)#19 | 5.0%(+23.6)#607 |
| 20. | Great Cacapon | 27.4% | 6.2%(+21.2)#20 | 5.0%(+22.4)#678 |
| 21. | Wallace | 26.6% | 6.2%(+20.4)#21 | 5.0%(+21.6)#741 |
| 22. | Rachel | 24.1% | 6.2%(+17.8)#22 | 5.0%(+19.1)#910 |
| 23. | Norton | 24.0% | 6.2%(+17.8)#23 | 5.0%(+19.0)#914 |
| 24. | Crooked Creek | 23.3% | 6.2%(+17.0)#24 | 5.0%(+18.3)#989 |
| 25. | Smithfield | 22.7% | 6.2%(+16.5)#25 | 5.0%(+17.7)#1,045 |
| 26. | Boaz | 22.7% | 6.2%(+16.5)#26 | 5.0%(+17.7)#1,049 |
| 27. | Apple Grove | 21.1% | 6.2%(+14.9)#27 | 5.0%(+16.1)#1,225 |
| 28. | Fairview | 21.1% | 6.2%(+14.8)#28 | 5.0%(+16.1)#1,230 |
| 29. | Despard | 20.7% | 6.2%(+14.5)#29 | 5.0%(+15.7)#1,285 |
| 30. | Paw Paw | 20.0% | 6.2%(+13.8)#30 | 5.0%(+15.0)#1,356 |
| 31. | Enterprise | 19.8% | 6.2%(+13.6)#31 | 5.0%(+14.8)#1,394 |
| 32. | Hartford City | 19.3% | 6.2%(+13.1)#32 | 5.0%(+14.3)#1,488 |
| 33. | Harman | 18.8% | 6.2%(+12.5)#33 | 5.0%(+13.8)#1,588 |
| 34. | Buffalo | 18.0% | 6.2%(+11.8)#34 | 5.0%(+13.0)#1,730 |
| 35. | Oceana | 17.8% | 6.2%(+11.6)#35 | 5.0%(+12.8)#1,782 |
| 36. | Middlebourne | 17.7% | 6.2%(+11.5)#36 | 5.0%(+12.7)#1,807 |
| 37. | Barrackville | 17.7% | 6.2%(+11.4)#37 | 5.0%(+12.7)#1,812 |
| 38. | Rhodell | 17.5% | 6.2%(+11.3)#38 | 5.0%(+12.5)#1,831 |
| 39. | Mcmechen | 17.1% | 6.2%(+10.9)#39 | 5.0%(+12.1)#1,932 |
| 40. | Brandonville | 16.8% | 6.2%(+10.6)#40 | 5.0%(+11.8)#1,995 |
| 41. | Rand | 16.7% | 6.2%(+10.5)#41 | 5.0%(+11.7)#2,026 |
| 42. | Bruno | 16.7% | 6.2%(+10.4)#42 | 5.0%(+11.7)#2,038 |
| 43. | Rock Cave | 16.3% | 6.2%(+10.1)#43 | 5.0%(+11.4)#2,139 |
| 44. | Cairo | 16.0% | 6.2%(+9.78)#44 | 5.0%(+11.0)#2,232 |
| 45. | West Union | 15.9% | 6.2%(+9.64)#45 | 5.0%(+10.9)#2,280 |
| 46. | Mill Creek | 15.8% | 6.2%(+9.61)#46 | 5.0%(+10.8)#2,290 |
| 47. | Smithers | 15.8% | 6.2%(+9.59)#47 | 5.0%(+10.8)#2,295 |
| 48. | Capon Bridge | 15.7% | 6.2%(+9.50)#48 | 5.0%(+10.7)#2,324 |
| 49. | Dorothy | 15.6% | 6.2%(+9.34)#49 | 5.0%(+10.6)#2,368 |
| 50. | Ansted | 15.3% | 6.2%(+9.08)#50 | 5.0%(+10.3)#2,449 |
| 51. | East View | 15.0% | 6.2%(+8.81)#51 | 5.0%(+10.0)#2,534 |
| 52. | Justice | 15.0% | 6.2%(+8.78)#52 | 5.0%(+10.0)#2,543 |
| 53. | Boomer | 15.0% | 6.2%(+8.75)#53 | 5.0%(+9.98)#2,562 |
| 54. | Wolf Summit | 14.9% | 6.2%(+8.67)#54 | 5.0%(+9.90)#2,588 |
| 55. | Wellsburg | 14.8% | 6.2%(+8.56)#55 | 5.0%(+9.78)#2,639 |
| 56. | Williamson | 14.6% | 6.2%(+8.43)#56 | 5.0%(+9.65)#2,690 |
| 57. | Parsons | 14.5% | 6.2%(+8.32)#57 | 5.0%(+9.55)#2,733 |
| 58. | Fort Gay | 14.5% | 6.2%(+8.23)#58 | 5.0%(+9.46)#2,758 |
| 59. | Accoville | 14.2% | 6.2%(+7.93)#59 | 5.0%(+9.16)#2,862 |
| 60. | Danville | 13.7% | 6.2%(+7.52)#60 | 5.0%(+8.74)#3,038 |
| 61. | Hendricks | 13.6% | 6.2%(+7.42)#61 | 5.0%(+8.64)#3,082 |
| 62. | Kingwood | 13.5% | 6.2%(+7.29)#62 | 5.0%(+8.51)#3,143 |
| 63. | Ronceverte | 13.2% | 6.2%(+6.97)#63 | 5.0%(+8.19)#3,295 |
| 64. | Gilbert Creek | 13.0% | 6.2%(+6.81)#64 | 5.0%(+8.03)#3,377 |
| 65. | Gassaway | 12.9% | 6.2%(+6.65)#65 | 5.0%(+7.88)#3,452 |
| 66. | Gallipolis Ferry | 12.8% | 6.2%(+6.57)#66 | 5.0%(+7.80)#3,492 |
| 67. | Jane Lew | 12.8% | 6.2%(+6.54)#67 | 5.0%(+7.76)#3,511 |
| 68. | Pine Grove | 12.7% | 6.2%(+6.44)#68 | 5.0%(+7.66)#3,552 |
| 69. | Mullens | 12.6% | 6.2%(+6.37)#69 | 5.0%(+7.60)#3,580 |
| 70. | Mallory | 12.6% | 6.2%(+6.35)#70 | 5.0%(+7.57)#3,594 |
| 71. | Farmington | 12.6% | 6.2%(+6.34)#71 | 5.0%(+7.57)#3,599 |
| 72. | Rivesville | 12.5% | 6.2%(+6.28)#72 | 5.0%(+7.51)#3,618 |
| 73. | Tioga | 12.0% | 6.2%(+5.83)#73 | 5.0%(+7.05)#3,892 |
| 74. | Washington | 12.0% | 6.2%(+5.77)#74 | 5.0%(+7.00)#3,933 |
| 75. | Bruceton Mills | 11.9% | 6.2%(+5.72)#75 | 5.0%(+6.95)#3,966 |
| 76. | Womelsdorf Coalton | 11.5% | 6.2%(+5.26)#76 | 5.0%(+6.48)#4,285 |
| 77. | Ceredo | 11.5% | 6.2%(+5.23)#77 | 5.0%(+6.46)#4,300 |
| 78. | Valley Bend | 11.3% | 6.2%(+5.08)#78 | 5.0%(+6.30)#4,420 |
| 79. | War | 11.2% | 6.2%(+5.01)#79 | 5.0%(+6.23)#4,469 |
| 80. | Kermit | 11.1% | 6.2%(+4.89)#80 | 5.0%(+6.12)#4,584 |
| 81. | Valley Grove | 10.9% | 6.2%(+4.70)#81 | 5.0%(+5.92)#4,727 |
| 82. | Shinnston | 10.9% | 6.2%(+4.66)#82 | 5.0%(+5.88)#4,763 |
| 83. | West Milford | 10.8% | 6.2%(+4.61)#83 | 5.0%(+5.84)#4,795 |
| 84. | Carpendale | 10.8% | 6.2%(+4.58)#84 | 5.0%(+5.80)#4,817 |
| 85. | Glen Dale | 10.7% | 6.2%(+4.45)#85 | 5.0%(+5.67)#4,935 |
| 86. | Bolivar | 10.5% | 6.2%(+4.29)#86 | 5.0%(+5.51)#5,075 |
| 87. | Ravenswood | 10.5% | 6.2%(+4.26)#87 | 5.0%(+5.48)#5,094 |
| 88. | Windsor Heights | 10.5% | 6.2%(+4.24)#88 | 5.0%(+5.46)#5,115 |
| 89. | Henderson | 10.4% | 6.2%(+4.20)#89 | 5.0%(+5.42)#5,139 |
| 90. | Macarthur | 10.4% | 6.2%(+4.17)#90 | 5.0%(+5.39)#5,166 |
| 91. | Stanaford | 10.3% | 6.2%(+4.08)#91 | 5.0%(+5.31)#5,269 |
| 92. | Ellenboro | 10.2% | 6.2%(+4.01)#92 | 5.0%(+5.23)#5,330 |
| 93. | Montrose | 10.2% | 6.2%(+3.95)#93 | 5.0%(+5.18)#5,375 |
| 94. | Anmoore | 10.1% | 6.2%(+3.92)#94 | 5.0%(+5.14)#5,411 |
| 95. | New Haven | 10.1% | 6.2%(+3.87)#95 | 5.0%(+5.09)#5,454 |
| 96. | Craigsville | 10.1% | 6.2%(+3.85)#96 | 5.0%(+5.08)#5,470 |
| 97. | Flatwoods | 10.0% | 6.2%(+3.78)#97 | 5.0%(+5.01)#5,539 |
| 98. | Chapmanville | 9.9% | 6.2%(+3.66)#98 | 5.0%(+4.88)#5,685 |
| 99. | Man | 9.8% | 6.2%(+3.56)#99 | 5.0%(+4.78)#5,780 |
| 100. | Wiley Ford | 9.7% | 6.2%(+3.51)#100 | 5.0%(+4.73)#5,831 |
Common Questions
What are the Top 10 Cities with the Highest Percentage of Population Employed in Construction & Extraction in West Virginia?
Top 10 Cities with the Highest Percentage of Population Employed in Construction & Extraction in West Virginia are:
#1
100.0%
#2
66.7%
#3
60.0%
#4
59.4%
#5
57.1%
#6
51.7%
#7
44.3%
#8
41.2%
#9
39.0%
#10
37.6%
What city has the Highest Percentage of Population Employed in Construction & Extraction in West Virginia?
Littleton has the Highest Percentage of Population Employed in Construction & Extraction in West Virginia with 100.0%.
What is the Percentage of Population Employed in Construction & Extraction in the State of West Virginia?
Percentage of Population Employed in Construction & Extraction in West Virginia is 6.2%.
What is the Percentage of Population Employed in Construction & Extraction in the United States?
Percentage of Population Employed in Construction & Extraction in the United States is 5.0%.