Cities with the Highest Percentage of Population Employed in Construction & Extraction in New York
RELATED REPORTS & OPTIONS
Construction & Extraction
New York
Compare Cities
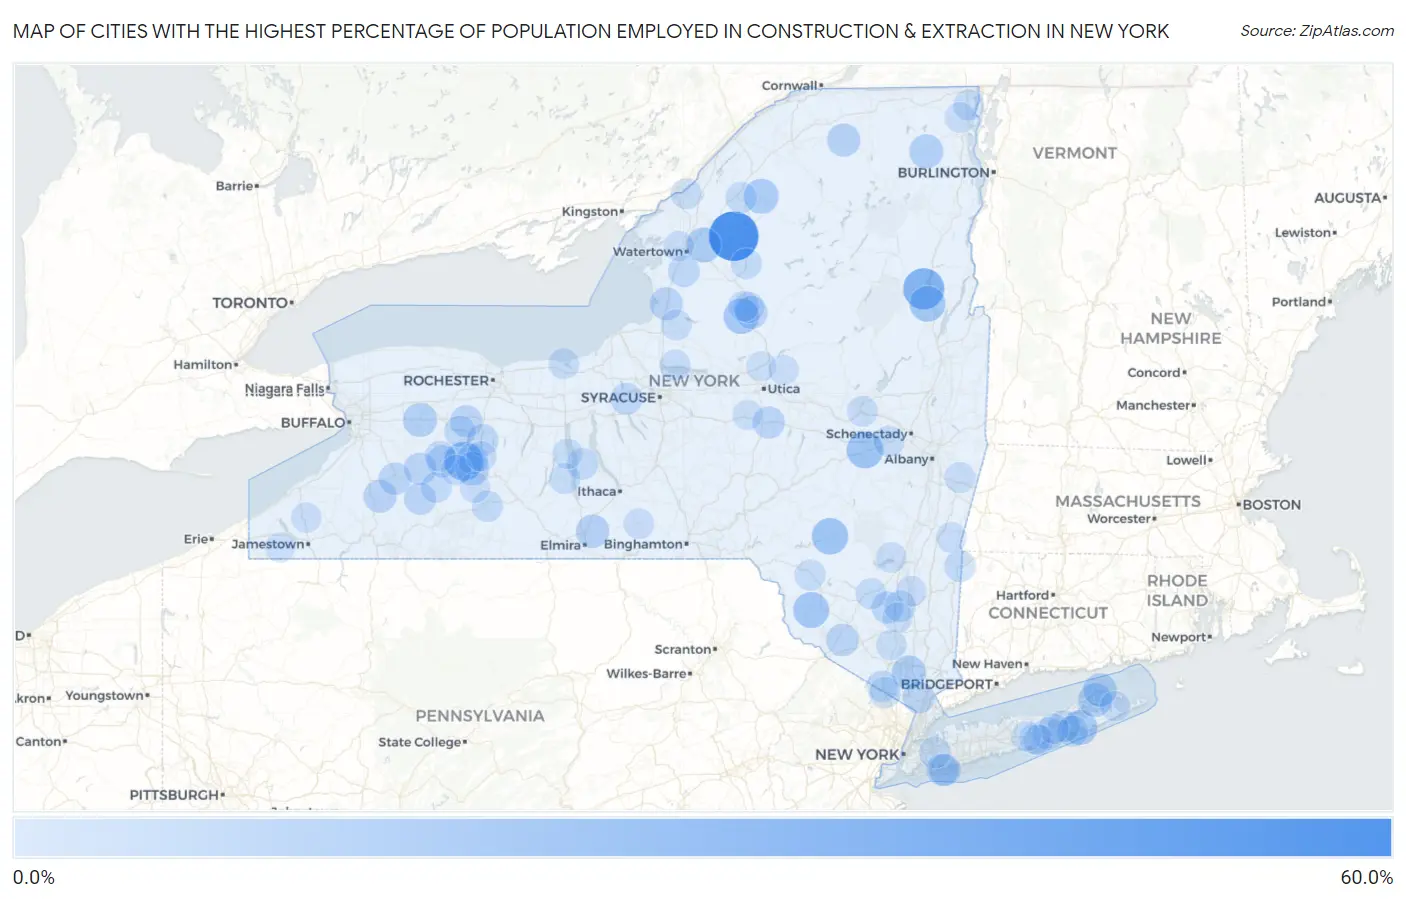
Map of Cities with the Highest Percentage of Population Employed in Construction & Extraction in New York
0.0%
60.0%
Cities with the Highest Percentage of Population Employed in Construction & Extraction in New York
| City | % Employed | vs State | vs National | |
| 1. | Natural Bridge | 55.3% | 4.3%(+51.0)#1 | 5.0%(+50.3)#129 |
| 2. | Eagle Bay | 50.0% | 4.3%(+45.7)#2 | 5.0%(+45.0)#181 |
| 3. | Cementon | 43.2% | 4.3%(+38.9)#3 | 5.0%(+38.2)#240 |
| 4. | Haines Falls | 36.7% | 4.3%(+32.3)#4 | 5.0%(+31.7)#347 |
| 5. | Pottersville | 35.4% | 4.3%(+31.1)#5 | 5.0%(+30.4)#375 |
| 6. | Tuscarora | 29.8% | 4.3%(+25.5)#6 | 5.0%(+24.8)#556 |
| 7. | Central Bridge | 25.3% | 4.3%(+21.0)#7 | 5.0%(+20.3)#812 |
| 8. | Margaretville | 24.6% | 4.3%(+20.3)#8 | 5.0%(+19.6)#868 |
| 9. | Hankins | 23.4% | 4.3%(+19.1)#9 | 5.0%(+18.4)#970 |
| 10. | Smallwood | 23.4% | 4.3%(+19.0)#10 | 5.0%(+18.4)#978 |
| 11. | Chestertown | 23.3% | 4.3%(+18.9)#11 | 5.0%(+18.3)#988 |
| 12. | Constableville | 22.5% | 4.3%(+18.1)#12 | 5.0%(+17.5)#1,071 |
| 13. | Shinnecock Hills | 21.3% | 4.3%(+16.9)#13 | 5.0%(+16.3)#1,210 |
| 14. | Felts Mills | 21.2% | 4.3%(+16.9)#14 | 5.0%(+16.2)#1,213 |
| 15. | Edwards | 21.1% | 4.3%(+16.7)#15 | 5.0%(+16.1)#1,229 |
| 16. | South Edmeston | 19.6% | 4.3%(+15.2)#16 | 5.0%(+14.6)#1,437 |
| 17. | Verplanck | 19.4% | 4.3%(+15.1)#17 | 5.0%(+14.4)#1,461 |
| 18. | Redford | 19.2% | 4.3%(+14.8)#18 | 5.0%(+14.2)#1,511 |
| 19. | Alexander | 19.1% | 4.3%(+14.8)#19 | 5.0%(+14.2)#1,514 |
| 20. | Shelter Island Heights | 19.0% | 4.3%(+14.6)#20 | 5.0%(+14.0)#1,542 |
| 21. | Springwater | 18.3% | 4.3%(+14.0)#21 | 5.0%(+13.3)#1,661 |
| 22. | Byersville | 18.2% | 4.3%(+13.9)#22 | 5.0%(+13.2)#1,696 |
| 23. | Orient | 18.1% | 4.3%(+13.8)#23 | 5.0%(+13.2)#1,705 |
| 24. | Breesport | 17.8% | 4.3%(+13.5)#24 | 5.0%(+12.8)#1,778 |
| 25. | Bridgeville | 17.6% | 4.3%(+13.3)#25 | 5.0%(+12.7)#1,816 |
| 26. | St Regis Falls | 17.6% | 4.3%(+13.3)#26 | 5.0%(+12.6)#1,824 |
| 27. | Brewster Heights | 17.2% | 4.3%(+12.9)#27 | 5.0%(+12.2)#1,912 |
| 28. | Sandy Creek | 16.9% | 4.3%(+12.6)#28 | 5.0%(+11.9)#1,981 |
| 29. | West Valley | 16.8% | 4.3%(+12.5)#29 | 5.0%(+11.8)#1,994 |
| 30. | Port Leyden | 16.7% | 4.3%(+12.3)#30 | 5.0%(+11.7)#2,034 |
| 31. | Otisville | 15.9% | 4.3%(+11.6)#31 | 5.0%(+11.0)#2,248 |
| 32. | Eastport | 15.9% | 4.3%(+11.6)#32 | 5.0%(+10.9)#2,273 |
| 33. | Yorkshire | 15.8% | 4.3%(+11.5)#33 | 5.0%(+10.8)#2,292 |
| 34. | West Winfield | 15.6% | 4.3%(+11.2)#34 | 5.0%(+10.6)#2,364 |
| 35. | Bliss | 15.4% | 4.3%(+11.1)#35 | 5.0%(+10.4)#2,403 |
| 36. | Mountain Dale | 15.3% | 4.3%(+10.9)#36 | 5.0%(+10.3)#2,455 |
| 37. | Rushford | 15.1% | 4.3%(+10.8)#37 | 5.0%(+10.1)#2,512 |
| 38. | Castile | 15.0% | 4.3%(+10.7)#38 | 5.0%(+10.0)#2,535 |
| 39. | Fowlerville | 15.0% | 4.3%(+10.7)#39 | 5.0%(+10.0)#2,545 |
| 40. | Harbor Isle | 14.9% | 4.3%(+10.6)#40 | 5.0%(+9.91)#2,583 |
| 41. | Sleepy Hollow | 14.9% | 4.3%(+10.5)#41 | 5.0%(+9.86)#2,600 |
| 42. | Gardiner | 14.8% | 4.3%(+10.5)#42 | 5.0%(+9.83)#2,615 |
| 43. | Barnum Island | 14.7% | 4.3%(+10.4)#43 | 5.0%(+9.75)#2,654 |
| 44. | Conesus Lake | 14.6% | 4.3%(+10.3)#44 | 5.0%(+9.63)#2,700 |
| 45. | Hartwick Seminary | 14.6% | 4.3%(+10.3)#45 | 5.0%(+9.59)#2,711 |
| 46. | Flanders | 14.5% | 4.3%(+10.2)#46 | 5.0%(+9.49)#2,749 |
| 47. | Elbridge | 14.3% | 4.3%(+9.98)#47 | 5.0%(+9.32)#2,795 |
| 48. | Rodman | 14.1% | 4.3%(+9.77)#48 | 5.0%(+9.11)#2,883 |
| 49. | Bellerose Terrace | 14.0% | 4.3%(+9.71)#49 | 5.0%(+9.05)#2,906 |
| 50. | Mastic | 13.9% | 4.3%(+9.55)#50 | 5.0%(+8.88)#2,984 |
| 51. | Clintondale | 13.8% | 4.3%(+9.45)#51 | 5.0%(+8.79)#3,023 |
| 52. | Lodi | 13.7% | 4.3%(+9.38)#52 | 5.0%(+8.72)#3,049 |
| 53. | Greigsville | 13.6% | 4.3%(+9.31)#53 | 5.0%(+8.64)#3,085 |
| 54. | Sloatsburg | 13.5% | 4.3%(+9.14)#54 | 5.0%(+8.48)#3,155 |
| 55. | Millerton | 13.4% | 4.3%(+9.11)#55 | 5.0%(+8.45)#3,170 |
| 56. | Hillburn | 13.4% | 4.3%(+9.08)#56 | 5.0%(+8.41)#3,192 |
| 57. | Wingdale | 13.2% | 4.3%(+8.83)#57 | 5.0%(+8.16)#3,301 |
| 58. | Hailesboro | 13.1% | 4.3%(+8.73)#58 | 5.0%(+8.07)#3,356 |
| 59. | Hampton Bays | 13.0% | 4.3%(+8.71)#59 | 5.0%(+8.04)#3,375 |
| 60. | Kerhonkson | 13.0% | 4.3%(+8.64)#60 | 5.0%(+7.98)#3,408 |
| 61. | North Hornell | 12.9% | 4.3%(+8.60)#61 | 5.0%(+7.93)#3,425 |
| 62. | Duanesburg | 12.7% | 4.3%(+8.39)#62 | 5.0%(+7.73)#3,533 |
| 63. | Fillmore | 12.6% | 4.3%(+8.26)#63 | 5.0%(+7.59)#3,583 |
| 64. | Croghan | 12.6% | 4.3%(+8.25)#64 | 5.0%(+7.59)#3,590 |
| 65. | Kysorville | 12.5% | 4.3%(+8.17)#65 | 5.0%(+7.51)#3,648 |
| 66. | Sodus Point | 12.4% | 4.3%(+8.09)#66 | 5.0%(+7.43)#3,689 |
| 67. | Lyons Falls | 12.4% | 4.3%(+8.04)#67 | 5.0%(+7.37)#3,713 |
| 68. | East Nassau | 12.3% | 4.3%(+8.02)#68 | 5.0%(+7.35)#3,723 |
| 69. | Livingston Manor | 12.3% | 4.3%(+8.01)#69 | 5.0%(+7.35)#3,730 |
| 70. | Silver Springs | 12.3% | 4.3%(+8.00)#70 | 5.0%(+7.34)#3,732 |
| 71. | Altmar | 12.3% | 4.3%(+7.98)#71 | 5.0%(+7.31)#3,745 |
| 72. | Dundee | 12.3% | 4.3%(+7.97)#72 | 5.0%(+7.31)#3,750 |
| 73. | Alexandria Bay | 12.3% | 4.3%(+7.97)#73 | 5.0%(+7.30)#3,753 |
| 74. | Constantia | 12.3% | 4.3%(+7.94)#74 | 5.0%(+7.28)#3,772 |
| 75. | Turin | 12.2% | 4.3%(+7.92)#75 | 5.0%(+7.25)#3,782 |
| 76. | Chazy | 12.2% | 4.3%(+7.88)#76 | 5.0%(+7.21)#3,805 |
| 77. | Fonda | 12.0% | 4.3%(+7.63)#77 | 5.0%(+6.96)#3,954 |
| 78. | Hyde Park | 11.8% | 4.3%(+7.48)#78 | 5.0%(+6.82)#4,049 |
| 79. | Canaseraga | 11.8% | 4.3%(+7.44)#79 | 5.0%(+6.77)#4,082 |
| 80. | Candor | 11.7% | 4.3%(+7.42)#80 | 5.0%(+6.76)#4,109 |
| 81. | West Chazy | 11.7% | 4.3%(+7.41)#81 | 5.0%(+6.74)#4,119 |
| 82. | Nunda | 11.7% | 4.3%(+7.37)#82 | 5.0%(+6.71)#4,135 |
| 83. | Brownville | 11.7% | 4.3%(+7.37)#83 | 5.0%(+6.71)#4,139 |
| 84. | West Hurley | 11.7% | 4.3%(+7.34)#84 | 5.0%(+6.67)#4,162 |
| 85. | Moriches | 11.7% | 4.3%(+7.33)#85 | 5.0%(+6.67)#4,167 |
| 86. | Westford | 11.4% | 4.3%(+7.03)#86 | 5.0%(+6.37)#4,363 |
| 87. | Copake Lake | 11.3% | 4.3%(+6.98)#87 | 5.0%(+6.32)#4,412 |
| 88. | Salisbury Mills | 11.3% | 4.3%(+6.95)#88 | 5.0%(+6.28)#4,434 |
| 89. | Sinclairville | 11.2% | 4.3%(+6.83)#89 | 5.0%(+6.17)#4,527 |
| 90. | Northampton | 11.2% | 4.3%(+6.83)#90 | 5.0%(+6.16)#4,528 |
| 91. | Dresden | 11.1% | 4.3%(+6.78)#91 | 5.0%(+6.12)#4,572 |
| 92. | Yaphank | 11.0% | 4.3%(+6.70)#92 | 5.0%(+6.03)#4,642 |
| 93. | Panama | 11.0% | 4.3%(+6.69)#93 | 5.0%(+6.03)#4,648 |
| 94. | Waterville | 11.0% | 4.3%(+6.65)#94 | 5.0%(+5.99)#4,669 |
| 95. | Poland | 11.0% | 4.3%(+6.63)#95 | 5.0%(+5.97)#4,687 |
| 96. | Plattekill | 10.9% | 4.3%(+6.56)#96 | 5.0%(+5.90)#4,749 |
| 97. | Scottsburg | 10.9% | 4.3%(+6.54)#97 | 5.0%(+5.88)#4,771 |
| 98. | Wassaic | 10.9% | 4.3%(+6.52)#98 | 5.0%(+5.86)#4,780 |
| 99. | Holland Patent | 10.7% | 4.3%(+6.41)#99 | 5.0%(+5.74)#4,871 |
| 100. | Springs | 10.7% | 4.3%(+6.39)#100 | 5.0%(+5.72)#4,883 |
Common Questions
What are the Top 10 Cities with the Highest Percentage of Population Employed in Construction & Extraction in New York?
Top 10 Cities with the Highest Percentage of Population Employed in Construction & Extraction in New York are:
#1
55.3%
#2
35.4%
#3
29.8%
#4
25.3%
#5
24.6%
#6
23.4%
#7
23.3%
#8
22.5%
#9
21.3%
#10
21.2%
What city has the Highest Percentage of Population Employed in Construction & Extraction in New York?
Natural Bridge has the Highest Percentage of Population Employed in Construction & Extraction in New York with 55.3%.
What is the Percentage of Population Employed in Construction & Extraction in the State of New York?
Percentage of Population Employed in Construction & Extraction in New York is 4.3%.
What is the Percentage of Population Employed in Construction & Extraction in the United States?
Percentage of Population Employed in Construction & Extraction in the United States is 5.0%.