Cities with the Highest Percentage of Population Employed in Construction & Extraction in Wyoming
RELATED REPORTS & OPTIONS
Construction & Extraction
Wyoming
Compare Cities
Map of Cities with the Highest Percentage of Population Employed in Construction & Extraction in Wyoming
0.0%
100.0%
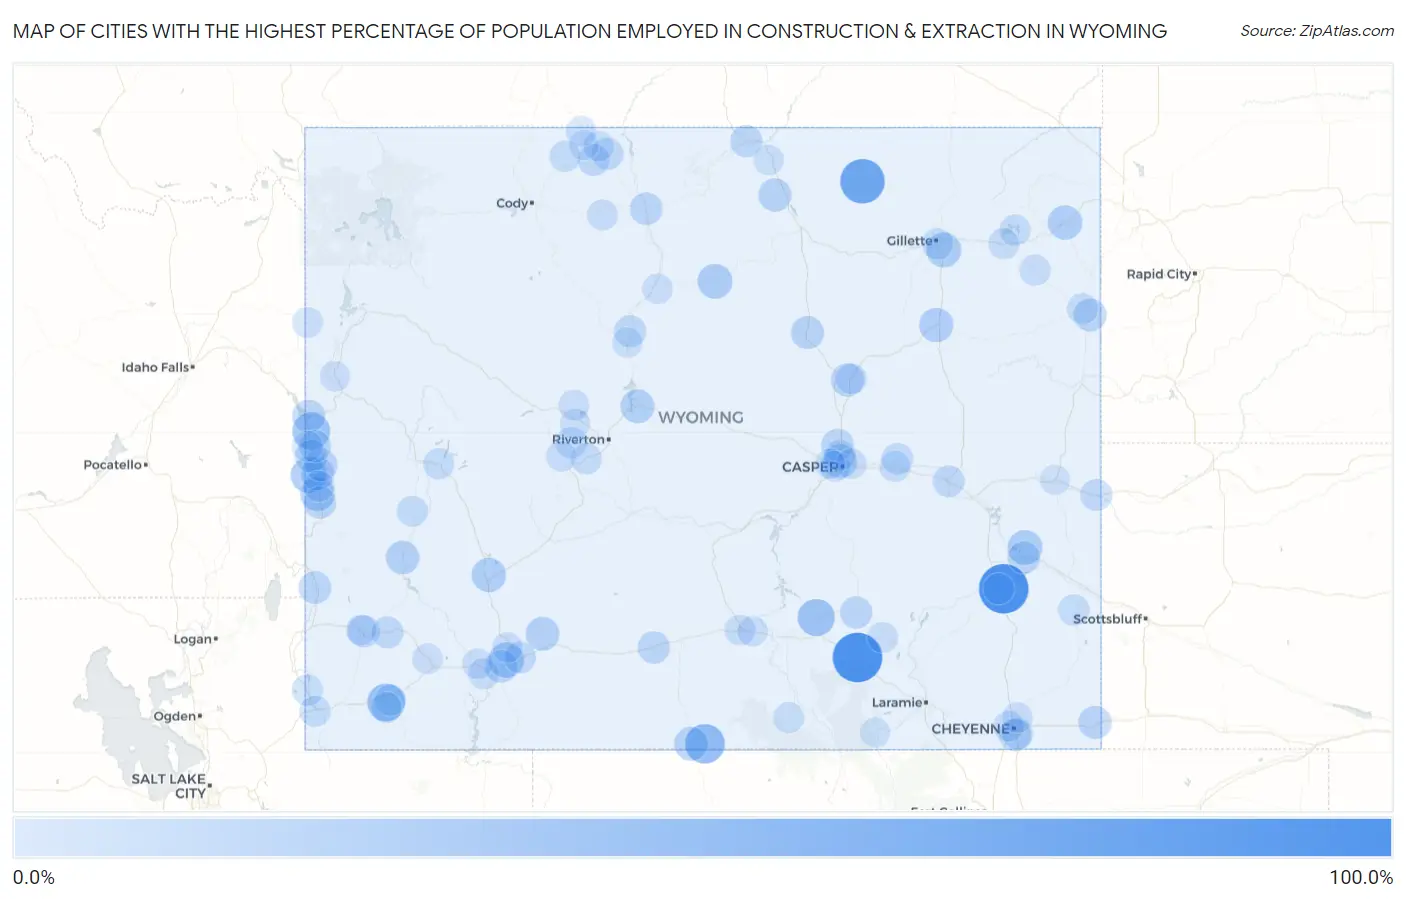
Cities with the Highest Percentage of Population Employed in Construction & Extraction in Wyoming
| City | % Employed | vs State | vs National | |
| 1. | Chugcreek | 100.0% | 8.6% (+91.4)#1 | 5.0% (+95.0)#12 |
| 2. | Arlington | 100.0% | 8.6% (+91.4)#2 | 5.0% (+95.0)#36 |
| 3. | Arvada | 75.0% | 8.6% (+66.4)#3 | 5.0% (+70.0)#59 |
| 4. | Dixon | 50.0% | 8.6% (+41.4)#4 | 5.0% (+45.0)#167 |
| 5. | Urie | 42.9% | 8.6% (+34.2)#5 | 5.0% (+37.9)#242 |
| 6. | Nordic | 41.7% | 8.6% (+33.0)#6 | 5.0% (+36.7)#259 |
| 7. | Hanna | 38.8% | 8.6% (+30.2)#7 | 5.0% (+33.9)#300 |
| 8. | Auburn | 33.7% | 8.6% (+25.1)#8 | 5.0% (+28.7)#407 |
| 9. | Clearview Acres | 30.9% | 8.6% (+22.2)#9 | 5.0% (+25.9)#505 |
| 10. | Sleepy Hollow | 28.9% | 8.6% (+20.2)#10 | 5.0% (+23.9)#593 |
| 11. | Ten Sleep | 28.9% | 8.6% (+20.2)#11 | 5.0% (+23.9)#595 |
| 12. | Hartville | 28.6% | 8.6% (+19.9)#12 | 5.0% (+23.6)#613 |
| 13. | Osmond | 26.5% | 8.6% (+17.9)#13 | 5.0% (+21.5)#749 |
| 14. | Farson | 25.9% | 8.6% (+17.2)#14 | 5.0% (+20.9)#778 |
| 15. | Sundance | 25.9% | 8.6% (+17.2)#15 | 5.0% (+20.9)#779 |
| 16. | Wright | 25.4% | 8.6% (+16.8)#16 | 5.0% (+20.4)#804 |
| 17. | Hartrandt | 24.2% | 8.6% (+15.6)#17 | 5.0% (+19.2)#899 |
| 18. | Shoshoni | 23.8% | 8.6% (+15.2)#18 | 5.0% (+18.9)#934 |
| 19. | Baggs | 23.3% | 8.6% (+14.6)#19 | 5.0% (+18.3)#987 |
| 20. | Superior | 23.1% | 8.6% (+14.4)#20 | 5.0% (+18.1)#1,001 |
| 21. | La Barge | 22.5% | 8.6% (+13.9)#21 | 5.0% (+17.5)#1,063 |
| 22. | Grover | 21.3% | 8.6% (+12.6)#22 | 5.0% (+16.3)#1,203 |
| 23. | Midwest | 20.7% | 8.6% (+12.0)#23 | 5.0% (+15.7)#1,287 |
| 24. | Story | 20.7% | 8.6% (+12.0)#24 | 5.0% (+15.7)#1,288 |
| 25. | Kaycee | 20.2% | 8.6% (+11.5)#25 | 5.0% (+15.2)#1,345 |
| 26. | Pine Bluffs | 20.0% | 8.6% (+11.3)#26 | 5.0% (+15.0)#1,382 |
| 27. | Alpine | 19.1% | 8.6% (+10.5)#27 | 5.0% (+14.1)#1,519 |
| 28. | Hill View Heights | 18.8% | 8.6% (+10.1)#28 | 5.0% (+13.8)#1,585 |
| 29. | Turnerville | 18.4% | 8.6% (+9.75)#29 | 5.0% (+13.4)#1,646 |
| 30. | Cokeville | 18.0% | 8.6% (+9.33)#30 | 5.0% (+13.0)#1,741 |
| 31. | Thayne | 17.9% | 8.6% (+9.23)#31 | 5.0% (+12.9)#1,760 |
| 32. | Purple Sage | 17.8% | 8.6% (+9.15)#32 | 5.0% (+12.8)#1,779 |
| 33. | Greybull | 17.7% | 8.6% (+9.08)#33 | 5.0% (+12.7)#1,804 |
| 34. | Guernsey | 16.7% | 8.6% (+8.07)#34 | 5.0% (+11.7)#2,024 |
| 35. | Smoot | 16.7% | 8.6% (+8.02)#35 | 5.0% (+11.7)#2,036 |
| 36. | Wamsutter | 16.7% | 8.6% (+8.02)#36 | 5.0% (+11.7)#2,045 |
| 37. | Homa Hills | 16.7% | 8.6% (+8.02)#37 | 5.0% (+11.7)#2,048 |
| 38. | South Greeley | 16.6% | 8.6% (+7.98)#38 | 5.0% (+11.6)#2,074 |
| 39. | Medicine Bow | 16.4% | 8.6% (+7.80)#39 | 5.0% (+11.5)#2,112 |
| 40. | Star Valley Ranch | 16.1% | 8.6% (+7.44)#40 | 5.0% (+11.1)#2,215 |
| 41. | Ranchester | 15.5% | 8.6% (+6.83)#41 | 5.0% (+10.5)#2,385 |
| 42. | Diamondville | 15.4% | 8.6% (+6.79)#42 | 5.0% (+10.4)#2,390 |
| 43. | Lovell | 15.4% | 8.6% (+6.72)#43 | 5.0% (+10.4)#2,428 |
| 44. | Lucerne | 15.2% | 8.6% (+6.50)#44 | 5.0% (+10.2)#2,502 |
| 45. | Byron | 14.7% | 8.6% (+6.03)#45 | 5.0% (+9.68)#2,675 |
| 46. | Opal | 14.6% | 8.6% (+5.99)#46 | 5.0% (+9.64)#2,698 |
| 47. | Van Tassell | 14.3% | 8.6% (+5.64)#47 | 5.0% (+9.29)#2,831 |
| 48. | Douglas | 14.3% | 8.6% (+5.63)#48 | 5.0% (+9.29)#2,833 |
| 49. | Rock Springs | 13.8% | 8.6% (+5.20)#49 | 5.0% (+8.85)#2,995 |
| 50. | Rolling Hills | 12.6% | 8.6% (+3.98)#50 | 5.0% (+7.64)#3,563 |
| 51. | Gillette | 12.3% | 8.6% (+3.68)#51 | 5.0% (+7.33)#3,741 |
| 52. | Fox Farm College | 11.9% | 8.6% (+3.28)#52 | 5.0% (+6.93)#3,970 |
| 53. | Ethete | 11.9% | 8.6% (+3.22)#53 | 5.0% (+6.87)#4,015 |
| 54. | Powell | 11.4% | 8.6% (+2.78)#54 | 5.0% (+6.44)#4,311 |
| 55. | Newcastle | 11.4% | 8.6% (+2.78)#55 | 5.0% (+6.44)#4,312 |
| 56. | Yoder | 11.4% | 8.6% (+2.78)#56 | 5.0% (+6.43)#4,323 |
| 57. | Lyman | 11.4% | 8.6% (+2.75)#57 | 5.0% (+6.40)#4,342 |
| 58. | Pine Haven | 11.4% | 8.6% (+2.70)#58 | 5.0% (+6.36)#4,371 |
| 59. | Hudson | 11.3% | 8.6% (+2.66)#59 | 5.0% (+6.31)#4,414 |
| 60. | Bear River | 11.3% | 8.6% (+2.63)#60 | 5.0% (+6.29)#4,431 |
| 61. | Evanston | 11.2% | 8.6% (+2.57)#61 | 5.0% (+6.22)#4,476 |
| 62. | Wheatland | 11.1% | 8.6% (+2.46)#62 | 5.0% (+6.12)#4,559 |
| 63. | Afton | 11.1% | 8.6% (+2.41)#63 | 5.0% (+6.06)#4,627 |
| 64. | Pinedale | 10.9% | 8.6% (+2.23)#64 | 5.0% (+5.89)#4,760 |
| 65. | Mountain View | 10.9% | 8.6% (+2.23)#65 | 5.0% (+5.88)#4,766 |
| 66. | Marbleton | 10.8% | 8.6% (+2.14)#66 | 5.0% (+5.80)#4,822 |
| 67. | Upton | 10.7% | 8.6% (+2.02)#67 | 5.0% (+5.68)#4,931 |
| 68. | Edgerton | 10.6% | 8.6% (+1.99)#68 | 5.0% (+5.64)#4,963 |
| 69. | Moorcroft | 10.5% | 8.6% (+1.82)#69 | 5.0% (+5.48)#5,104 |
| 70. | Bar Nunn | 10.5% | 8.6% (+1.81)#70 | 5.0% (+5.47)#5,108 |
| 71. | Green River | 10.3% | 8.6% (+1.66)#71 | 5.0% (+5.32)#5,262 |
| 72. | Glenrock | 10.3% | 8.6% (+1.66)#72 | 5.0% (+5.31)#5,266 |
| 73. | Encampment | 10.3% | 8.6% (+1.64)#73 | 5.0% (+5.29)#5,281 |
| 74. | Mills | 10.1% | 8.6% (+1.50)#74 | 5.0% (+5.15)#5,405 |
| 75. | Freedom | 10.0% | 8.6% (+1.35)#75 | 5.0% (+5.01)#5,555 |
| 76. | Burlington | 9.6% | 8.6% (+1.00)#76 | 5.0% (+4.66)#5,909 |
| 77. | Warren Afb | 9.6% | 8.6% (+0.910)#77 | 5.0% (+4.56)#5,996 |
| 78. | Rock River | 9.4% | 8.6% (+0.704)#78 | 5.0% (+4.36)#6,217 |
| 79. | Rawlins | 9.2% | 8.6% (+0.569)#79 | 5.0% (+4.22)#6,380 |
| 80. | Alta | 9.1% | 8.6% (+0.417)#80 | 5.0% (+4.07)#6,581 |
| 81. | Evansville | 9.0% | 8.6% (+0.356)#81 | 5.0% (+4.01)#6,645 |
| 82. | Cowley | 8.8% | 8.6% (+0.143)#82 | 5.0% (+3.80)#6,890 |
| 83. | Worland | 8.7% | 8.6% (+0.076)#83 | 5.0% (+3.73)#6,986 |
| 84. | Granger | 8.7% | 8.6% (+0.047)#84 | 5.0% (+3.70)#7,033 |
| 85. | James Town | 8.6% | 8.6% (-0.034)#85 | 5.0% (+3.62)#7,145 |
| 86. | Sinclair | 8.4% | 8.6% (-0.215)#86 | 5.0% (+3.44)#7,411 |
| 87. | Ranchettes | 8.2% | 8.6% (-0.400)#87 | 5.0% (+3.25)#7,673 |
| 88. | Boulder Flats | 8.2% | 8.6% (-0.452)#88 | 5.0% (+3.20)#7,758 |
| 89. | Kemmerer | 8.2% | 8.6% (-0.462)#89 | 5.0% (+3.19)#7,773 |
| 90. | Pavillion | 8.1% | 8.6% (-0.541)#90 | 5.0% (+3.11)#7,895 |
| 91. | Sheridan | 8.0% | 8.6% (-0.625)#91 | 5.0% (+3.03)#8,015 |
| 92. | North Rock Springs | 8.0% | 8.6% (-0.693)#92 | 5.0% (+2.96)#8,124 |
| 93. | Frannie | 7.7% | 8.6% (-0.956)#93 | 5.0% (+2.70)#8,557 |
| 94. | Rafter J Ranch | 7.7% | 8.6% (-0.976)#94 | 5.0% (+2.68)#8,603 |
| 95. | Woods Landing Jelm | 7.6% | 8.6% (-1.04)#95 | 5.0% (+2.61)#8,694 |
| 96. | Thermopolis | 7.5% | 8.6% (-1.18)#96 | 5.0% (+2.47)#8,937 |
| 97. | Vista West | 7.2% | 8.6% (-1.49)#97 | 5.0% (+2.17)#9,446 |
| 98. | Deaver | 7.0% | 8.6% (-1.61)#98 | 5.0% (+2.05)#9,688 |
| 99. | Lusk | 6.9% | 8.6% (-1.73)#99 | 5.0% (+1.93)#9,917 |
| 100. | Johnstown | 6.8% | 8.6% (-1.81)#100 | 5.0% (+1.84)#10,074 |
1
2Common Questions
What are the Top 10 Cities with the Highest Percentage of Population Employed in Construction & Extraction in Wyoming?
Top 10 Cities with the Highest Percentage of Population Employed in Construction & Extraction in Wyoming are:
#1
100.0%
#2
100.0%
#3
75.0%
#4
50.0%
#5
42.9%
#6
41.7%
#7
38.8%
#8
33.7%
#9
30.9%
#10
28.9%
What city has the Highest Percentage of Population Employed in Construction & Extraction in Wyoming?
Chugcreek has the Highest Percentage of Population Employed in Construction & Extraction in Wyoming with 100.0%.
What is the Percentage of Population Employed in Construction & Extraction in the State of Wyoming?
Percentage of Population Employed in Construction & Extraction in Wyoming is 8.6%.
What is the Percentage of Population Employed in Construction & Extraction in the United States?
Percentage of Population Employed in Construction & Extraction in the United States is 5.0%.