Cities with the Highest Percentage of Population Employed in Construction & Extraction in Illinois
RELATED REPORTS & OPTIONS
Construction & Extraction
Illinois
Compare Cities
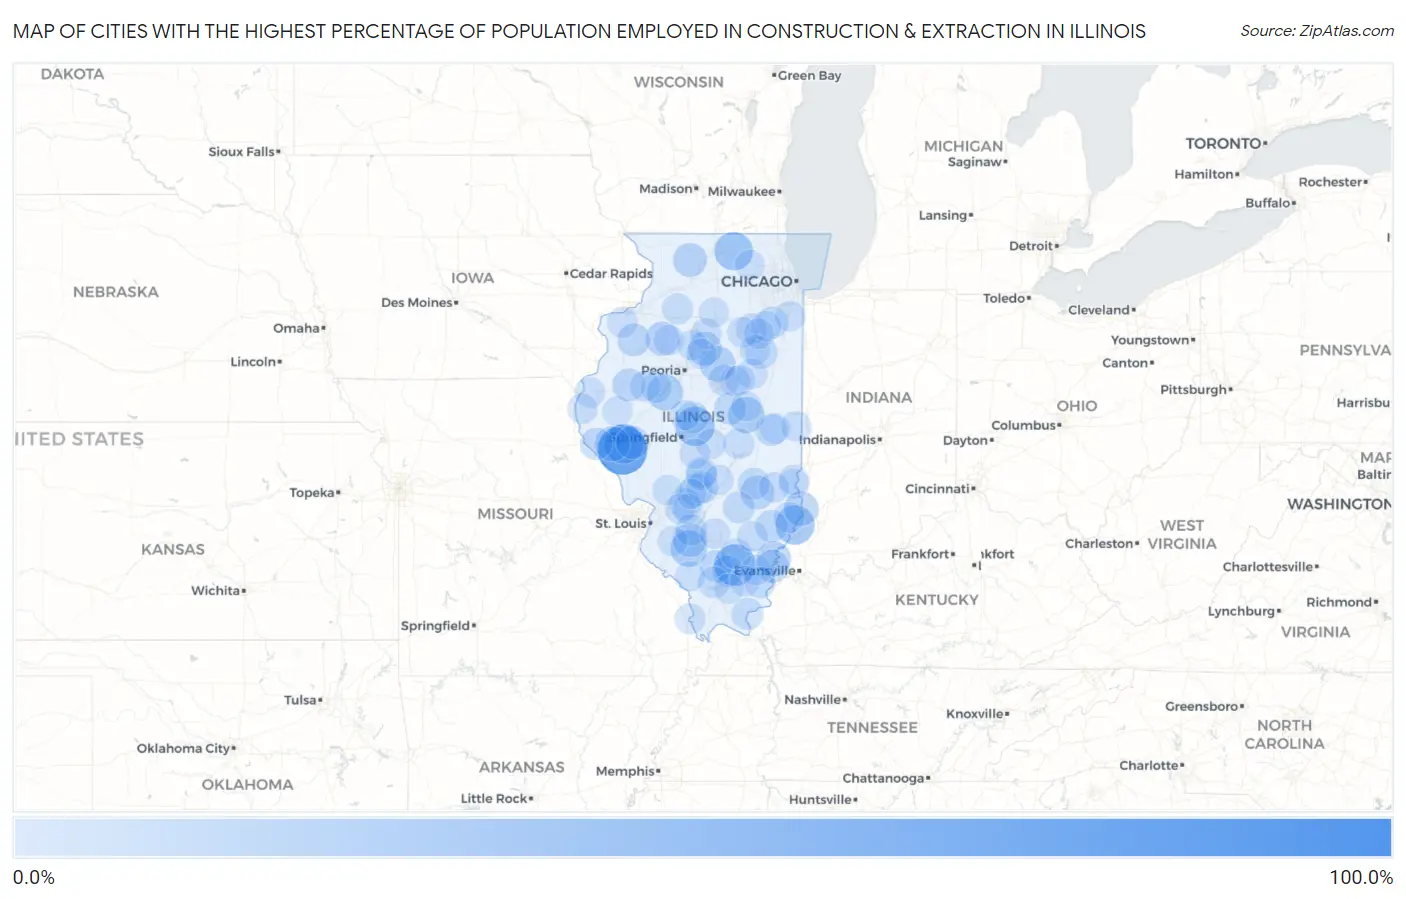
Map of Cities with the Highest Percentage of Population Employed in Construction & Extraction in Illinois
0.0%
100.0%
Cities with the Highest Percentage of Population Employed in Construction & Extraction in Illinois
| City | % Employed | vs State | vs National | |
| 1. | Lorenzo | 100.0% | 4.1%(+95.9)#1 | 5.0%(+95.0)#17 |
| 2. | Detroit | 76.9% | 4.1%(+72.8)#2 | 5.0%(+71.9)#56 |
| 3. | Macedonia | 50.0% | 4.1%(+45.9)#3 | 5.0%(+45.0)#180 |
| 4. | Valley City | 43.8% | 4.1%(+39.6)#4 | 5.0%(+38.8)#230 |
| 5. | Cornland | 42.5% | 4.1%(+38.4)#5 | 5.0%(+37.5)#248 |
| 6. | St Francisville | 41.8% | 4.1%(+37.7)#6 | 5.0%(+36.8)#254 |
| 7. | Garden Prairie | 39.7% | 4.1%(+35.6)#7 | 5.0%(+34.7)#286 |
| 8. | Trilla | 34.2% | 4.1%(+30.1)#8 | 5.0%(+29.2)#400 |
| 9. | Barstow | 33.3% | 4.1%(+29.2)#9 | 5.0%(+28.3)#424 |
| 10. | Oakdale | 33.1% | 4.1%(+29.0)#10 | 5.0%(+28.1)#436 |
| 11. | White Heath | 32.2% | 4.1%(+28.1)#11 | 5.0%(+27.2)#470 |
| 12. | Goofy Ridge | 32.0% | 4.1%(+27.9)#12 | 5.0%(+27.0)#476 |
| 13. | Panola | 30.0% | 4.1%(+25.9)#13 | 5.0%(+25.0)#554 |
| 14. | New Salem | 28.4% | 4.1%(+24.3)#14 | 5.0%(+23.4)#624 |
| 15. | Phillipstown | 27.3% | 4.1%(+23.2)#15 | 5.0%(+22.3)#693 |
| 16. | Russellville | 26.8% | 4.1%(+22.7)#16 | 5.0%(+21.8)#725 |
| 17. | Osco | 26.8% | 4.1%(+22.7)#17 | 5.0%(+21.8)#729 |
| 18. | La Fayette | 25.4% | 4.1%(+21.3)#18 | 5.0%(+20.4)#808 |
| 19. | Addieville | 25.3% | 4.1%(+21.2)#19 | 5.0%(+20.3)#813 |
| 20. | Adeline | 25.0% | 4.1%(+20.9)#20 | 5.0%(+20.0)#837 |
| 21. | La Rose | 24.5% | 4.1%(+20.4)#21 | 5.0%(+19.5)#876 |
| 22. | Wheeler | 24.5% | 4.1%(+20.4)#22 | 5.0%(+19.5)#881 |
| 23. | Maunie | 22.4% | 4.1%(+18.3)#23 | 5.0%(+17.5)#1,072 |
| 24. | Exeter | 22.2% | 4.1%(+18.1)#24 | 5.0%(+17.2)#1,103 |
| 25. | Bardolph | 22.0% | 4.1%(+17.8)#25 | 5.0%(+17.0)#1,140 |
| 26. | North Henderson | 21.2% | 4.1%(+17.0)#26 | 5.0%(+16.2)#1,220 |
| 27. | Coffeen | 20.4% | 4.1%(+16.3)#27 | 5.0%(+15.4)#1,321 |
| 28. | Parkersburg | 19.6% | 4.1%(+15.5)#28 | 5.0%(+14.6)#1,427 |
| 29. | Kempton | 19.5% | 4.1%(+15.4)#29 | 5.0%(+14.5)#1,450 |
| 30. | Kinderhook | 19.4% | 4.1%(+15.2)#30 | 5.0%(+14.4)#1,477 |
| 31. | De Witt | 19.3% | 4.1%(+15.2)#31 | 5.0%(+14.3)#1,492 |
| 32. | Valier | 19.2% | 4.1%(+15.1)#32 | 5.0%(+14.2)#1,509 |
| 33. | Rest Haven | 19.0% | 4.1%(+14.9)#33 | 5.0%(+14.0)#1,535 |
| 34. | Edgington | 18.9% | 4.1%(+14.8)#34 | 5.0%(+13.9)#1,553 |
| 35. | Longview | 18.5% | 4.1%(+14.4)#35 | 5.0%(+13.5)#1,623 |
| 36. | Montrose | 18.4% | 4.1%(+14.3)#36 | 5.0%(+13.4)#1,650 |
| 37. | Broadwell | 18.4% | 4.1%(+14.3)#37 | 5.0%(+13.4)#1,651 |
| 38. | Golconda | 18.1% | 4.1%(+14.0)#38 | 5.0%(+13.1)#1,723 |
| 39. | Iola | 17.9% | 4.1%(+13.7)#39 | 5.0%(+12.9)#1,771 |
| 40. | Symerton | 17.6% | 4.1%(+13.5)#40 | 5.0%(+12.7)#1,817 |
| 41. | Alvan | 17.2% | 4.1%(+13.1)#41 | 5.0%(+12.2)#1,896 |
| 42. | Old Ripley | 17.2% | 4.1%(+13.1)#42 | 5.0%(+12.2)#1,898 |
| 43. | Fillmore | 17.2% | 4.1%(+13.1)#43 | 5.0%(+12.2)#1,906 |
| 44. | Colp | 16.9% | 4.1%(+12.8)#44 | 5.0%(+11.9)#1,985 |
| 45. | Ridgway | 16.8% | 4.1%(+12.6)#45 | 5.0%(+11.8)#2,012 |
| 46. | Hanaford | 16.7% | 4.1%(+12.6)#46 | 5.0%(+11.7)#2,041 |
| 47. | Dewey | 16.7% | 4.1%(+12.6)#47 | 5.0%(+11.7)#2,051 |
| 48. | Wenonah | 16.7% | 4.1%(+12.6)#48 | 5.0%(+11.7)#2,067 |
| 49. | Bartelso | 16.5% | 4.1%(+12.4)#49 | 5.0%(+11.5)#2,098 |
| 50. | Bryant | 16.5% | 4.1%(+12.4)#50 | 5.0%(+11.5)#2,106 |
| 51. | Towanda | 15.9% | 4.1%(+11.8)#51 | 5.0%(+10.9)#2,256 |
| 52. | Dahlgren | 15.7% | 4.1%(+11.6)#52 | 5.0%(+10.7)#2,335 |
| 53. | Coalton | 15.7% | 4.1%(+11.6)#53 | 5.0%(+10.7)#2,337 |
| 54. | New Bedford | 15.4% | 4.1%(+11.3)#54 | 5.0%(+10.4)#2,423 |
| 55. | Gulfport | 15.2% | 4.1%(+11.1)#55 | 5.0%(+10.2)#2,478 |
| 56. | Smithfield | 14.9% | 4.1%(+10.8)#56 | 5.0%(+9.93)#2,577 |
| 57. | Lovington | 14.9% | 4.1%(+10.8)#57 | 5.0%(+9.87)#2,595 |
| 58. | Jeffersonville | 14.8% | 4.1%(+10.7)#58 | 5.0%(+9.85)#2,606 |
| 59. | East Cape Girardeau | 14.7% | 4.1%(+10.6)#59 | 5.0%(+9.68)#2,676 |
| 60. | Mazon | 14.7% | 4.1%(+10.6)#60 | 5.0%(+9.68)#2,678 |
| 61. | Mcnabb | 14.7% | 4.1%(+10.5)#61 | 5.0%(+9.66)#2,685 |
| 62. | Raleigh | 14.6% | 4.1%(+10.5)#62 | 5.0%(+9.59)#2,713 |
| 63. | Reynolds | 14.5% | 4.1%(+10.4)#63 | 5.0%(+9.55)#2,735 |
| 64. | Bridgeport | 14.5% | 4.1%(+10.4)#64 | 5.0%(+9.46)#2,755 |
| 65. | Strawn | 14.3% | 4.1%(+10.2)#65 | 5.0%(+9.29)#2,817 |
| 66. | Kinsman | 14.3% | 4.1%(+10.2)#66 | 5.0%(+9.29)#2,821 |
| 67. | Cooksville | 14.1% | 4.1%(+10.0)#67 | 5.0%(+9.12)#2,875 |
| 68. | Norris City | 14.1% | 4.1%(+9.97)#68 | 5.0%(+9.09)#2,890 |
| 69. | Toulon | 14.1% | 4.1%(+9.96)#69 | 5.0%(+9.07)#2,897 |
| 70. | Sparland | 14.0% | 4.1%(+9.91)#70 | 5.0%(+9.02)#2,916 |
| 71. | Emington | 13.9% | 4.1%(+9.78)#71 | 5.0%(+8.89)#2,978 |
| 72. | Blue Mound | 13.8% | 4.1%(+9.69)#72 | 5.0%(+8.80)#3,016 |
| 73. | Walnut Hill | 13.8% | 4.1%(+9.69)#73 | 5.0%(+8.80)#3,021 |
| 74. | Elvaston | 13.7% | 4.1%(+9.59)#74 | 5.0%(+8.70)#3,055 |
| 75. | Broadlands | 13.7% | 4.1%(+9.56)#75 | 5.0%(+8.68)#3,069 |
| 76. | Middletown | 13.6% | 4.1%(+9.53)#76 | 5.0%(+8.64)#3,084 |
| 77. | Monee | 13.6% | 4.1%(+9.46)#77 | 5.0%(+8.57)#3,111 |
| 78. | Olivet | 13.5% | 4.1%(+9.41)#78 | 5.0%(+8.52)#3,138 |
| 79. | Lakewood Shores | 13.5% | 4.1%(+9.38)#79 | 5.0%(+8.50)#3,146 |
| 80. | Jeisyville | 13.5% | 4.1%(+9.35)#80 | 5.0%(+8.47)#3,164 |
| 81. | Dorchester | 13.4% | 4.1%(+9.33)#81 | 5.0%(+8.44)#3,178 |
| 82. | Colfax | 13.4% | 4.1%(+9.31)#82 | 5.0%(+8.42)#3,188 |
| 83. | Lima | 13.4% | 4.1%(+9.31)#83 | 5.0%(+8.42)#3,190 |
| 84. | South Wilmington | 13.4% | 4.1%(+9.27)#84 | 5.0%(+8.39)#3,200 |
| 85. | Washburn | 13.4% | 4.1%(+9.25)#85 | 5.0%(+8.36)#3,207 |
| 86. | Herrick | 13.3% | 4.1%(+9.23)#86 | 5.0%(+8.34)#3,215 |
| 87. | Grantfork | 13.3% | 4.1%(+9.18)#87 | 5.0%(+8.30)#3,245 |
| 88. | Burtons Bridge | 13.3% | 4.1%(+9.15)#88 | 5.0%(+8.26)#3,256 |
| 89. | West York | 13.2% | 4.1%(+9.08)#89 | 5.0%(+8.19)#3,294 |
| 90. | Yale | 13.2% | 4.1%(+9.05)#90 | 5.0%(+8.16)#3,309 |
| 91. | Ava | 13.1% | 4.1%(+9.01)#91 | 5.0%(+8.12)#3,329 |
| 92. | Pingree Grove | 13.1% | 4.1%(+8.95)#92 | 5.0%(+8.07)#3,351 |
| 93. | Camden | 13.0% | 4.1%(+8.94)#93 | 5.0%(+8.05)#3,368 |
| 94. | Pocahontas | 13.0% | 4.1%(+8.86)#94 | 5.0%(+7.97)#3,409 |
| 95. | Fayetteville | 12.8% | 4.1%(+8.68)#95 | 5.0%(+7.80)#3,493 |
| 96. | West Union | 12.7% | 4.1%(+8.64)#96 | 5.0%(+7.75)#3,517 |
| 97. | Mansfield | 12.7% | 4.1%(+8.58)#97 | 5.0%(+7.70)#3,541 |
| 98. | Troy Grove | 12.6% | 4.1%(+8.48)#98 | 5.0%(+7.59)#3,588 |
| 99. | Donnellson | 12.5% | 4.1%(+8.39)#99 | 5.0%(+7.51)#3,634 |
| 100. | Crab Orchard | 12.4% | 4.1%(+8.31)#100 | 5.0%(+7.42)#3,692 |
Common Questions
What are the Top 10 Cities with the Highest Percentage of Population Employed in Construction & Extraction in Illinois?
Top 10 Cities with the Highest Percentage of Population Employed in Construction & Extraction in Illinois are:
#1
76.9%
#2
50.0%
#3
43.8%
#4
42.5%
#5
41.8%
#6
39.7%
#7
33.1%
#8
32.2%
#9
32.0%
#10
30.0%
What city has the Highest Percentage of Population Employed in Construction & Extraction in Illinois?
Detroit has the Highest Percentage of Population Employed in Construction & Extraction in Illinois with 76.9%.
What is the Percentage of Population Employed in Construction & Extraction in the State of Illinois?
Percentage of Population Employed in Construction & Extraction in Illinois is 4.1%.
What is the Percentage of Population Employed in Construction & Extraction in the United States?
Percentage of Population Employed in Construction & Extraction in the United States is 5.0%.