Cities with the Highest Percentage of Population Employed in Construction & Extraction in Vermont
RELATED REPORTS & OPTIONS
Construction & Extraction
Vermont
Compare Cities
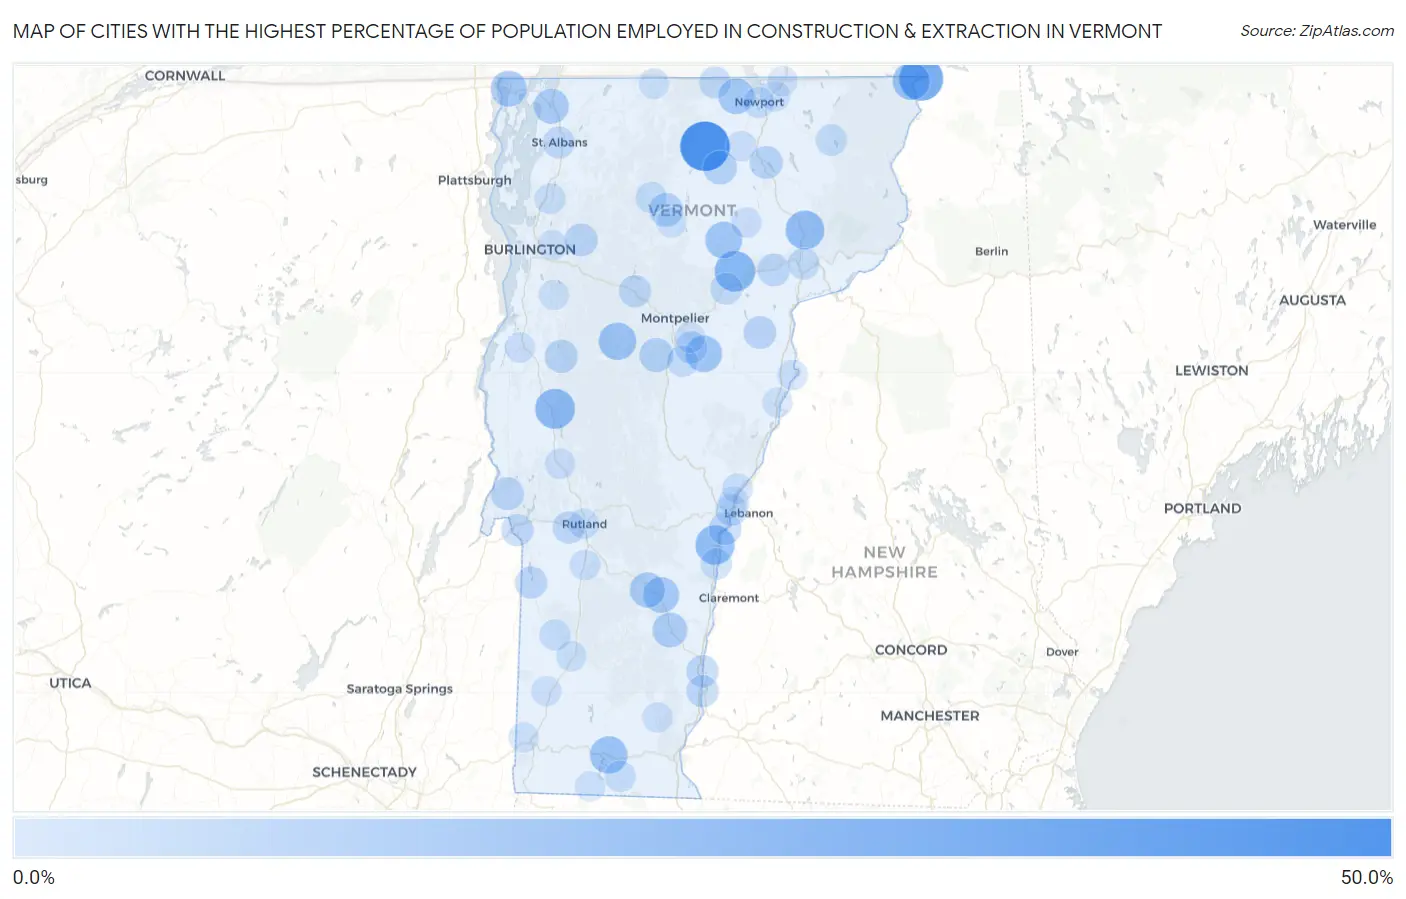
Map of Cities with the Highest Percentage of Population Employed in Construction & Extraction in Vermont
0.0%
50.0%
Cities with the Highest Percentage of Population Employed in Construction & Extraction in Vermont
| City | % Employed | vs State | vs National | |
| 1. | Lowell | 46.2% | 5.6%(+40.7)#1 | 5.0%(+41.2)#205 |
| 2. | Beecher Falls | 33.3% | 5.6%(+27.8)#2 | 5.0%(+28.3)#420 |
| 3. | East Charlotte | 28.5% | 5.6%(+22.9)#3 | 5.0%(+23.5)#622 |
| 4. | Cabot | 25.7% | 5.6%(+20.1)#4 | 5.0%(+20.7)#787 |
| 5. | Jamaica | 25.0% | 5.6%(+19.4)#5 | 5.0%(+20.0)#840 |
| 6. | East Middlebury | 24.1% | 5.6%(+18.6)#6 | 5.0%(+19.1)#907 |
| 7. | Whitingham | 23.9% | 5.6%(+18.3)#7 | 5.0%(+18.9)#926 |
| 8. | Hartland | 22.7% | 5.6%(+17.2)#8 | 5.0%(+17.7)#1,040 |
| 9. | Pownal Center | 22.4% | 5.6%(+16.8)#9 | 5.0%(+17.4)#1,079 |
| 10. | Grafton | 22.2% | 5.6%(+16.7)#10 | 5.0%(+17.2)#1,104 |
| 11. | Lyndonville | 21.7% | 5.6%(+16.1)#11 | 5.0%(+16.7)#1,168 |
| 12. | Londonderry | 19.4% | 5.6%(+13.8)#12 | 5.0%(+14.4)#1,480 |
| 13. | Waitsfield | 19.0% | 5.6%(+13.4)#13 | 5.0%(+14.0)#1,543 |
| 14. | Wilmington | 18.8% | 5.6%(+13.3)#14 | 5.0%(+13.8)#1,562 |
| 15. | Canaan | 18.8% | 5.6%(+13.2)#15 | 5.0%(+13.8)#1,583 |
| 16. | Lincoln | 17.9% | 5.6%(+12.3)#16 | 5.0%(+12.9)#1,759 |
| 17. | Hardwick | 17.4% | 5.6%(+11.8)#17 | 5.0%(+12.4)#1,880 |
| 18. | East Barre | 16.9% | 5.6%(+11.3)#18 | 5.0%(+11.9)#1,979 |
| 19. | Alburgh | 15.6% | 5.6%(+10.0)#19 | 5.0%(+10.6)#2,355 |
| 20. | Newport Center | 15.2% | 5.6%(+9.65)#20 | 5.0%(+10.2)#2,476 |
| 21. | Proctorsville | 15.0% | 5.6%(+9.48)#21 | 5.0%(+10.1)#2,528 |
| 22. | Chittenden | 14.4% | 5.6%(+8.86)#22 | 5.0%(+9.44)#2,764 |
| 23. | Ludlow | 14.1% | 5.6%(+8.53)#23 | 5.0%(+9.11)#2,887 |
| 24. | Swanton | 13.5% | 5.6%(+7.98)#24 | 5.0%(+8.56)#3,124 |
| 25. | Chester | 13.1% | 5.6%(+7.55)#25 | 5.0%(+8.12)#3,326 |
| 26. | Waterbury Center | 12.7% | 5.6%(+7.17)#26 | 5.0%(+7.74)#3,521 |
| 27. | Hanksville | 12.5% | 5.6%(+6.93)#27 | 5.0%(+7.51)#3,653 |
| 28. | Hyde Park | 11.3% | 5.6%(+5.70)#28 | 5.0%(+6.27)#4,440 |
| 29. | Albany | 11.2% | 5.6%(+5.65)#29 | 5.0%(+6.23)#4,470 |
| 30. | Northfield | 11.2% | 5.6%(+5.60)#30 | 5.0%(+6.18)#4,516 |
| 31. | Harmonyville | 10.2% | 5.6%(+4.62)#31 | 5.0%(+5.20)#5,360 |
| 32. | West Charlotte | 10.1% | 5.6%(+4.51)#32 | 5.0%(+5.08)#5,466 |
| 33. | North Clarendon | 10.0% | 5.6%(+4.43)#33 | 5.0%(+5.01)#5,537 |
| 34. | Underhill Center | 10.0% | 5.6%(+4.43)#34 | 5.0%(+5.01)#5,571 |
| 35. | New Haven | 9.9% | 5.6%(+4.35)#35 | 5.0%(+4.93)#5,641 |
| 36. | East Poultney | 9.8% | 5.6%(+4.21)#36 | 5.0%(+4.79)#5,773 |
| 37. | Huntington | 9.8% | 5.6%(+4.19)#37 | 5.0%(+4.76)#5,800 |
| 38. | Bristol | 9.6% | 5.6%(+3.99)#38 | 5.0%(+4.56)#5,999 |
| 39. | East Dorset | 9.5% | 5.6%(+3.90)#39 | 5.0%(+4.47)#6,109 |
| 40. | Barton | 9.2% | 5.6%(+3.63)#40 | 5.0%(+4.21)#6,398 |
| 41. | Benson | 9.1% | 5.6%(+3.52)#41 | 5.0%(+4.10)#6,529 |
| 42. | Stamford | 8.9% | 5.6%(+3.33)#42 | 5.0%(+3.90)#6,745 |
| 43. | Jericho | 8.9% | 5.6%(+3.32)#43 | 5.0%(+3.89)#6,759 |
| 44. | Groton | 8.8% | 5.6%(+3.19)#44 | 5.0%(+3.77)#6,933 |
| 45. | North Hartland | 8.4% | 5.6%(+2.81)#45 | 5.0%(+3.38)#7,481 |
| 46. | Danville | 8.2% | 5.6%(+2.63)#46 | 5.0%(+3.21)#7,746 |
| 47. | St. George | 8.1% | 5.6%(+2.56)#47 | 5.0%(+3.14)#7,855 |
| 48. | Proctor | 7.7% | 5.6%(+2.14)#48 | 5.0%(+2.72)#8,516 |
| 49. | Bellows Falls | 7.7% | 5.6%(+2.13)#49 | 5.0%(+2.71)#8,525 |
| 50. | Westford | 7.5% | 5.6%(+1.96)#50 | 5.0%(+2.53)#8,837 |
| 51. | Fair Haven | 7.5% | 5.6%(+1.91)#51 | 5.0%(+2.49)#8,910 |
| 52. | Westminster | 7.4% | 5.6%(+1.86)#52 | 5.0%(+2.44)#8,997 |
| 53. | Waterbury | 7.4% | 5.6%(+1.86)#53 | 5.0%(+2.44)#9,000 |
| 54. | West Rutland | 7.4% | 5.6%(+1.78)#54 | 5.0%(+2.36)#9,151 |
| 55. | North Hyde Park | 7.3% | 5.6%(+1.72)#55 | 5.0%(+2.29)#9,262 |
| 56. | South Barre | 7.2% | 5.6%(+1.62)#56 | 5.0%(+2.20)#9,401 |
| 57. | Wells | 7.1% | 5.6%(+1.57)#57 | 5.0%(+2.15)#9,478 |
| 58. | Gilman | 7.0% | 5.6%(+1.41)#58 | 5.0%(+1.98)#9,813 |
| 59. | St Albans | 6.9% | 5.6%(+1.36)#59 | 5.0%(+1.94)#9,891 |
| 60. | North Troy | 6.7% | 5.6%(+1.15)#60 | 5.0%(+1.72)#10,289 |
| 61. | White River Junction | 6.7% | 5.6%(+1.14)#61 | 5.0%(+1.72)#10,309 |
| 62. | Middletown Springs | 6.6% | 5.6%(+1.01)#62 | 5.0%(+1.58)#10,576 |
| 63. | Marshfield | 6.5% | 5.6%(+0.916)#63 | 5.0%(+1.49)#10,783 |
| 64. | Wardsboro | 6.4% | 5.6%(+0.813)#64 | 5.0%(+1.39)#11,008 |
| 65. | St Johnsbury | 6.2% | 5.6%(+0.635)#65 | 5.0%(+1.21)#11,402 |
| 66. | Island Pond | 6.0% | 5.6%(+0.443)#66 | 5.0%(+1.02)#11,841 |
| 67. | Underhill Flats | 6.0% | 5.6%(+0.385)#67 | 5.0%(+0.961)#11,971 |
| 68. | Johnson | 5.8% | 5.6%(+0.254)#68 | 5.0%(+0.830)#12,284 |
| 69. | Williamstown | 5.5% | 5.6%(-0.070)#69 | 5.0%(+0.507)#13,060 |
| 70. | Windsor | 5.4% | 5.6%(-0.190)#70 | 5.0%(+0.386)#13,360 |
| 71. | Jacksonville | 5.4% | 5.6%(-0.194)#71 | 5.0%(+0.382)#13,378 |
| 72. | Newport | 5.2% | 5.6%(-0.410)#72 | 5.0%(+0.166)#13,894 |
| 73. | Dorset | 5.0% | 5.6%(-0.534)#73 | 5.0%(+0.042)#14,244 |
| 74. | Peacham | 4.8% | 5.6%(-0.808)#74 | 5.0%(-0.232)#14,956 |
| 75. | Milton | 4.7% | 5.6%(-0.918)#75 | 5.0%(-0.342)#15,247 |
| 76. | Rutland | 4.3% | 5.6%(-1.24)#76 | 5.0%(-0.667)#16,179 |
| 77. | Sutton | 4.3% | 5.6%(-1.27)#77 | 5.0%(-0.693)#16,244 |
| 78. | Barre | 4.0% | 5.6%(-1.54)#78 | 5.0%(-0.961)#17,094 |
| 79. | Wallingford | 3.9% | 5.6%(-1.67)#79 | 5.0%(-1.10)#17,494 |
| 80. | Brandon | 3.8% | 5.6%(-1.74)#80 | 5.0%(-1.17)#17,705 |
| 81. | Newbury | 3.8% | 5.6%(-1.79)#81 | 5.0%(-1.21)#17,831 |
| 82. | Irasburg | 3.7% | 5.6%(-1.82)#82 | 5.0%(-1.24)#17,942 |
| 83. | Derby Center | 3.7% | 5.6%(-1.84)#83 | 5.0%(-1.26)#17,991 |
| 84. | Killington | 3.7% | 5.6%(-1.88)#84 | 5.0%(-1.31)#18,128 |
| 85. | Norwich | 3.7% | 5.6%(-1.90)#85 | 5.0%(-1.32)#18,172 |
| 86. | Greensboro Bend | 3.6% | 5.6%(-1.97)#86 | 5.0%(-1.40)#18,379 |
| 87. | Manchester Center | 3.6% | 5.6%(-1.98)#87 | 5.0%(-1.41)#18,407 |
| 88. | Vergennes | 3.5% | 5.6%(-2.05)#88 | 5.0%(-1.47)#18,600 |
| 89. | Newfane | 3.5% | 5.6%(-2.06)#89 | 5.0%(-1.49)#18,655 |
| 90. | Richford | 3.5% | 5.6%(-2.08)#90 | 5.0%(-1.50)#18,692 |
| 91. | Wilder | 3.4% | 5.6%(-2.13)#91 | 5.0%(-1.56)#18,868 |
| 92. | Hinesburg | 3.4% | 5.6%(-2.14)#92 | 5.0%(-1.56)#18,873 |
| 93. | Essex Junction | 3.4% | 5.6%(-2.20)#93 | 5.0%(-1.63)#19,064 |
| 94. | Bradford | 3.4% | 5.6%(-2.21)#94 | 5.0%(-1.64)#19,097 |
| 95. | Morrisville | 3.3% | 5.6%(-2.31)#95 | 5.0%(-1.73)#19,394 |
| 96. | Readsboro | 3.2% | 5.6%(-2.40)#96 | 5.0%(-1.82)#19,644 |
| 97. | Arlington | 3.1% | 5.6%(-2.44)#97 | 5.0%(-1.86)#19,770 |
| 98. | Sheffield | 3.1% | 5.6%(-2.45)#98 | 5.0%(-1.87)#19,795 |
| 99. | Derby Line | 3.1% | 5.6%(-2.48)#99 | 5.0%(-1.90)#19,879 |
| 100. | North Bennington | 3.1% | 5.6%(-2.48)#100 | 5.0%(-1.91)#19,898 |
1
2Common Questions
What are the Top 10 Cities with the Highest Percentage of Population Employed in Construction & Extraction in Vermont?
Top 10 Cities with the Highest Percentage of Population Employed in Construction & Extraction in Vermont are:
#1
46.2%
#2
33.3%
#3
25.7%
#4
24.1%
#5
22.7%
#6
21.7%
#7
19.0%
#8
18.8%
#9
18.8%
#10
17.4%
What city has the Highest Percentage of Population Employed in Construction & Extraction in Vermont?
Lowell has the Highest Percentage of Population Employed in Construction & Extraction in Vermont with 46.2%.
What is the Percentage of Population Employed in Construction & Extraction in the State of Vermont?
Percentage of Population Employed in Construction & Extraction in Vermont is 5.6%.
What is the Percentage of Population Employed in Construction & Extraction in the United States?
Percentage of Population Employed in Construction & Extraction in the United States is 5.0%.