Newell, CA Map & Demographics
Newell Map
Newell Overview
$17,377
PER CAPITA INCOME
$34,659
AVG FAMILY INCOME
$32,955
AVG HOUSEHOLD INCOME
56.2%
WAGE / INCOME GAP [ % ]
43.8¢/ $1
WAGE / INCOME GAP [ $ ]
0.38
INEQUALITY / GINI INDEX
431
TOTAL POPULATION
227
MALE POPULATION
204
FEMALE POPULATION
111.27
MALES / 100 FEMALES
89.87
FEMALES / 100 MALES
26.7
MEDIAN AGE
4.0
AVG FAMILY SIZE
3.3
AVG HOUSEHOLD SIZE
193
LABOR FORCE [ PEOPLE ]
67.7%
PERCENT IN LABOR FORCE
Newell Area Codes
Income in Newell
Income Overview in Newell
Per Capita Income in Newell is $17,377, while median incomes of families and households are $34,659 and $32,955 respectively.
| Characteristic | Number | Measure |
| Per Capita Income | 431 | $17,377 |
| Median Family Income | 77 | $34,659 |
| Mean Family Income | 77 | $43,149 |
| Median Household Income | 116 | $32,955 |
| Mean Household Income | 116 | $39,943 |
| Income Deficit | 77 | $0 |
| Wage / Income Gap (%) | 431 | 56.18% |
| Wage / Income Gap ($) | 431 | 43.82¢ per $1 |
| Gini / Inequality Index | 431 | 0.38 |
Earnings by Sex in Newell
Average Earnings in Newell are $20,985, $28,529 for men and $12,500 for women, a difference of 56.2%.
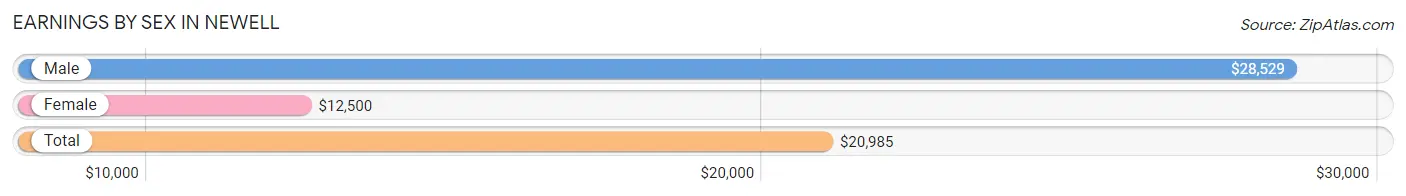
| Sex | Number | Average Earnings |
| Male | 120 (60.6%) | $28,529 |
| Female | 78 (39.4%) | $12,500 |
| Total | 198 (100.0%) | $20,985 |
Earnings by Sex by Income Bracket in Newell
The most common earnings brackets in Newell are $40,000 to $44,999 for men (48 | 40.0%) and $12,500 to $14,999 for women (27 | 34.6%).
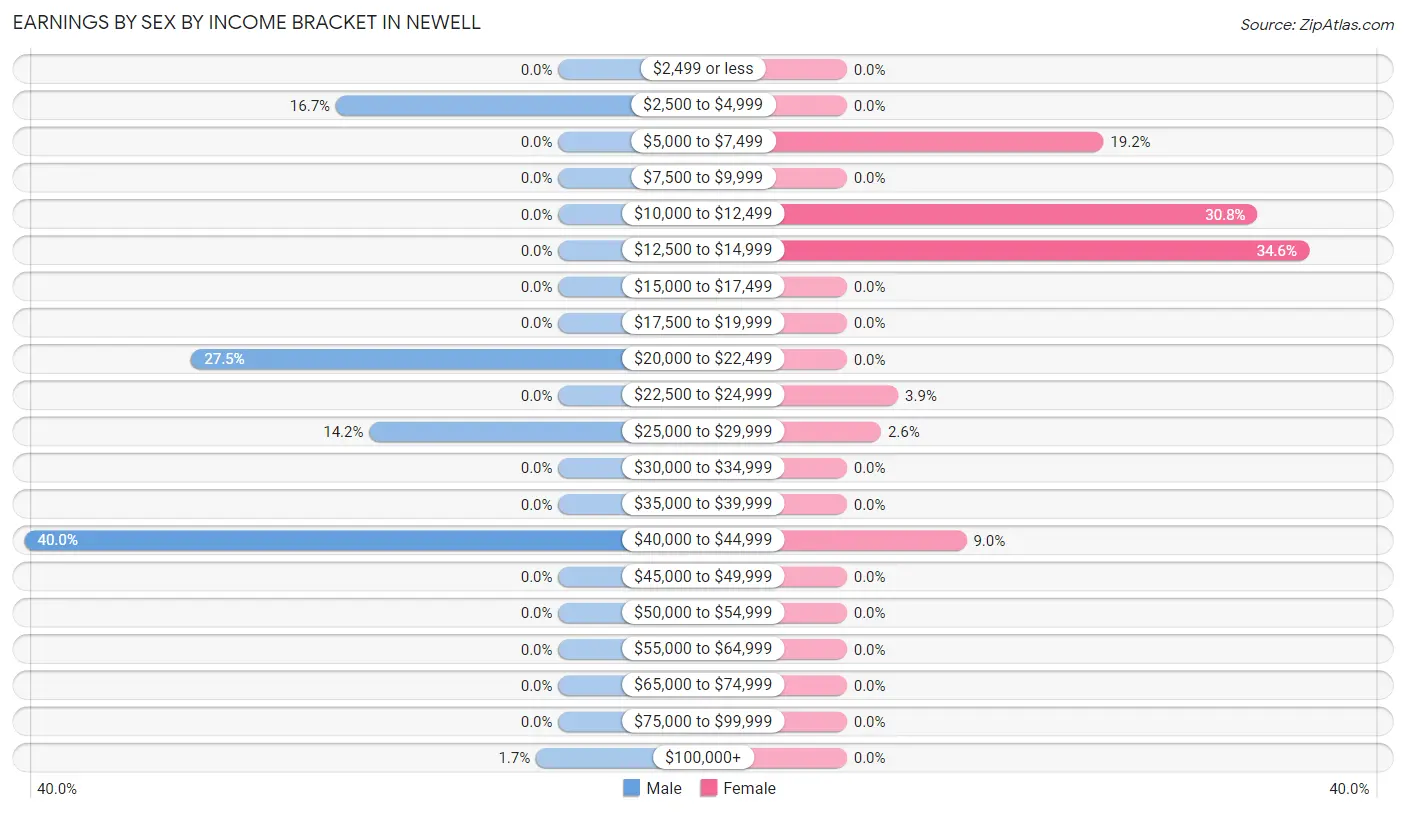
| Income | Male | Female |
| $2,499 or less | 0 (0.0%) | 0 (0.0%) |
| $2,500 to $4,999 | 20 (16.7%) | 0 (0.0%) |
| $5,000 to $7,499 | 0 (0.0%) | 15 (19.2%) |
| $7,500 to $9,999 | 0 (0.0%) | 0 (0.0%) |
| $10,000 to $12,499 | 0 (0.0%) | 24 (30.8%) |
| $12,500 to $14,999 | 0 (0.0%) | 27 (34.6%) |
| $15,000 to $17,499 | 0 (0.0%) | 0 (0.0%) |
| $17,500 to $19,999 | 0 (0.0%) | 0 (0.0%) |
| $20,000 to $22,499 | 33 (27.5%) | 0 (0.0%) |
| $22,500 to $24,999 | 0 (0.0%) | 3 (3.8%) |
| $25,000 to $29,999 | 17 (14.2%) | 2 (2.6%) |
| $30,000 to $34,999 | 0 (0.0%) | 0 (0.0%) |
| $35,000 to $39,999 | 0 (0.0%) | 0 (0.0%) |
| $40,000 to $44,999 | 48 (40.0%) | 7 (9.0%) |
| $45,000 to $49,999 | 0 (0.0%) | 0 (0.0%) |
| $50,000 to $54,999 | 0 (0.0%) | 0 (0.0%) |
| $55,000 to $64,999 | 0 (0.0%) | 0 (0.0%) |
| $65,000 to $74,999 | 0 (0.0%) | 0 (0.0%) |
| $75,000 to $99,999 | 0 (0.0%) | 0 (0.0%) |
| $100,000+ | 2 (1.7%) | 0 (0.0%) |
| Total | 120 (100.0%) | 78 (100.0%) |
Earnings by Sex by Educational Attainment in Newell
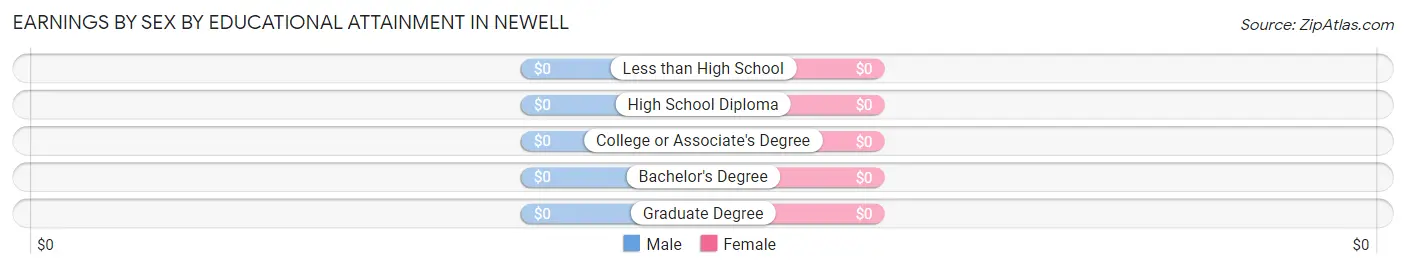
| Educational Attainment | Male Income | Female Income |
| Less than High School | - | - |
| High School Diploma | - | - |
| College or Associate's Degree | - | - |
| Bachelor's Degree | - | - |
| Graduate Degree | - | - |
| Total | $42,786 | $12,731 |
Family Income in Newell
Family Income Brackets in Newell
According to the Newell family income data, there are 27 families falling into the $15,000 to $24,999 income range, which is the most common income bracket and makes up 35.1% of all families.
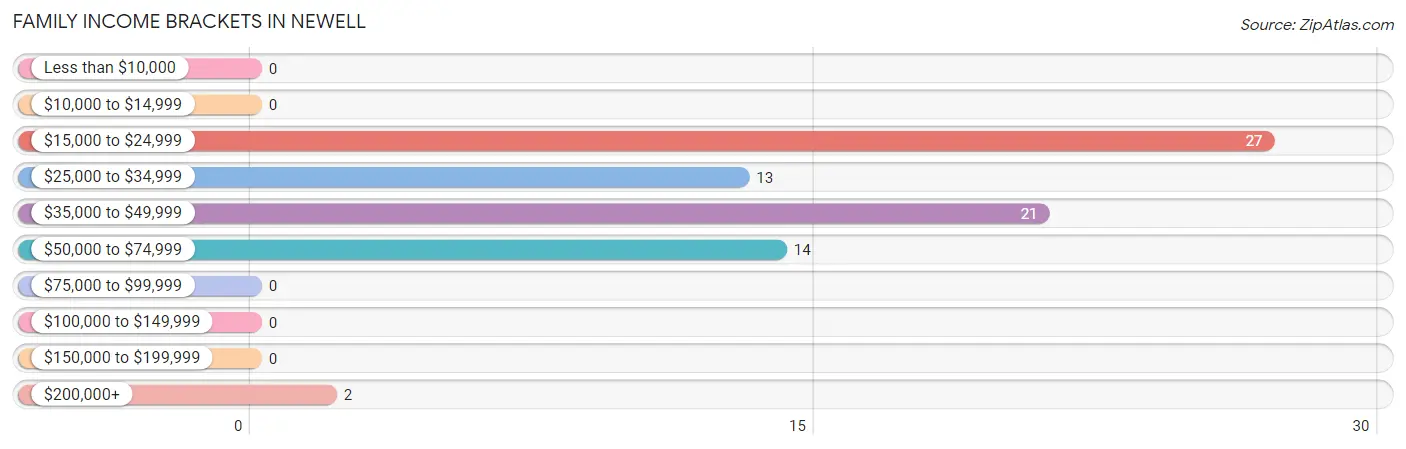
| Income Bracket | # Families | % Families |
| Less than $10,000 | 0 | 0.0% |
| $10,000 to $14,999 | 0 | 0.0% |
| $15,000 to $24,999 | 27 | 35.1% |
| $25,000 to $34,999 | 13 | 16.9% |
| $35,000 to $49,999 | 21 | 27.3% |
| $50,000 to $74,999 | 14 | 18.2% |
| $75,000 to $99,999 | 0 | 0.0% |
| $100,000 to $149,999 | 0 | 0.0% |
| $150,000 to $199,999 | 0 | 0.0% |
| $200,000+ | 2 | 2.6% |
Family Income by Famaliy Size in Newell
2-person families (25 | 32.5%) account for the highest median family income in Newell with $41,250 per family, while 2-person families (25 | 32.5%) have the highest median income of $20,625 per family member.
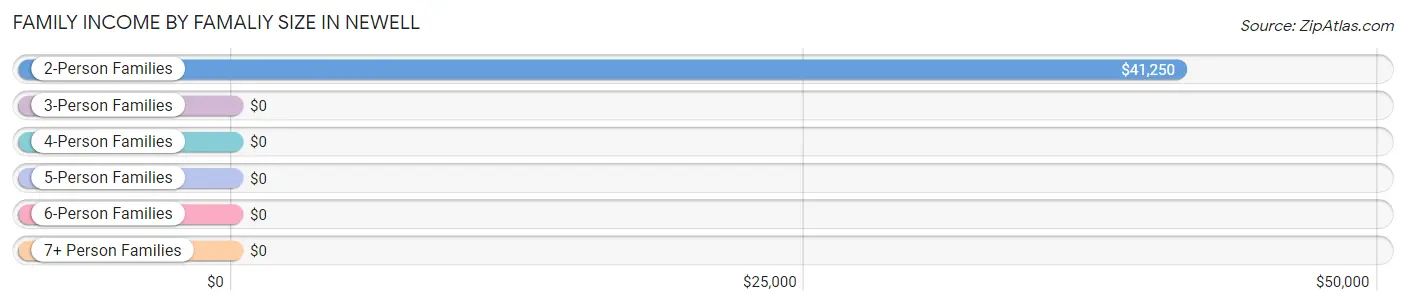
| Income Bracket | # Families | Median Income |
| 2-Person Families | 25 (32.5%) | $41,250 |
| 3-Person Families | 0 (0.0%) | $0 |
| 4-Person Families | 38 (49.3%) | $0 |
| 5-Person Families | 0 (0.0%) | $0 |
| 6-Person Families | 14 (18.2%) | $0 |
| 7+ Person Families | 0 (0.0%) | $0 |
| Total | 77 (100.0%) | $34,659 |
Family Income by Number of Earners in Newell
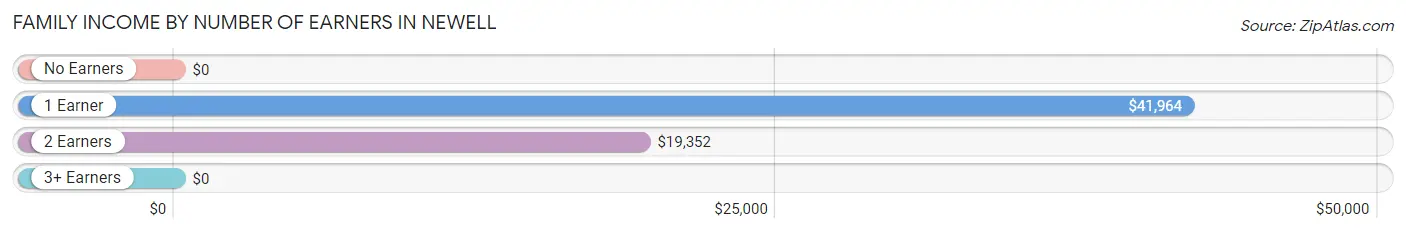
| Number of Earners | # Families | Median Income |
| No Earners | 0 (0.0%) | $0 |
| 1 Earner | 37 (48.0%) | $41,964 |
| 2 Earners | 40 (51.9%) | $19,352 |
| 3+ Earners | 0 (0.0%) | $0 |
| Total | 77 (100.0%) | $34,659 |
Household Income in Newell
Household Income Brackets in Newell
With 56 households falling in the category, the $15,000 to $24,999 income range is the most frequent in Newell, accounting for 48.3% of all households.
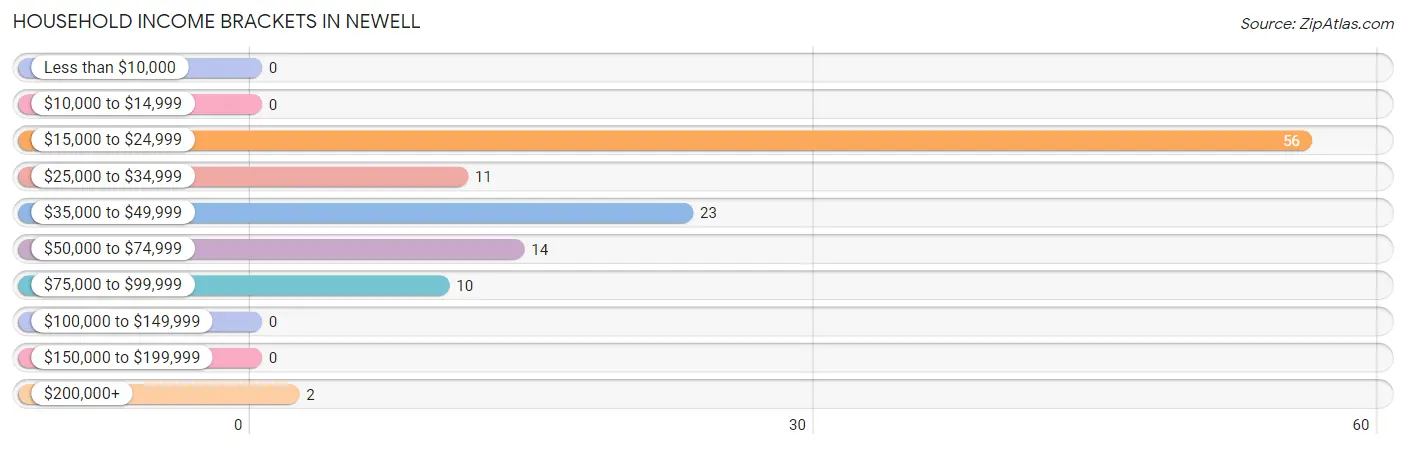
| Income Bracket | # Households | % Households |
| Less than $10,000 | 0 | 0.0% |
| $10,000 to $14,999 | 0 | 0.0% |
| $15,000 to $24,999 | 56 | 48.3% |
| $25,000 to $34,999 | 11 | 9.5% |
| $35,000 to $49,999 | 23 | 19.8% |
| $50,000 to $74,999 | 14 | 12.1% |
| $75,000 to $99,999 | 10 | 8.6% |
| $100,000 to $149,999 | 0 | 0.0% |
| $150,000 to $199,999 | 0 | 0.0% |
| $200,000+ | 2 | 1.7% |
Household Income by Householder Age in Newell
| Income Bracket | # Households | Median Income |
| 15 to 24 Years | 11 (9.5%) | $0 |
| 25 to 44 Years | 72 (62.1%) | $0 |
| 45 to 64 Years | 33 (28.4%) | $0 |
| 65+ Years | 0 (0.0%) | $0 |
| Total | 116 (100.0%) | $32,955 |
Poverty in Newell
Income Below Poverty by Sex and Age in Newell
With 17.6% poverty level for males and 40.7% for females among the residents of Newell, 12 to 14 year old males and 35 to 44 year old females are the most vulnerable to poverty, with 19 males (100.0%) and 54 females (100.0%) in their respective age groups living below the poverty level.
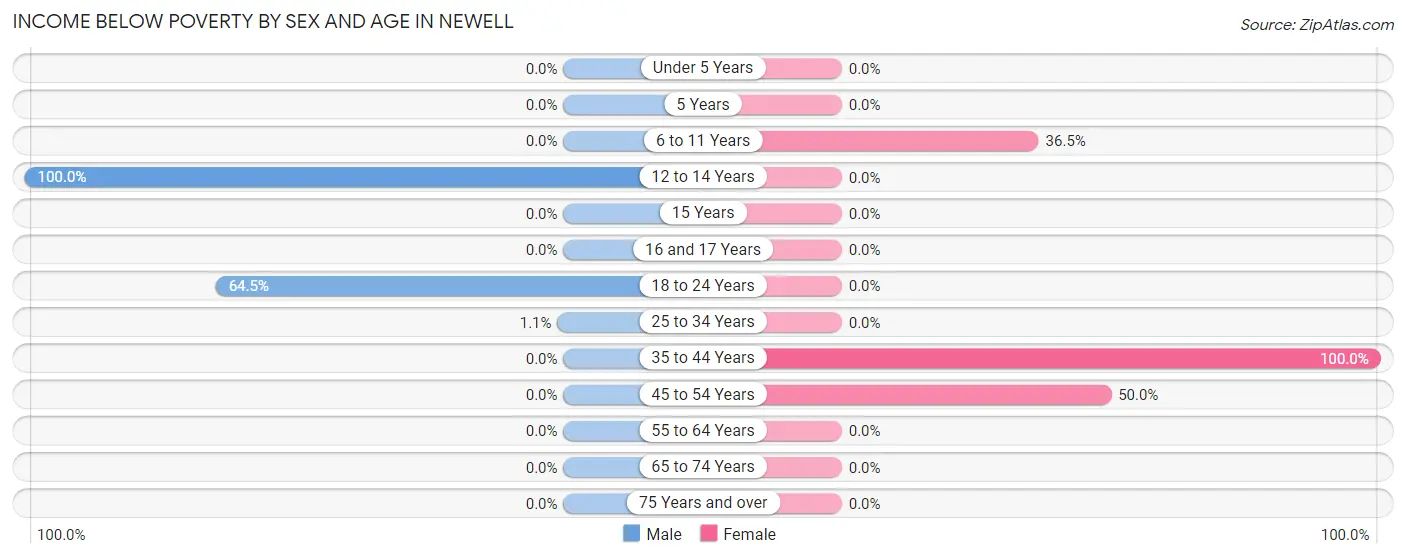
| Age Bracket | Male | Female |
| Under 5 Years | 0 (0.0%) | 0 (0.0%) |
| 5 Years | 0 (0.0%) | 0 (0.0%) |
| 6 to 11 Years | 0 (0.0%) | 19 (36.5%) |
| 12 to 14 Years | 19 (100.0%) | 0 (0.0%) |
| 15 Years | 0 (0.0%) | 0 (0.0%) |
| 16 and 17 Years | 0 (0.0%) | 0 (0.0%) |
| 18 to 24 Years | 20 (64.5%) | 0 (0.0%) |
| 25 to 34 Years | 1 (1.1%) | 0 (0.0%) |
| 35 to 44 Years | 0 (0.0%) | 54 (100.0%) |
| 45 to 54 Years | 0 (0.0%) | 10 (50.0%) |
| 55 to 64 Years | 0 (0.0%) | 0 (0.0%) |
| 65 to 74 Years | 0 (0.0%) | 0 (0.0%) |
| 75 Years and over | 0 (0.0%) | 0 (0.0%) |
| Total | 40 (17.6%) | 83 (40.7%) |
Income Above Poverty by Sex and Age in Newell
According to the poverty statistics in Newell, males aged under 5 years and females aged under 5 years are the age groups that are most secure financially, with 100.0% of males and 100.0% of females in these age groups living above the poverty line.
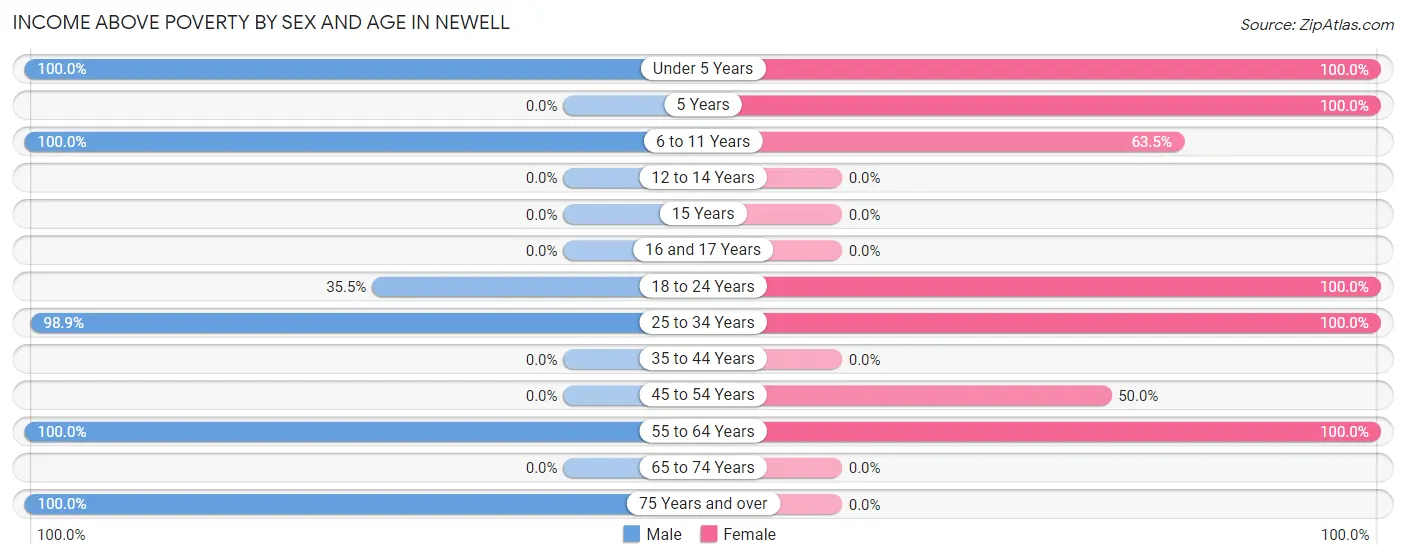
| Age Bracket | Male | Female |
| Under 5 Years | 37 (100.0%) | 2 (100.0%) |
| 5 Years | 0 (0.0%) | 10 (100.0%) |
| 6 to 11 Years | 26 (100.0%) | 33 (63.5%) |
| 12 to 14 Years | 0 (0.0%) | 0 (0.0%) |
| 15 Years | 0 (0.0%) | 0 (0.0%) |
| 16 and 17 Years | 0 (0.0%) | 0 (0.0%) |
| 18 to 24 Years | 11 (35.5%) | 5 (100.0%) |
| 25 to 34 Years | 89 (98.9%) | 40 (100.0%) |
| 35 to 44 Years | 0 (0.0%) | 0 (0.0%) |
| 45 to 54 Years | 0 (0.0%) | 10 (50.0%) |
| 55 to 64 Years | 2 (100.0%) | 21 (100.0%) |
| 65 to 74 Years | 0 (0.0%) | 0 (0.0%) |
| 75 Years and over | 22 (100.0%) | 0 (0.0%) |
| Total | 187 (82.4%) | 121 (59.3%) |
Income Below Poverty Among Married-Couple Families in Newell
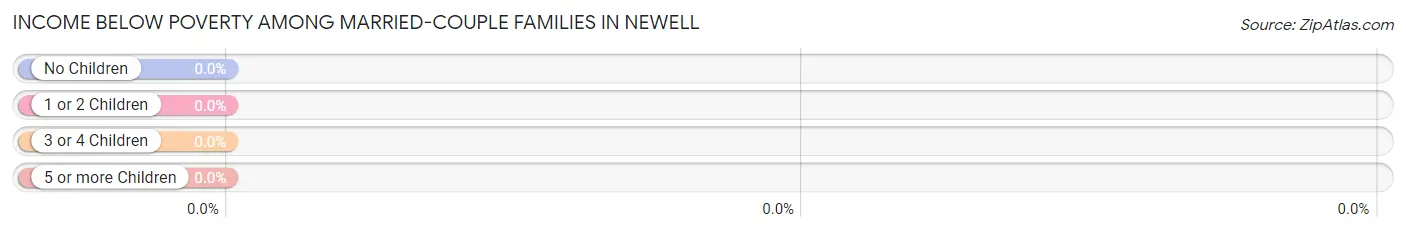
| Children | Above Poverty | Below Poverty |
| No Children | 2 (100.0%) | 0 (0.0%) |
| 1 or 2 Children | 11 (100.0%) | 0 (0.0%) |
| 3 or 4 Children | 14 (100.0%) | 0 (0.0%) |
| 5 or more Children | 0 (0.0%) | 0 (0.0%) |
| Total | 27 (100.0%) | 0 (0.0%) |
Income Below Poverty Among Single-Parent Households in Newell
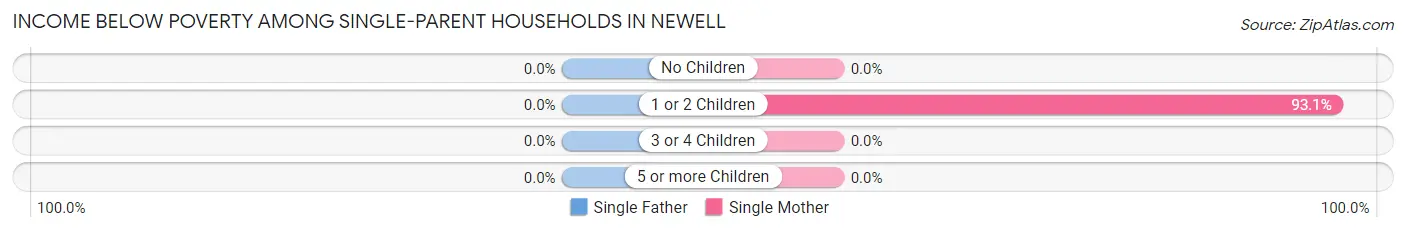
| Children | Single Father | Single Mother |
| No Children | 0 (0.0%) | 0 (0.0%) |
| 1 or 2 Children | 0 (0.0%) | 27 (93.1%) |
| 3 or 4 Children | 0 (0.0%) | 0 (0.0%) |
| 5 or more Children | 0 (0.0%) | 0 (0.0%) |
| Total | 0 (0.0%) | 27 (54.0%) |
Income Below Poverty Among Married-Couple vs Single-Parent Households in Newell
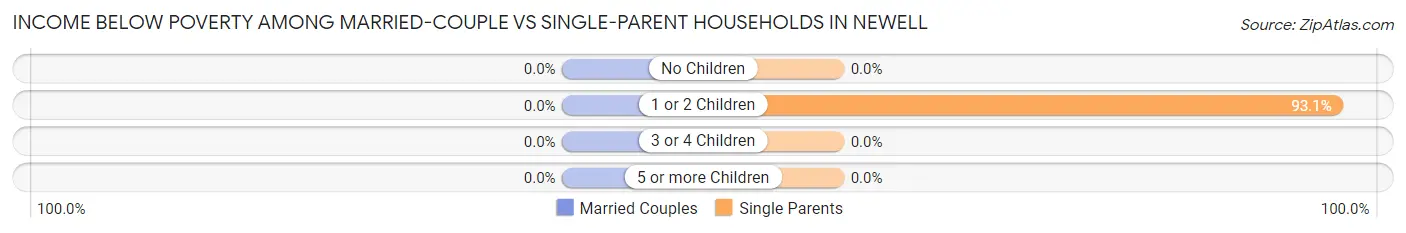
| Children | Married-Couple Families | Single-Parent Households |
| No Children | 0 (0.0%) | 0 (0.0%) |
| 1 or 2 Children | 0 (0.0%) | 27 (93.1%) |
| 3 or 4 Children | 0 (0.0%) | 0 (0.0%) |
| 5 or more Children | 0 (0.0%) | 0 (0.0%) |
| Total | 0 (0.0%) | 27 (54.0%) |
Race in Newell
The most populous races in Newell are White / Caucasian (396 | 91.9%), Hispanic or Latino (195 | 45.2%), and Some other Race (33 | 7.7%).
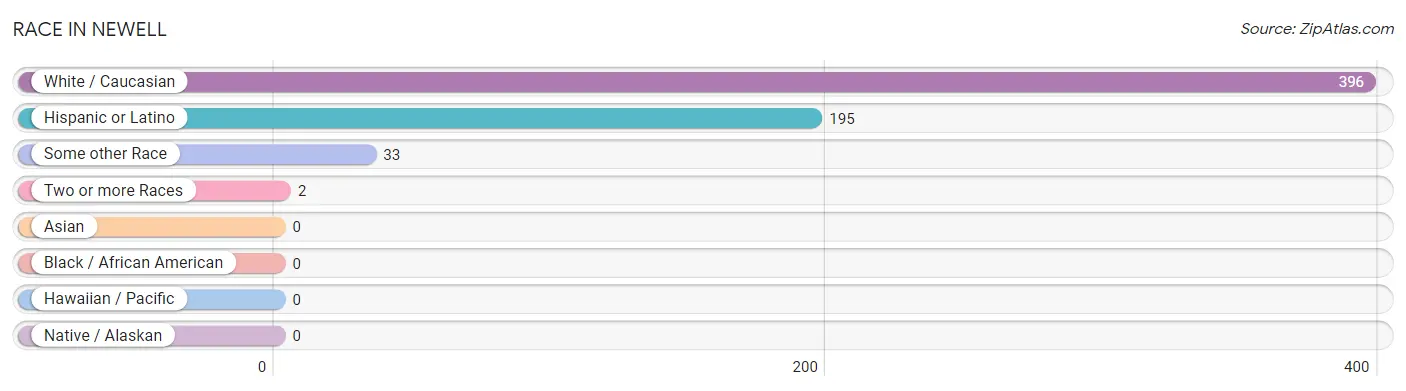
| Race | # Population | % Population |
| Asian | 0 | 0.0% |
| Black / African American | 0 | 0.0% |
| Hawaiian / Pacific | 0 | 0.0% |
| Hispanic or Latino | 195 | 45.2% |
| Native / Alaskan | 0 | 0.0% |
| White / Caucasian | 396 | 91.9% |
| Two or more Races | 2 | 0.5% |
| Some other Race | 33 | 7.7% |
| Total | 431 | 100.0% |
Ancestry in Newell
The most populous ancestries reported in Newell are Mexican (195 | 45.2%), German (70 | 16.2%), Norwegian (48 | 11.1%), Scottish (38 | 8.8%), and Scotch-Irish (17 | 3.9%), together accounting for 85.4% of all Newell residents.
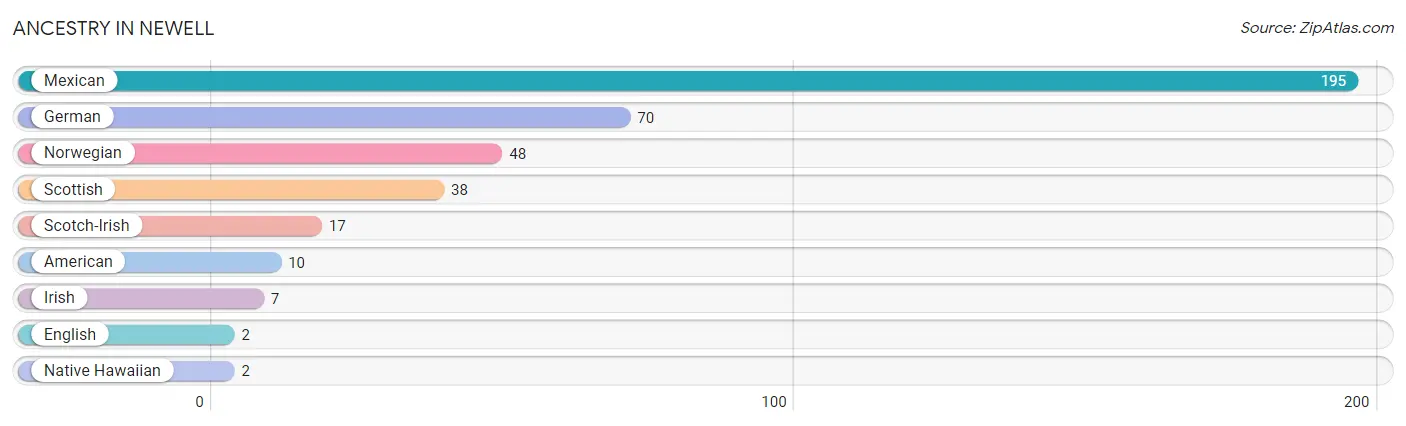
| Ancestry | # Population | % Population |
| American | 10 | 2.3% |
| English | 2 | 0.5% |
| German | 70 | 16.2% |
| Irish | 7 | 1.6% |
| Mexican | 195 | 45.2% |
| Native Hawaiian | 2 | 0.5% |
| Norwegian | 48 | 11.1% |
| Scotch-Irish | 17 | 3.9% |
| Scottish | 38 | 8.8% | View All 9 Rows |
Immigrants in Newell
The most numerous immigrant groups reported in Newell came from Central America (60 | 13.9%), Latin America (60 | 13.9%), and Mexico (60 | 13.9%), together accounting for 41.8% of all Newell residents.
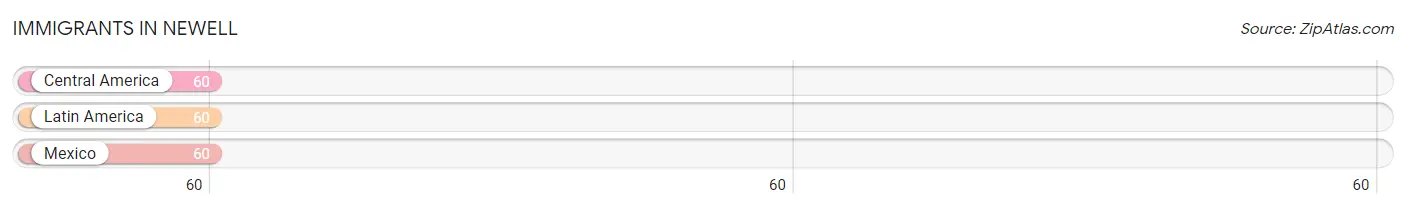
| Immigration Origin | # Population | % Population |
| Central America | 60 | 13.9% |
| Latin America | 60 | 13.9% |
| Mexico | 60 | 13.9% | View All 3 Rows |
Sex and Age in Newell
Sex and Age in Newell
The most populous age groups in Newell are 25 to 29 Years (87 | 38.3%) for men and 5 to 9 Years (62 | 30.4%) for women.
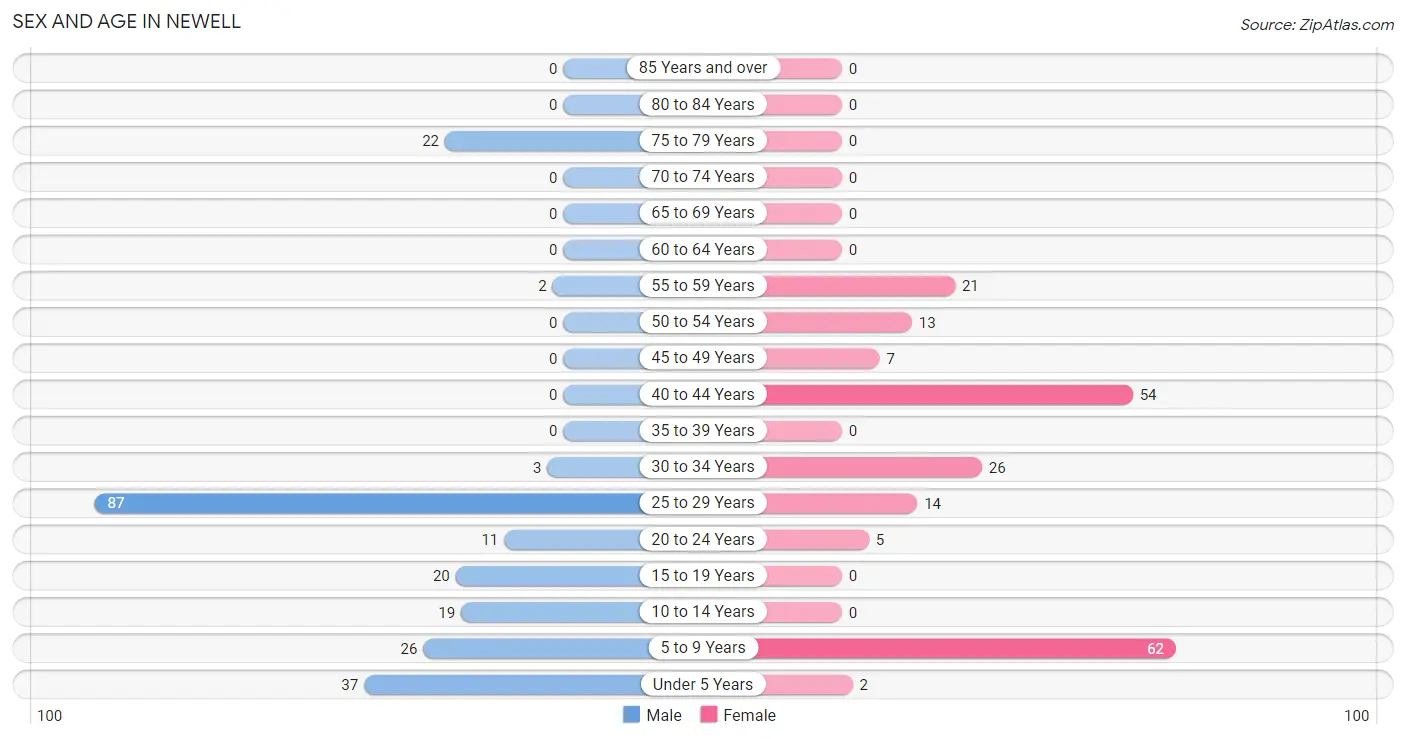
| Age Bracket | Male | Female |
| Under 5 Years | 37 (16.3%) | 2 (1.0%) |
| 5 to 9 Years | 26 (11.5%) | 62 (30.4%) |
| 10 to 14 Years | 19 (8.4%) | 0 (0.0%) |
| 15 to 19 Years | 20 (8.8%) | 0 (0.0%) |
| 20 to 24 Years | 11 (4.9%) | 5 (2.5%) |
| 25 to 29 Years | 87 (38.3%) | 14 (6.9%) |
| 30 to 34 Years | 3 (1.3%) | 26 (12.8%) |
| 35 to 39 Years | 0 (0.0%) | 0 (0.0%) |
| 40 to 44 Years | 0 (0.0%) | 54 (26.5%) |
| 45 to 49 Years | 0 (0.0%) | 7 (3.4%) |
| 50 to 54 Years | 0 (0.0%) | 13 (6.4%) |
| 55 to 59 Years | 2 (0.9%) | 21 (10.3%) |
| 60 to 64 Years | 0 (0.0%) | 0 (0.0%) |
| 65 to 69 Years | 0 (0.0%) | 0 (0.0%) |
| 70 to 74 Years | 0 (0.0%) | 0 (0.0%) |
| 75 to 79 Years | 22 (9.7%) | 0 (0.0%) |
| 80 to 84 Years | 0 (0.0%) | 0 (0.0%) |
| 85 Years and over | 0 (0.0%) | 0 (0.0%) |
| Total | 227 (100.0%) | 204 (100.0%) |
Families and Households in Newell
Median Family Size in Newell
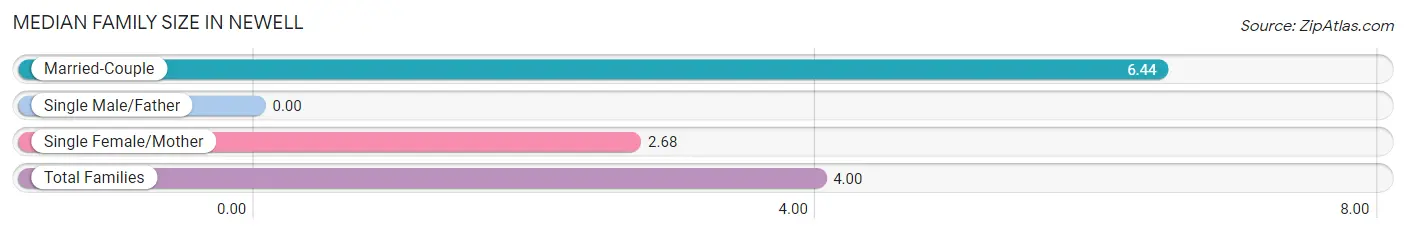
| Family Type | # Families | Family Size |
| Married-Couple | 27 (35.1%) | 6.44 |
| Single Male/Father | 0 (0.0%) | - |
| Single Female/Mother | 50 (64.9%) | 2.68 |
| Total Families | 77 (100.0%) | 4.00 |
Median Household Size in Newell
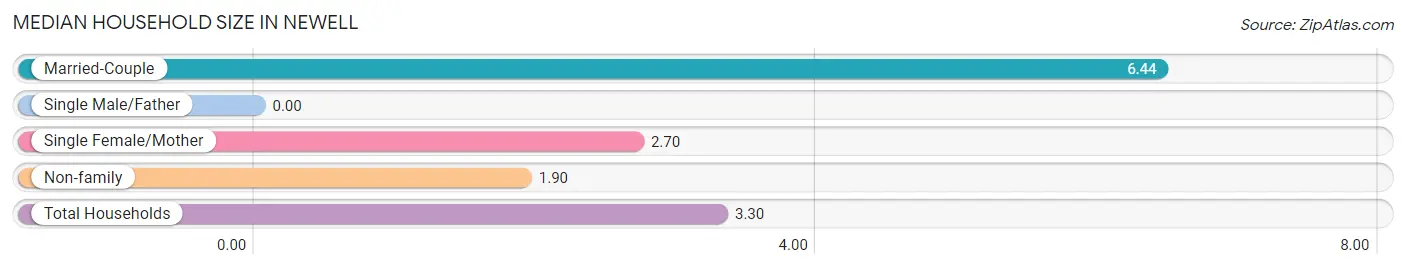
| Household Type | # Households | Household Size |
| Married-Couple | 27 (23.3%) | 6.44 |
| Single Male/Father | 0 (0.0%) | - |
| Single Female/Mother | 50 (43.1%) | 2.70 |
| Non-family | 39 (33.6%) | 1.90 |
| Total Households | 116 (100.0%) | 3.30 |
Household Size by Marriage Status in Newell
Out of a total of 116 households in Newell, 77 (66.4%) are family households, while 39 (33.6%) are nonfamily households. The most numerous type of family households are 4-person households, comprising 38, and the most common type of nonfamily households are 2-person households, comprising 27.
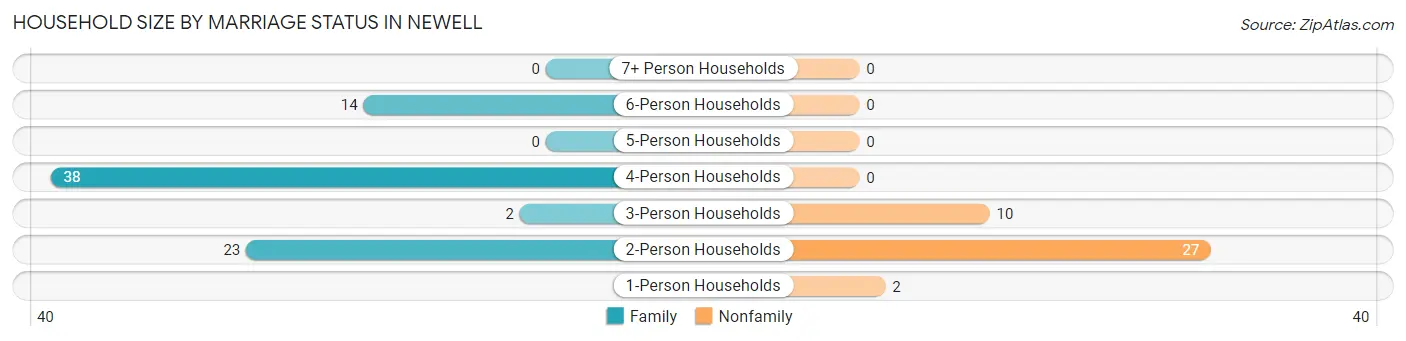
| Household Size | Family Households | Nonfamily Households |
| 1-Person Households | - | 2 (1.7%) |
| 2-Person Households | 23 (19.8%) | 27 (23.3%) |
| 3-Person Households | 2 (1.7%) | 10 (8.6%) |
| 4-Person Households | 38 (32.8%) | 0 (0.0%) |
| 5-Person Households | 0 (0.0%) | 0 (0.0%) |
| 6-Person Households | 14 (12.1%) | 0 (0.0%) |
| 7+ Person Households | 0 (0.0%) | 0 (0.0%) |
| Total | 77 (66.4%) | 39 (33.6%) |
Female Fertility in Newell
Fertility by Age in Newell
Average fertility rate in Newell is 132.0 births per 1,000 women. Women in the age bracket of 20 to 34 years have the highest fertility rate with 311.0 births per 1,000 women. Women in the age bracket of 20 to 34 years acount for 100.0% of all women with births.
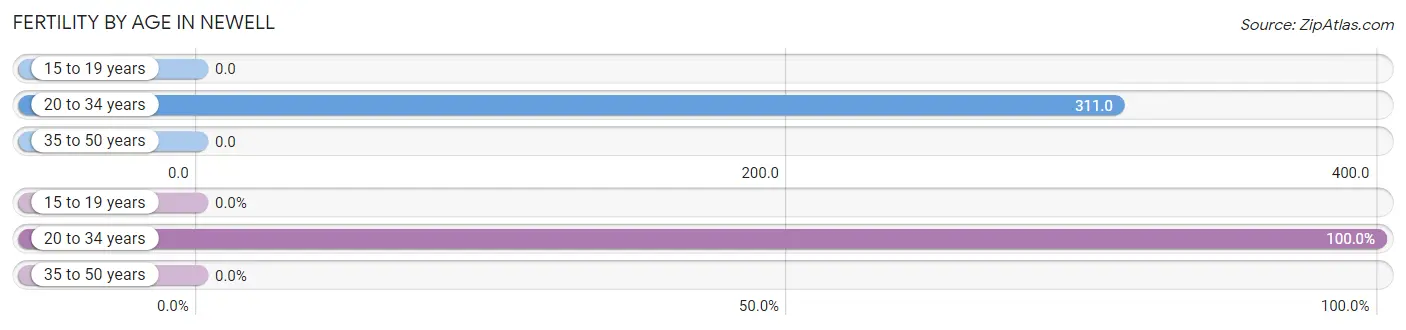
| Age Bracket | Women with Births | Births / 1,000 Women |
| 15 to 19 years | 0 (0.0%) | 0.0 |
| 20 to 34 years | 14 (100.0%) | 311.0 |
| 35 to 50 years | 0 (0.0%) | 0.0 |
| Total | 14 (100.0%) | 132.0 |
Fertility by Age by Marriage Status in Newell
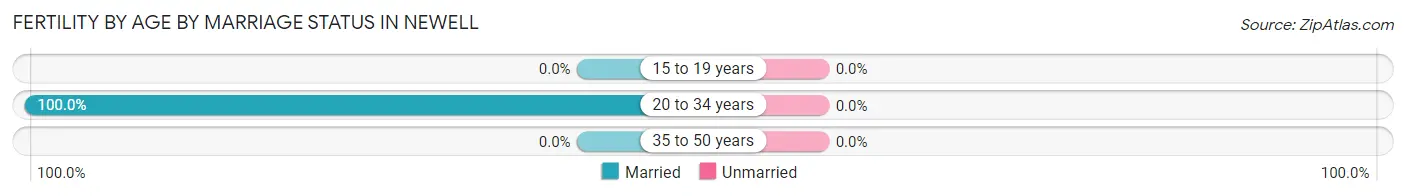
| Age Bracket | Married | Unmarried |
| 15 to 19 years | 0 (0.0%) | 0 (0.0%) |
| 20 to 34 years | 14 (100.0%) | 0 (0.0%) |
| 35 to 50 years | 0 (0.0%) | 0 (0.0%) |
| Total | 14 (100.0%) | 0 (0.0%) |
Fertility by Education in Newell
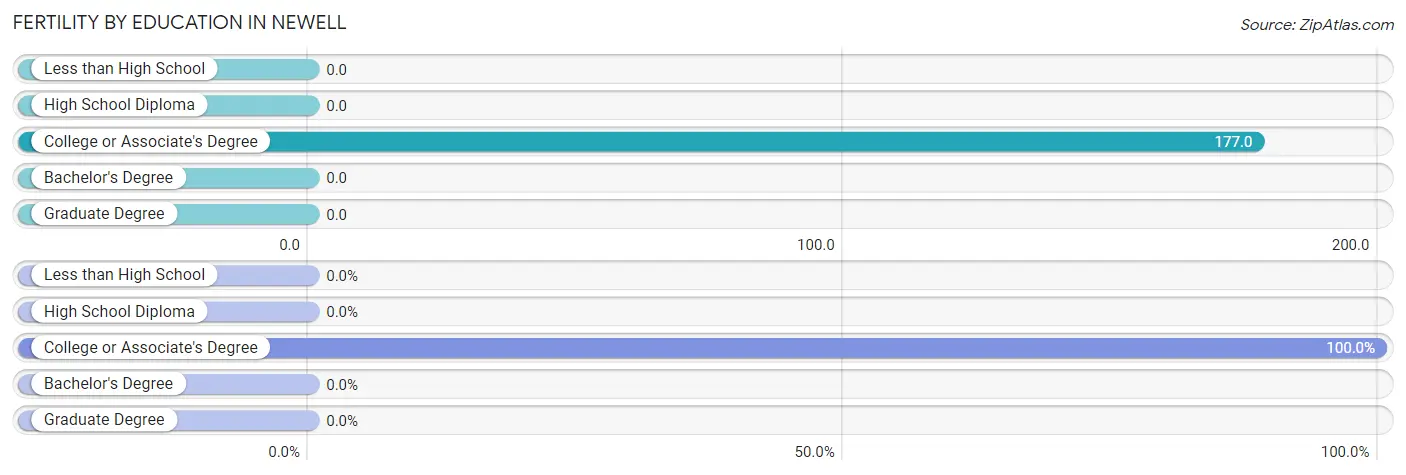
| Educational Attainment | Women with Births | Births / 1,000 Women |
| Less than High School | 0 (0.0%) | 0.0 |
| High School Diploma | 0 (0.0%) | 0.0 |
| College or Associate's Degree | 14 (100.0%) | 177.0 |
| Bachelor's Degree | 0 (0.0%) | 0.0 |
| Graduate Degree | 0 (0.0%) | 0.0 |
| Total | 14 (100.0%) | 132.0 |
Fertility by Education by Marriage Status in Newell
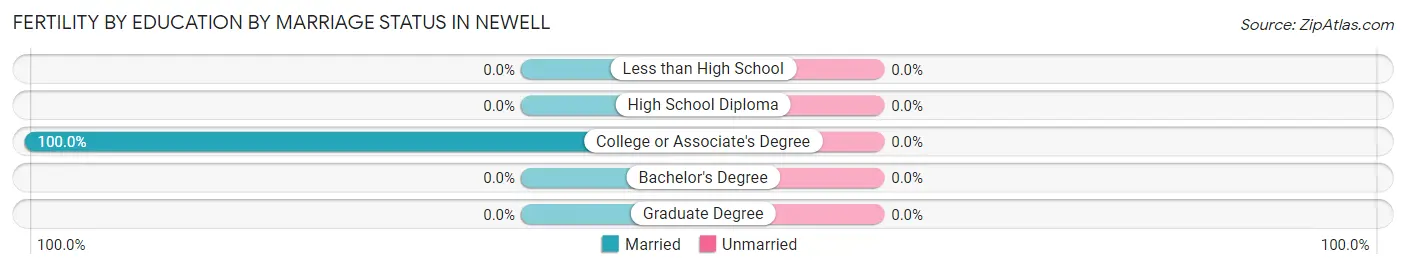
| Educational Attainment | Married | Unmarried |
| Less than High School | 0 (0.0%) | 0 (0.0%) |
| High School Diploma | 0 (0.0%) | 0 (0.0%) |
| College or Associate's Degree | 14 (100.0%) | 0 (0.0%) |
| Bachelor's Degree | 0 (0.0%) | 0 (0.0%) |
| Graduate Degree | 0 (0.0%) | 0 (0.0%) |
| Total | 14 (100.0%) | 0 (0.0%) |
Employment Characteristics in Newell
Employment by Class of Employer in Newell
Among the 182 employed individuals in Newell, private company employees (134 | 73.6%), and federal government employees (48 | 26.4%) make up the most common classes of employment.
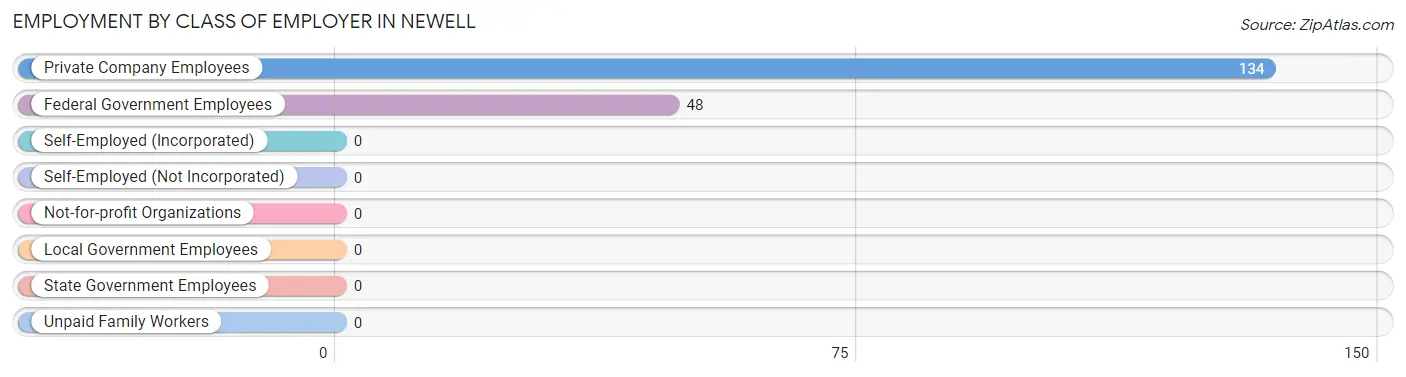
| Employer Class | # Employees | % Employees |
| Private Company Employees | 134 | 73.6% |
| Self-Employed (Incorporated) | 0 | 0.0% |
| Self-Employed (Not Incorporated) | 0 | 0.0% |
| Not-for-profit Organizations | 0 | 0.0% |
| Local Government Employees | 0 | 0.0% |
| State Government Employees | 0 | 0.0% |
| Federal Government Employees | 48 | 26.4% |
| Unpaid Family Workers | 0 | 0.0% |
| Total | 182 | 100.0% |
Employment Status by Age in Newell
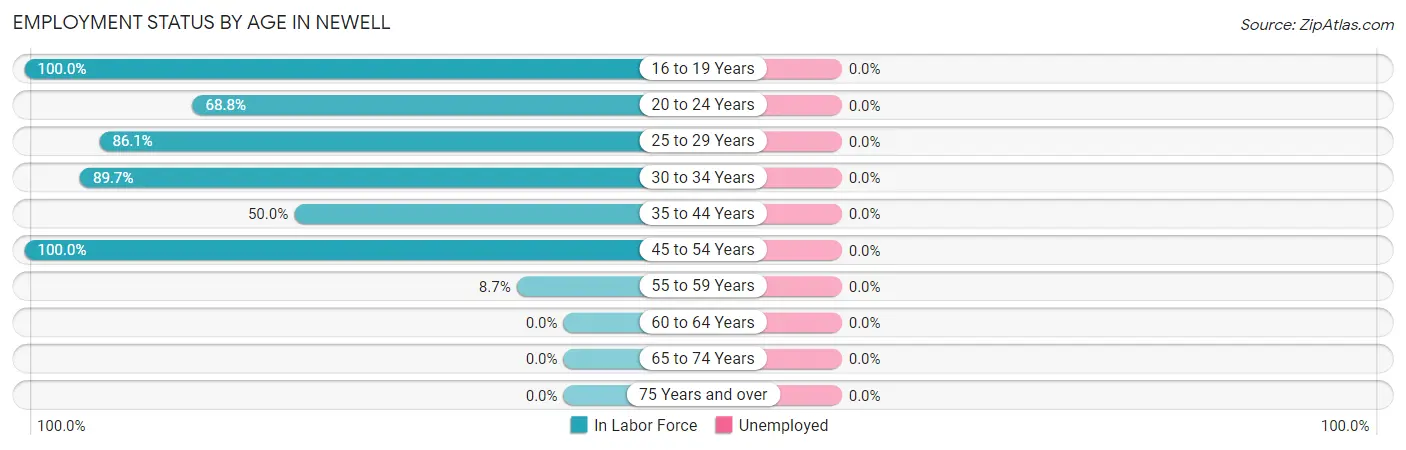
| Age Bracket | In Labor Force | Unemployed |
| 16 to 19 Years | 20 (100.0%) | 0 (0.0%) |
| 20 to 24 Years | 11 (68.8%) | 0 (0.0%) |
| 25 to 29 Years | 87 (86.1%) | 0 (0.0%) |
| 30 to 34 Years | 26 (89.7%) | 0 (0.0%) |
| 35 to 44 Years | 27 (50.0%) | 0 (0.0%) |
| 45 to 54 Years | 20 (100.0%) | 0 (0.0%) |
| 55 to 59 Years | 2 (8.7%) | 0 (0.0%) |
| 60 to 64 Years | 0 (0.0%) | 0 (0.0%) |
| 65 to 74 Years | 0 (0.0%) | 0 (0.0%) |
| 75 Years and over | 0 (0.0%) | 0 (0.0%) |
| Total | 193 (67.7%) | 0 (0.0%) |
Employment Status by Educational Attainment in Newell
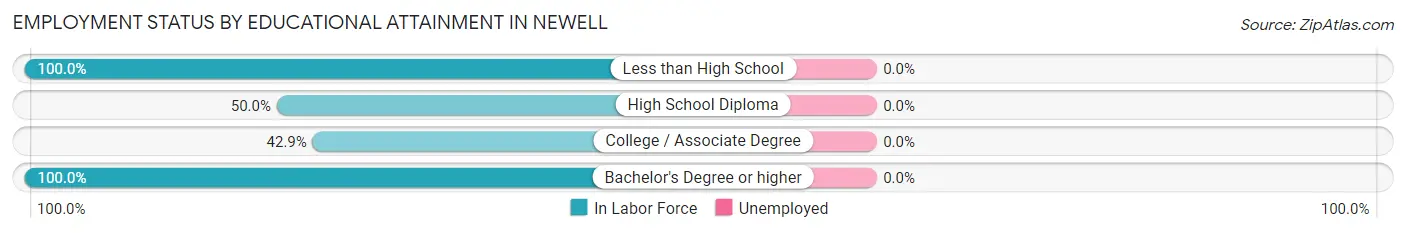
| Educational Attainment | In Labor Force | Unemployed |
| Less than High School | 60 (100.0%) | 0 (0.0%) |
| High School Diploma | 21 (50.0%) | 0 (0.0%) |
| College / Associate Degree | 33 (42.9%) | 0 (0.0%) |
| Bachelor's Degree or higher | 48 (100.0%) | 0 (0.0%) |
| Total | 162 (71.4%) | 0 (0.0%) |
Employment Occupations by Sex in Newell
Management, Business, Science and Arts Occupations
The most common Management, Business, Science and Arts occupations in Newell are Community & Social Service (24 | 12.4%), Education Instruction & Library (24 | 12.4%), and Business & Financial (6 | 3.1%).
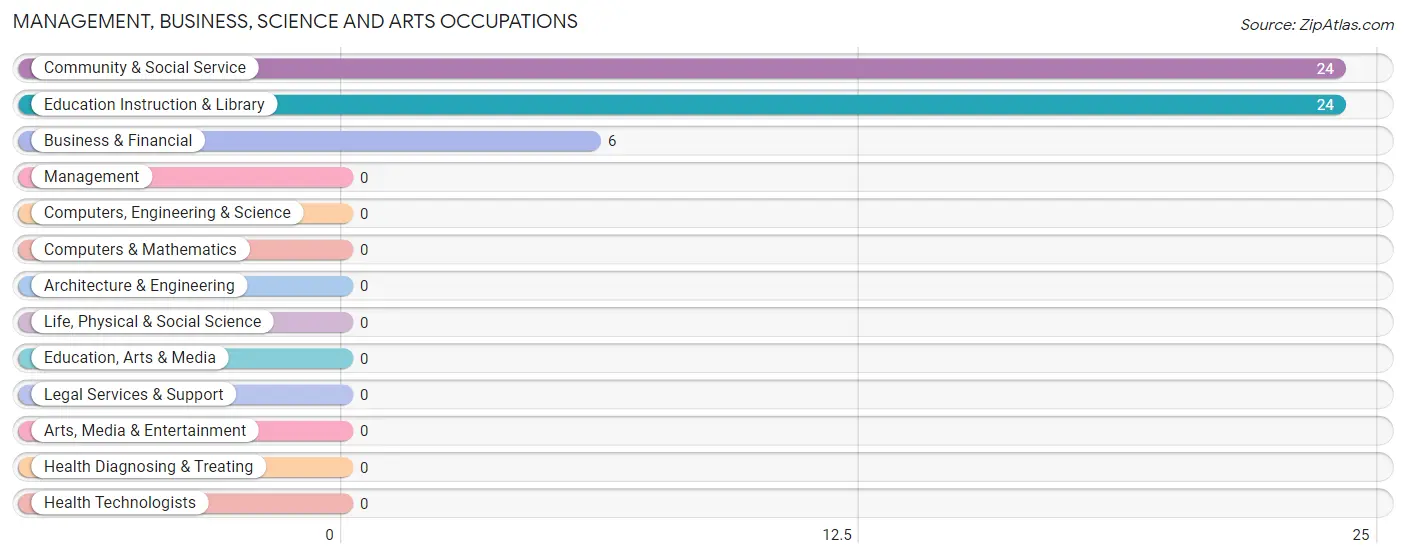
Management, Business, Science and Arts Occupations by Sex
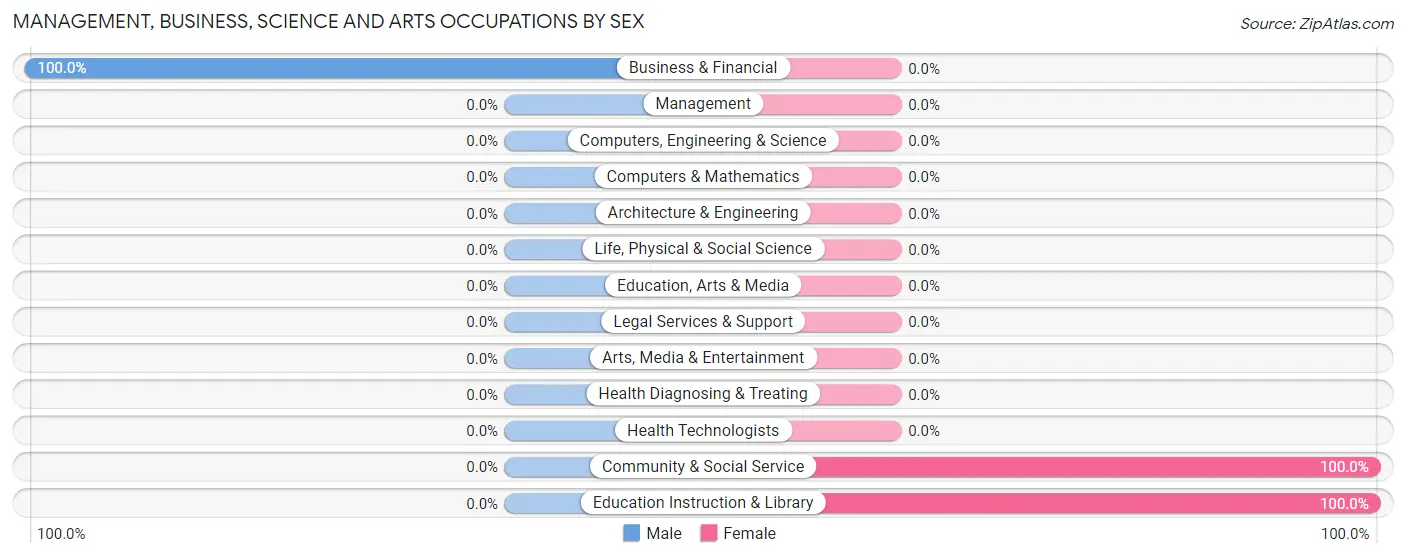
| Occupation | Male | Female |
| Management | 0 (0.0%) | 0 (0.0%) |
| Business & Financial | 6 (100.0%) | 0 (0.0%) |
| Computers, Engineering & Science | 0 (0.0%) | 0 (0.0%) |
| Computers & Mathematics | 0 (0.0%) | 0 (0.0%) |
| Architecture & Engineering | 0 (0.0%) | 0 (0.0%) |
| Life, Physical & Social Science | 0 (0.0%) | 0 (0.0%) |
| Community & Social Service | 0 (0.0%) | 24 (100.0%) |
| Education, Arts & Media | 0 (0.0%) | 0 (0.0%) |
| Legal Services & Support | 0 (0.0%) | 0 (0.0%) |
| Education Instruction & Library | 0 (0.0%) | 24 (100.0%) |
| Arts, Media & Entertainment | 0 (0.0%) | 0 (0.0%) |
| Health Diagnosing & Treating | 0 (0.0%) | 0 (0.0%) |
| Health Technologists | 0 (0.0%) | 0 (0.0%) |
| Total (Category) | 6 (20.0%) | 24 (80.0%) |
| Total (Overall) | 120 (62.2%) | 73 (37.8%) |
Services Occupations
The most common Services occupations in Newell are Food Preparation & Serving (20 | 10.4%), Security & Protection (10 | 5.2%), Firefighting & Prevention (10 | 5.2%), and Personal Care & Service (5 | 2.6%).
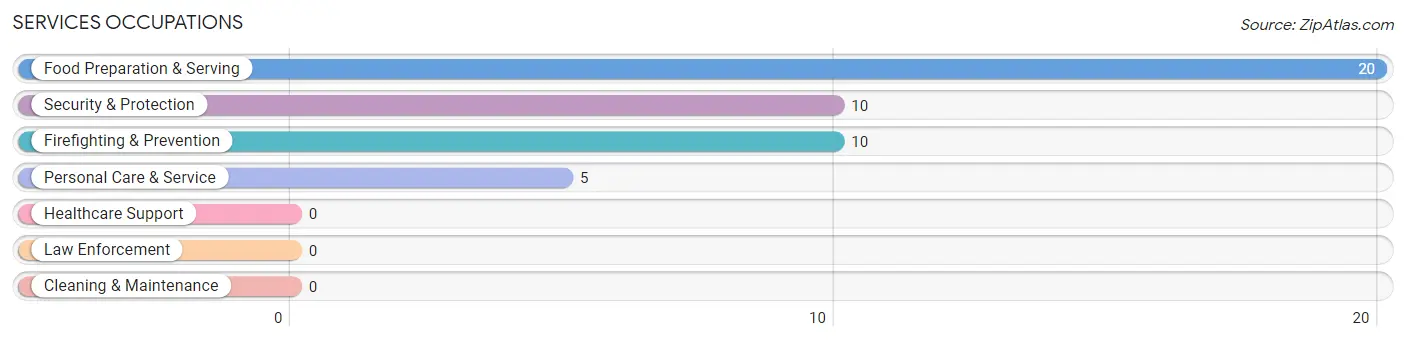
Services Occupations by Sex
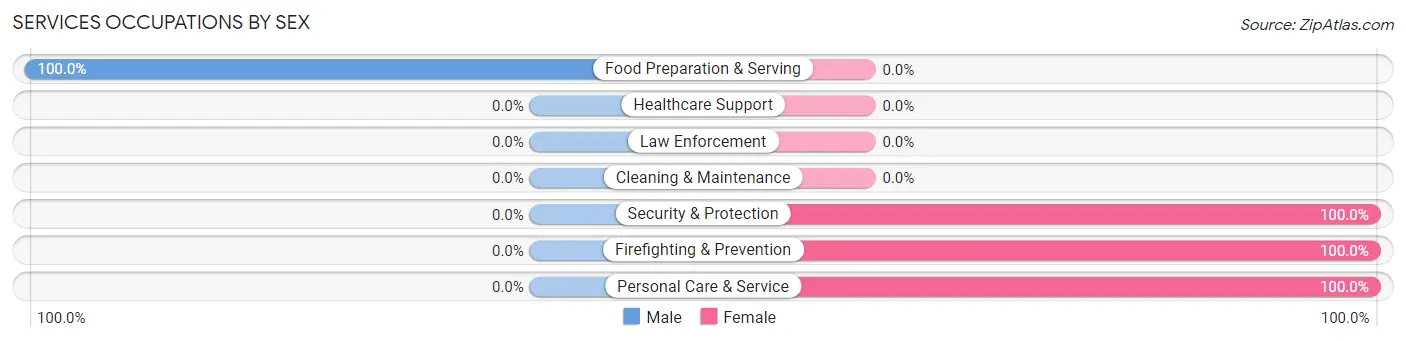
| Occupation | Male | Female |
| Healthcare Support | 0 (0.0%) | 0 (0.0%) |
| Security & Protection | 0 (0.0%) | 10 (100.0%) |
| Firefighting & Prevention | 0 (0.0%) | 10 (100.0%) |
| Law Enforcement | 0 (0.0%) | 0 (0.0%) |
| Food Preparation & Serving | 20 (100.0%) | 0 (0.0%) |
| Cleaning & Maintenance | 0 (0.0%) | 0 (0.0%) |
| Personal Care & Service | 0 (0.0%) | 5 (100.0%) |
| Total (Category) | 20 (57.1%) | 15 (42.9%) |
| Total (Overall) | 120 (62.2%) | 73 (37.8%) |
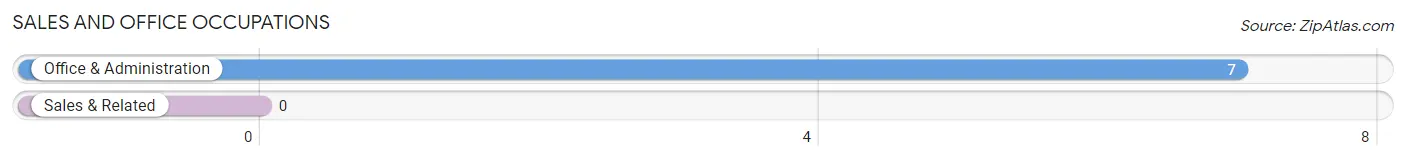
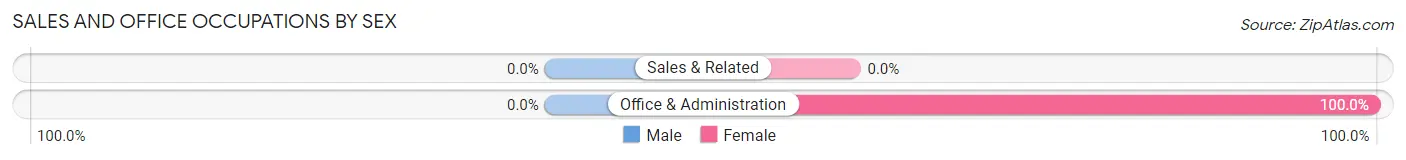
Sales and Office Occupations
The most common Sales and Office occupations in Newell are , and Office & Administration (7 | 3.6%).
Sales and Office Occupations by Sex
| Occupation | Male | Female |
| Sales & Related | 0 (0.0%) | 0 (0.0%) |
| Office & Administration | 0 (0.0%) | 7 (100.0%) |
| Total (Category) | 0 (0.0%) | 7 (100.0%) |
| Total (Overall) | 120 (62.2%) | 73 (37.8%) |
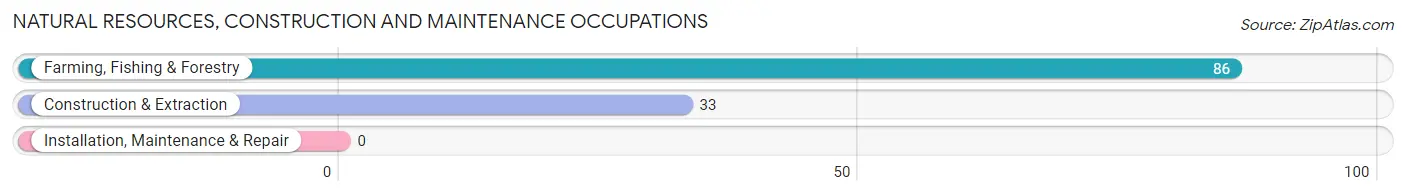
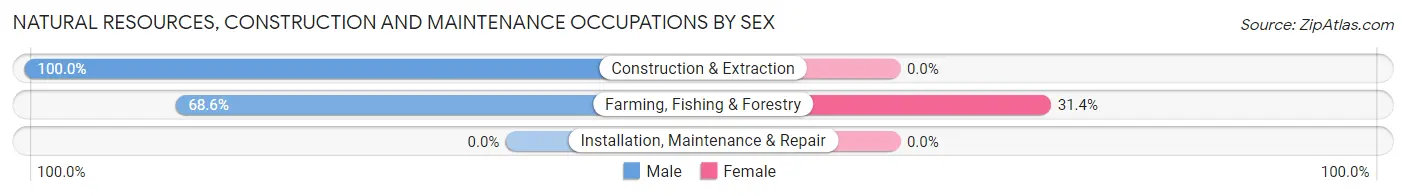
Natural Resources, Construction and Maintenance Occupations
The most common Natural Resources, Construction and Maintenance occupations in Newell are Farming, Fishing & Forestry (86 | 44.6%), and Construction & Extraction (33 | 17.1%).
Natural Resources, Construction and Maintenance Occupations by Sex
| Occupation | Male | Female |
| Farming, Fishing & Forestry | 59 (68.6%) | 27 (31.4%) |
| Construction & Extraction | 33 (100.0%) | 0 (0.0%) |
| Installation, Maintenance & Repair | 0 (0.0%) | 0 (0.0%) |
| Total (Category) | 92 (77.3%) | 27 (22.7%) |
| Total (Overall) | 120 (62.2%) | 73 (37.8%) |
Production, Transportation and Moving Occupations
The most common Production, Transportation and Moving occupations in Newell are , and Transportation (2 | 1.0%).
Production, Transportation and Moving Occupations by Sex
| Occupation | Male | Female |
| Production | 0 (0.0%) | 0 (0.0%) |
| Transportation | 2 (100.0%) | 0 (0.0%) |
| Material Moving | 0 (0.0%) | 0 (0.0%) |
| Total (Category) | 2 (100.0%) | 0 (0.0%) |
| Total (Overall) | 120 (62.2%) | 73 (37.8%) |
Employment Industries by Sex in Newell
Employment Industries in Newell
The major employment industries in Newell include Arts, Entertainment & Recreation (48 | 24.9%), Agriculture, Fishing & Hunting (38 | 19.7%), Construction (33 | 17.1%), Educational Services (24 | 12.4%), and Accommodation & Food Services (20 | 10.4%).
Employment Industries by Sex in Newell
The Newell industries that see more men than women are Construction (100.0%), Wholesale Trade (100.0%), and Professional & Scientific (100.0%), whereas the industries that tend to have a higher number of women are Transportation & Warehousing (100.0%), Administrative & Support (100.0%), and Educational Services (100.0%).
| Industry | Male | Female |
| Agriculture, Fishing & Hunting | 11 (28.9%) | 27 (71.1%) |
| Mining, Quarrying, & Extraction | 0 (0.0%) | 0 (0.0%) |
| Construction | 33 (100.0%) | 0 (0.0%) |
| Manufacturing | 0 (0.0%) | 0 (0.0%) |
| Wholesale Trade | 2 (100.0%) | 0 (0.0%) |
| Retail Trade | 0 (0.0%) | 0 (0.0%) |
| Transportation & Warehousing | 0 (0.0%) | 7 (100.0%) |
| Utilities | 0 (0.0%) | 0 (0.0%) |
| Information | 0 (0.0%) | 0 (0.0%) |
| Finance & Insurance | 0 (0.0%) | 0 (0.0%) |
| Real Estate, Rental & Leasing | 0 (0.0%) | 0 (0.0%) |
| Professional & Scientific | 6 (100.0%) | 0 (0.0%) |
| Enterprise Management | 0 (0.0%) | 0 (0.0%) |
| Administrative & Support | 0 (0.0%) | 10 (100.0%) |
| Educational Services | 0 (0.0%) | 24 (100.0%) |
| Health Care & Social Assistance | 0 (0.0%) | 5 (100.0%) |
| Arts, Entertainment & Recreation | 48 (100.0%) | 0 (0.0%) |
| Accommodation & Food Services | 20 (100.0%) | 0 (0.0%) |
| Public Administration | 0 (0.0%) | 0 (0.0%) |
| Total | 120 (62.2%) | 73 (37.8%) |
Education in Newell
School Enrollment in Newell
The most common levels of schooling among the 119 students in Newell are elementary school (78 | 65.5%), college / undergraduate (20 | 16.8%), and high school (19 | 16.0%).
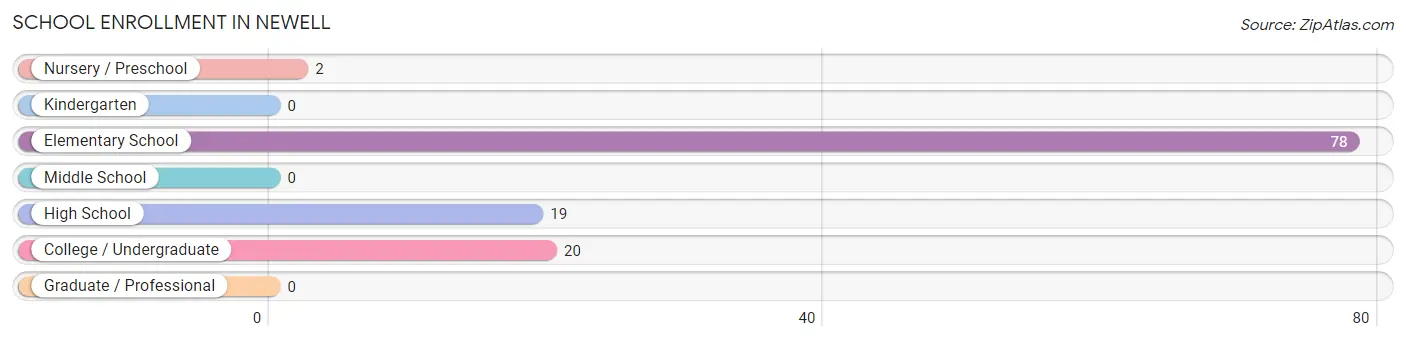
| School Level | # Students | % Students |
| Nursery / Preschool | 2 | 1.7% |
| Kindergarten | 0 | 0.0% |
| Elementary School | 78 | 65.5% |
| Middle School | 0 | 0.0% |
| High School | 19 | 16.0% |
| College / Undergraduate | 20 | 16.8% |
| Graduate / Professional | 0 | 0.0% |
| Total | 119 | 100.0% |
School Enrollment by Age by Funding Source in Newell
Out of a total of 119 students who are enrolled in schools in Newell, 2 (1.7%) attend a private institution, while the remaining 117 (98.3%) are enrolled in public schools. The age group of 3 to 4 year olds has the highest likelihood of being enrolled in private schools, with 2 (100.0% in the age bracket) enrolled. Conversely, the age group of 5 to 9 year old has the lowest likelihood of being enrolled in a private school, with 78 (100.0% in the age bracket) attending a public institution.
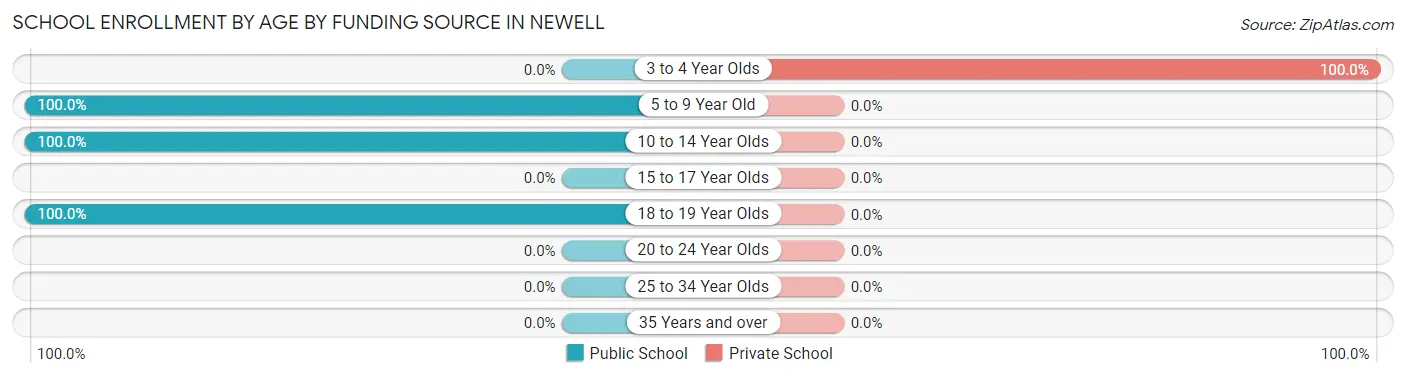
| Age Bracket | Public School | Private School |
| 3 to 4 Year Olds | 0 (0.0%) | 2 (100.0%) |
| 5 to 9 Year Old | 78 (100.0%) | 0 (0.0%) |
| 10 to 14 Year Olds | 19 (100.0%) | 0 (0.0%) |
| 15 to 17 Year Olds | 0 (0.0%) | 0 (0.0%) |
| 18 to 19 Year Olds | 20 (100.0%) | 0 (0.0%) |
| 20 to 24 Year Olds | 0 (0.0%) | 0 (0.0%) |
| 25 to 34 Year Olds | 0 (0.0%) | 0 (0.0%) |
| 35 Years and over | 0 (0.0%) | 0 (0.0%) |
| Total | 117 (98.3%) | 2 (1.7%) |
Educational Attainment by Field of Study in Newell
, and bio, nature & agricultural (48 | 100.0%) are the most common fields of study among 48 individuals in Newell who have obtained a bachelor's degree or higher.
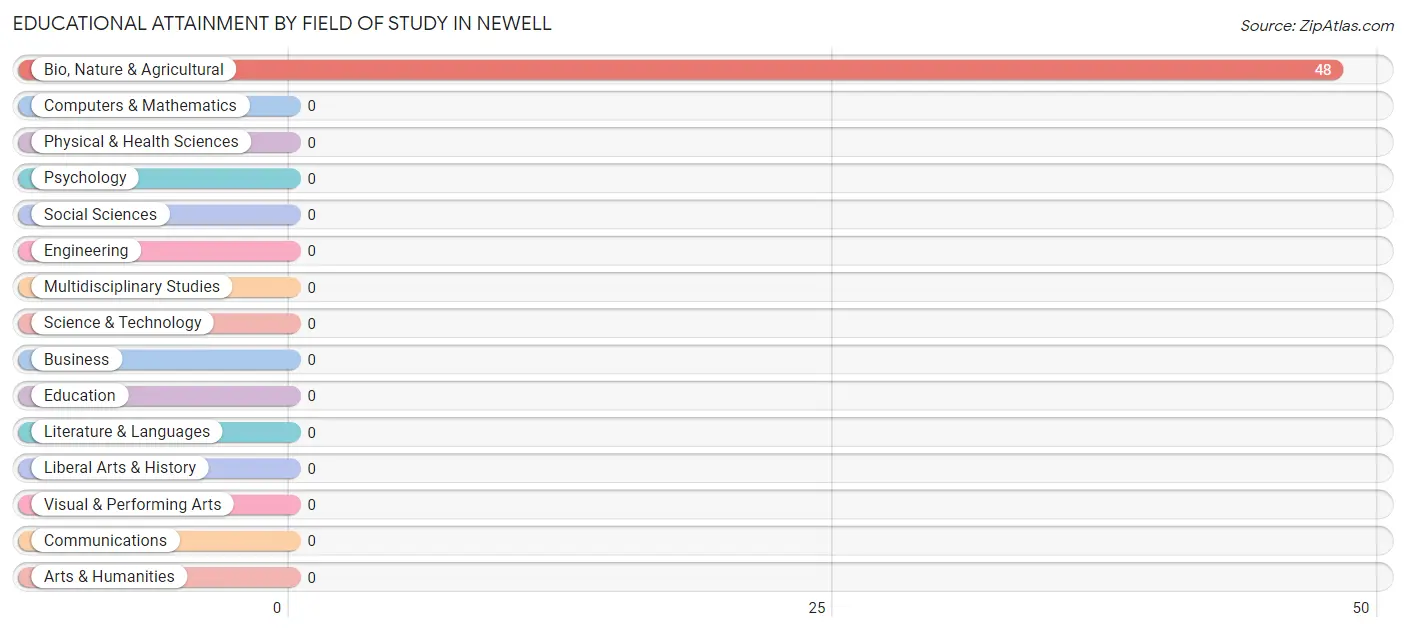
| Field of Study | # Graduates | % Graduates |
| Computers & Mathematics | 0 | 0.0% |
| Bio, Nature & Agricultural | 48 | 100.0% |
| Physical & Health Sciences | 0 | 0.0% |
| Psychology | 0 | 0.0% |
| Social Sciences | 0 | 0.0% |
| Engineering | 0 | 0.0% |
| Multidisciplinary Studies | 0 | 0.0% |
| Science & Technology | 0 | 0.0% |
| Business | 0 | 0.0% |
| Education | 0 | 0.0% |
| Literature & Languages | 0 | 0.0% |
| Liberal Arts & History | 0 | 0.0% |
| Visual & Performing Arts | 0 | 0.0% |
| Communications | 0 | 0.0% |
| Arts & Humanities | 0 | 0.0% |
| Total | 48 | 100.0% |
Transportation & Commute in Newell
Vehicle Availability by Sex in Newell
The most prevalent vehicle ownership categories in Newell are males with 3 vehicles (39, accounting for 63.9%) and females with 3 vehicles (17, making up 53.4%).
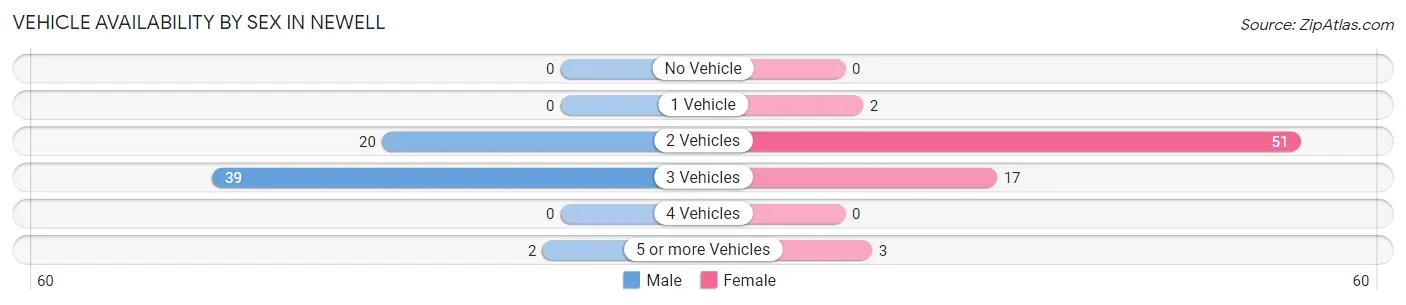
| Vehicles Available | Male | Female |
| No Vehicle | 0 (0.0%) | 0 (0.0%) |
| 1 Vehicle | 0 (0.0%) | 2 (2.7%) |
| 2 Vehicles | 20 (32.8%) | 51 (69.9%) |
| 3 Vehicles | 39 (63.9%) | 17 (23.3%) |
| 4 Vehicles | 0 (0.0%) | 0 (0.0%) |
| 5 or more Vehicles | 2 (3.3%) | 3 (4.1%) |
| Total | 61 (100.0%) | 73 (100.0%) |
Commute Time in Newell
The most frequently occuring commute durations in Newell are 5 to 9 minutes (51 commuters, 28.0%), less than 5 minutes (48 commuters, 26.4%), and 90 or more minutes (43 commuters, 23.6%).
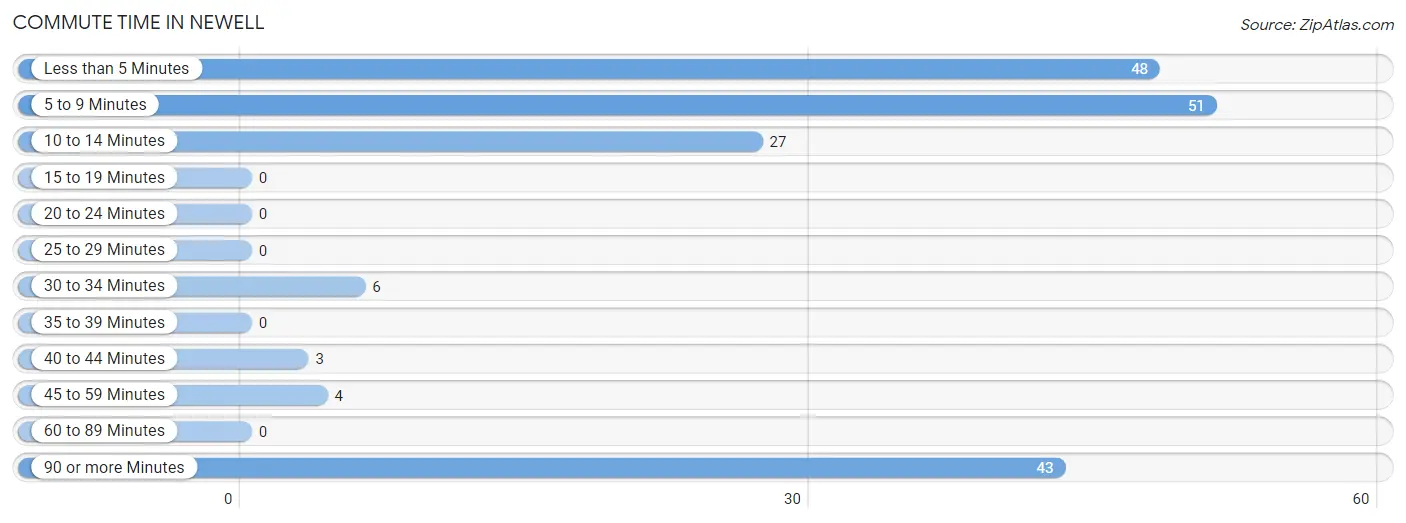
| Commute Time | # Commuters | % Commuters |
| Less than 5 Minutes | 48 | 26.4% |
| 5 to 9 Minutes | 51 | 28.0% |
| 10 to 14 Minutes | 27 | 14.8% |
| 15 to 19 Minutes | 0 | 0.0% |
| 20 to 24 Minutes | 0 | 0.0% |
| 25 to 29 Minutes | 0 | 0.0% |
| 30 to 34 Minutes | 6 | 3.3% |
| 35 to 39 Minutes | 0 | 0.0% |
| 40 to 44 Minutes | 3 | 1.7% |
| 45 to 59 Minutes | 4 | 2.2% |
| 60 to 89 Minutes | 0 | 0.0% |
| 90 or more Minutes | 43 | 23.6% |
Commute Time by Sex in Newell
The most common commute times in Newell are less than 5 minutes (48 commuters, 44.0%) for males and 5 to 9 minutes (31 commuters, 42.5%) for females.
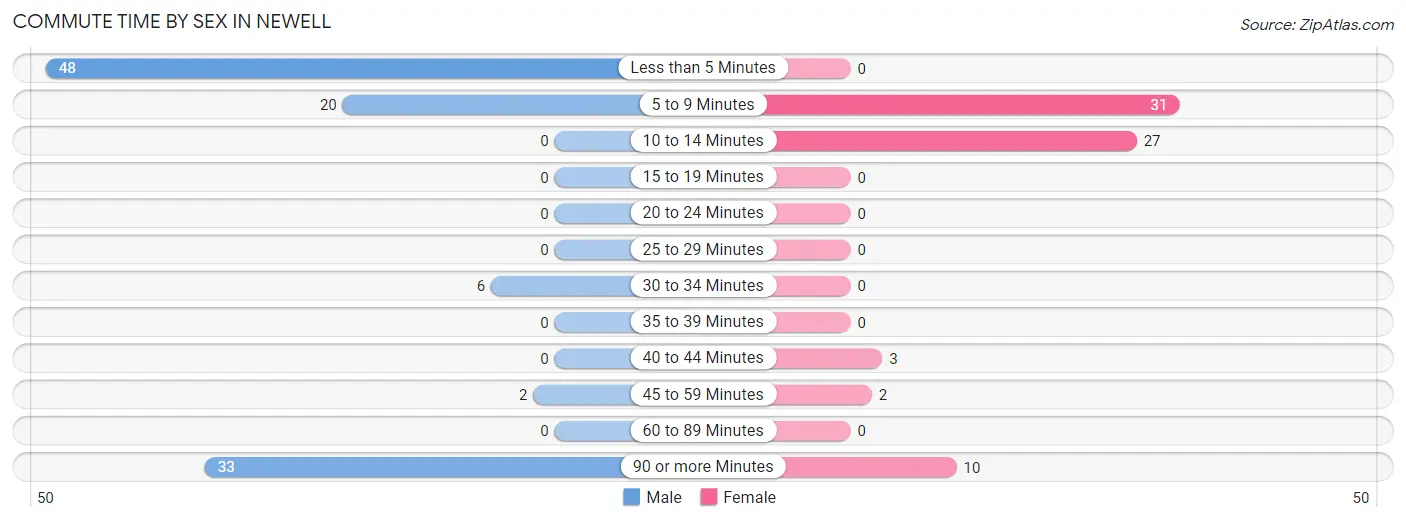
| Commute Time | Male | Female |
| Less than 5 Minutes | 48 (44.0%) | 0 (0.0%) |
| 5 to 9 Minutes | 20 (18.3%) | 31 (42.5%) |
| 10 to 14 Minutes | 0 (0.0%) | 27 (37.0%) |
| 15 to 19 Minutes | 0 (0.0%) | 0 (0.0%) |
| 20 to 24 Minutes | 0 (0.0%) | 0 (0.0%) |
| 25 to 29 Minutes | 0 (0.0%) | 0 (0.0%) |
| 30 to 34 Minutes | 6 (5.5%) | 0 (0.0%) |
| 35 to 39 Minutes | 0 (0.0%) | 0 (0.0%) |
| 40 to 44 Minutes | 0 (0.0%) | 3 (4.1%) |
| 45 to 59 Minutes | 2 (1.8%) | 2 (2.7%) |
| 60 to 89 Minutes | 0 (0.0%) | 0 (0.0%) |
| 90 or more Minutes | 33 (30.3%) | 10 (13.7%) |
Time of Departure to Work by Sex in Newell
The most frequent times of departure to work in Newell are 6:00 AM to 6:29 AM (48, 44.0%) for males and 7:00 AM to 7:29 AM (47, 64.4%) for females.
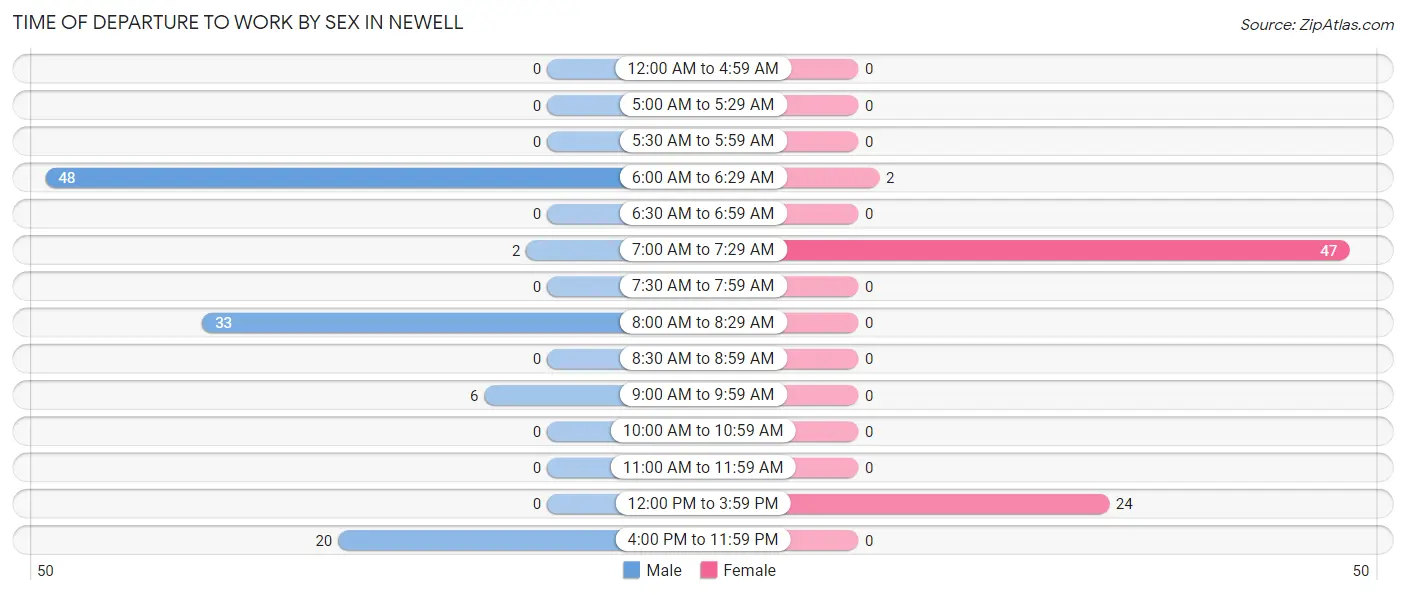
| Time of Departure | Male | Female |
| 12:00 AM to 4:59 AM | 0 (0.0%) | 0 (0.0%) |
| 5:00 AM to 5:29 AM | 0 (0.0%) | 0 (0.0%) |
| 5:30 AM to 5:59 AM | 0 (0.0%) | 0 (0.0%) |
| 6:00 AM to 6:29 AM | 48 (44.0%) | 2 (2.7%) |
| 6:30 AM to 6:59 AM | 0 (0.0%) | 0 (0.0%) |
| 7:00 AM to 7:29 AM | 2 (1.8%) | 47 (64.4%) |
| 7:30 AM to 7:59 AM | 0 (0.0%) | 0 (0.0%) |
| 8:00 AM to 8:29 AM | 33 (30.3%) | 0 (0.0%) |
| 8:30 AM to 8:59 AM | 0 (0.0%) | 0 (0.0%) |
| 9:00 AM to 9:59 AM | 6 (5.5%) | 0 (0.0%) |
| 10:00 AM to 10:59 AM | 0 (0.0%) | 0 (0.0%) |
| 11:00 AM to 11:59 AM | 0 (0.0%) | 0 (0.0%) |
| 12:00 PM to 3:59 PM | 0 (0.0%) | 24 (32.9%) |
| 4:00 PM to 11:59 PM | 20 (18.3%) | 0 (0.0%) |
| Total | 109 (100.0%) | 73 (100.0%) |
Housing Occupancy in Newell
Occupancy by Ownership in Newell
Of the total 116 dwellings in Newell, owner-occupied units account for 76 (65.5%), while renter-occupied units make up 40 (34.5%).
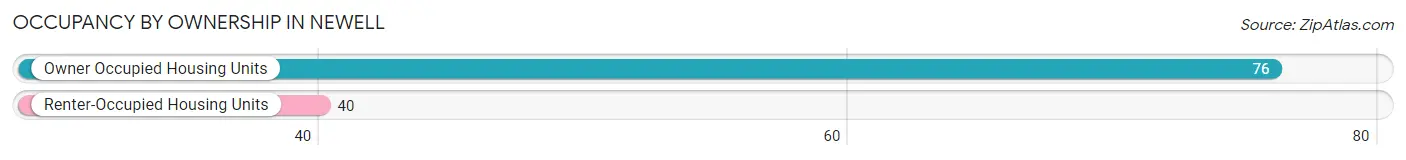
| Occupancy | # Housing Units | % Housing Units |
| Owner Occupied Housing Units | 76 | 65.5% |
| Renter-Occupied Housing Units | 40 | 34.5% |
| Total Occupied Housing Units | 116 | 100.0% |
Occupancy by Household Size in Newell
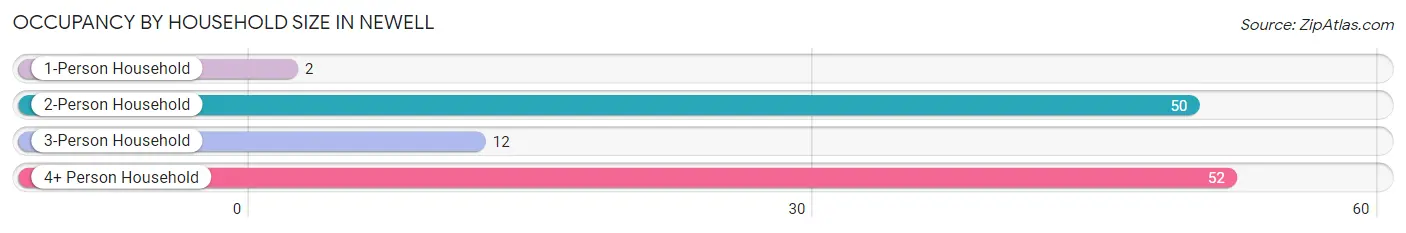
| Household Size | # Housing Units | % Housing Units |
| 1-Person Household | 2 | 1.7% |
| 2-Person Household | 50 | 43.1% |
| 3-Person Household | 12 | 10.3% |
| 4+ Person Household | 52 | 44.8% |
| Total Housing Units | 116 | 100.0% |
Occupancy by Ownership by Household Size in Newell
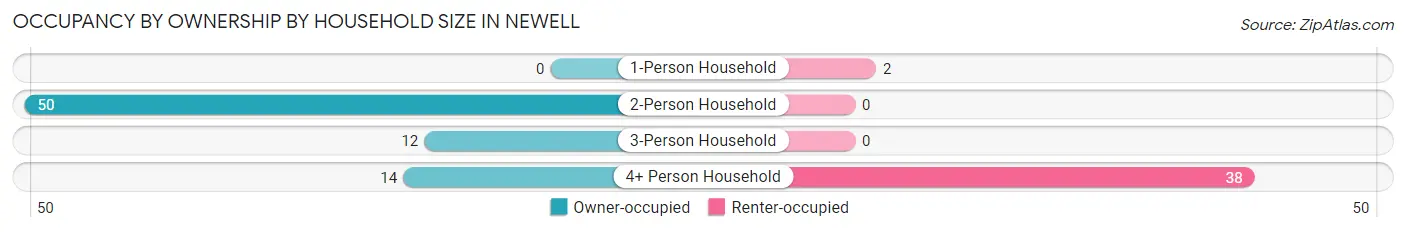
| Household Size | Owner-occupied | Renter-occupied |
| 1-Person Household | 0 (0.0%) | 2 (100.0%) |
| 2-Person Household | 50 (100.0%) | 0 (0.0%) |
| 3-Person Household | 12 (100.0%) | 0 (0.0%) |
| 4+ Person Household | 14 (26.9%) | 38 (73.1%) |
| Total Housing Units | 76 (65.5%) | 40 (34.5%) |
Occupancy by Educational Attainment in Newell
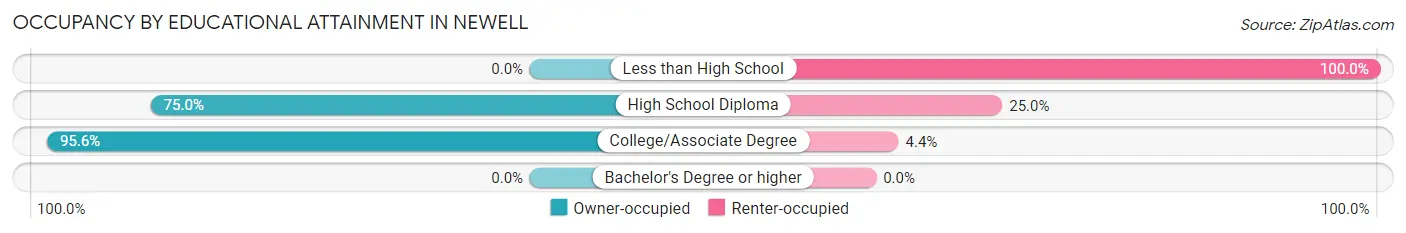
| Household Size | Owner-occupied | Renter-occupied |
| Less than High School | 0 (0.0%) | 27 (100.0%) |
| High School Diploma | 33 (75.0%) | 11 (25.0%) |
| College/Associate Degree | 43 (95.6%) | 2 (4.4%) |
| Bachelor's Degree or higher | 0 (0.0%) | 0 (0.0%) |
Occupancy by Age of Householder in Newell
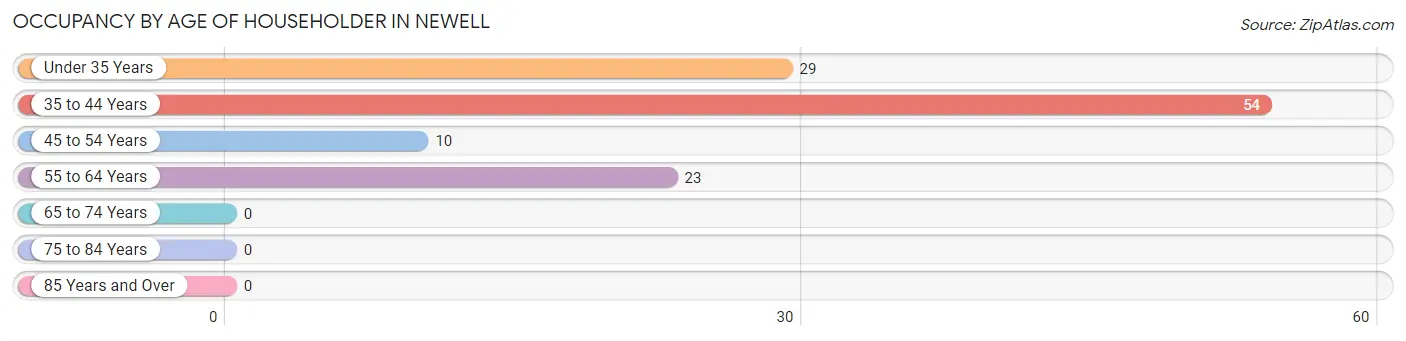
| Age Bracket | # Households | % Households |
| Under 35 Years | 29 | 25.0% |
| 35 to 44 Years | 54 | 46.6% |
| 45 to 54 Years | 10 | 8.6% |
| 55 to 64 Years | 23 | 19.8% |
| 65 to 74 Years | 0 | 0.0% |
| 75 to 84 Years | 0 | 0.0% |
| 85 Years and Over | 0 | 0.0% |
| Total | 116 | 100.0% |
Housing Finances in Newell
Median Income by Occupancy in Newell
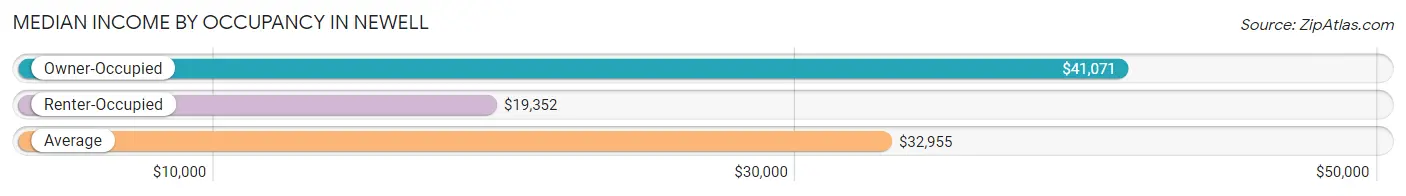
| Occupancy Type | # Households | Median Income |
| Owner-Occupied | 76 (65.5%) | $41,071 |
| Renter-Occupied | 40 (34.5%) | $19,352 |
| Average | 116 (100.0%) | $32,955 |
Occupancy by Householder Income Bracket in Newell
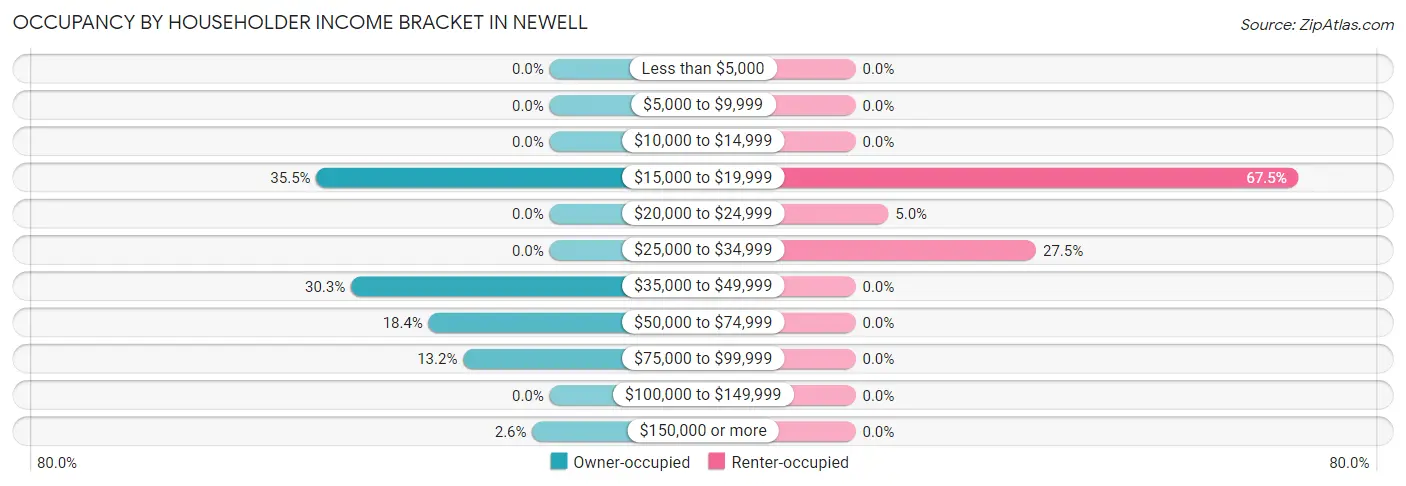
| Income Bracket | Owner-occupied | Renter-occupied |
| Less than $5,000 | 0 (0.0%) | 0 (0.0%) |
| $5,000 to $9,999 | 0 (0.0%) | 0 (0.0%) |
| $10,000 to $14,999 | 0 (0.0%) | 0 (0.0%) |
| $15,000 to $19,999 | 27 (35.5%) | 27 (67.5%) |
| $20,000 to $24,999 | 0 (0.0%) | 2 (5.0%) |
| $25,000 to $34,999 | 0 (0.0%) | 11 (27.5%) |
| $35,000 to $49,999 | 23 (30.3%) | 0 (0.0%) |
| $50,000 to $74,999 | 14 (18.4%) | 0 (0.0%) |
| $75,000 to $99,999 | 10 (13.2%) | 0 (0.0%) |
| $100,000 to $149,999 | 0 (0.0%) | 0 (0.0%) |
| $150,000 or more | 2 (2.6%) | 0 (0.0%) |
| Total | 76 (100.0%) | 40 (100.0%) |
Monthly Housing Cost Tiers in Newell
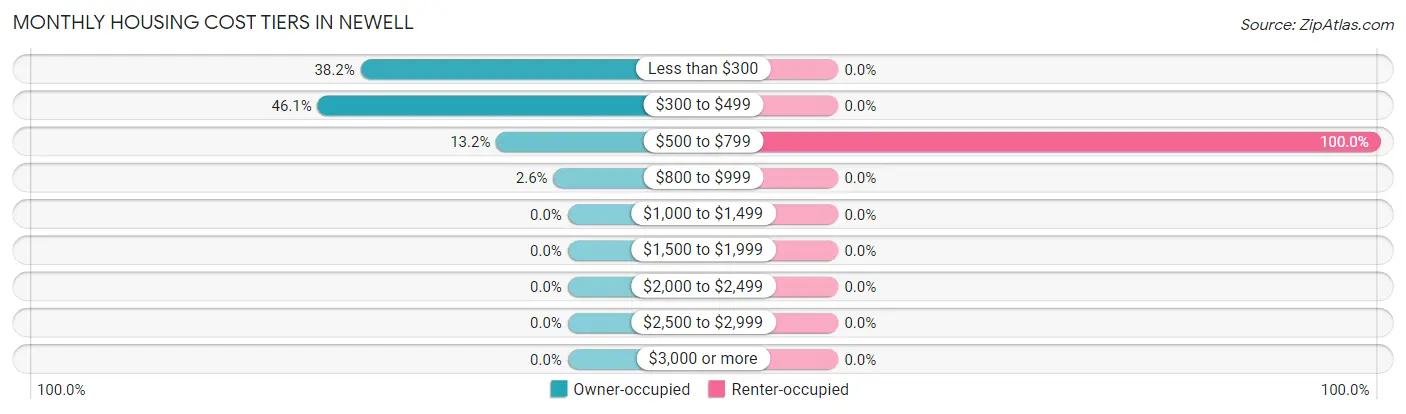
| Monthly Cost | Owner-occupied | Renter-occupied |
| Less than $300 | 29 (38.2%) | 0 (0.0%) |
| $300 to $499 | 35 (46.1%) | 0 (0.0%) |
| $500 to $799 | 10 (13.2%) | 40 (100.0%) |
| $800 to $999 | 2 (2.6%) | 0 (0.0%) |
| $1,000 to $1,499 | 0 (0.0%) | 0 (0.0%) |
| $1,500 to $1,999 | 0 (0.0%) | 0 (0.0%) |
| $2,000 to $2,499 | 0 (0.0%) | 0 (0.0%) |
| $2,500 to $2,999 | 0 (0.0%) | 0 (0.0%) |
| $3,000 or more | 0 (0.0%) | 0 (0.0%) |
| Total | 76 (100.0%) | 40 (100.0%) |
Physical Housing Characteristics in Newell
Housing Structures in Newell
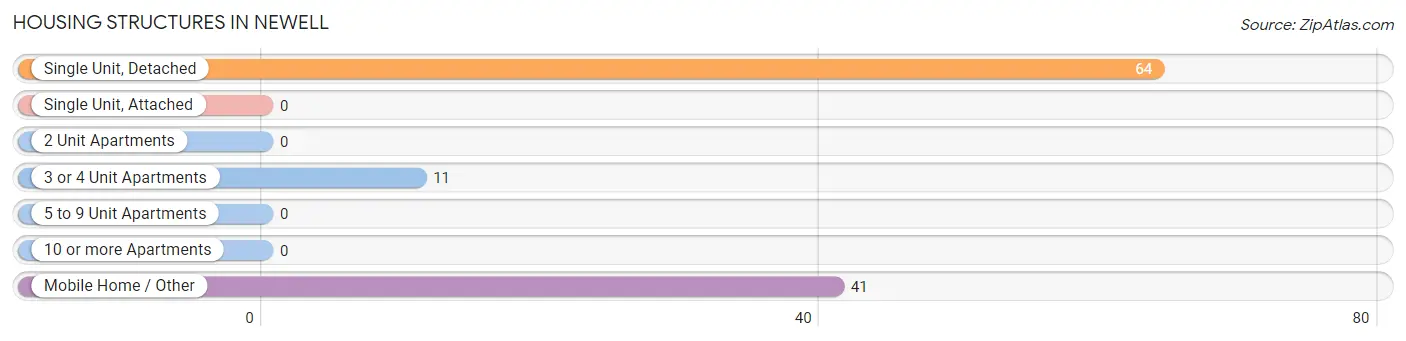
| Structure Type | # Housing Units | % Housing Units |
| Single Unit, Detached | 64 | 55.2% |
| Single Unit, Attached | 0 | 0.0% |
| 2 Unit Apartments | 0 | 0.0% |
| 3 or 4 Unit Apartments | 11 | 9.5% |
| 5 to 9 Unit Apartments | 0 | 0.0% |
| 10 or more Apartments | 0 | 0.0% |
| Mobile Home / Other | 41 | 35.3% |
| Total | 116 | 100.0% |
Housing Structures by Occupancy in Newell
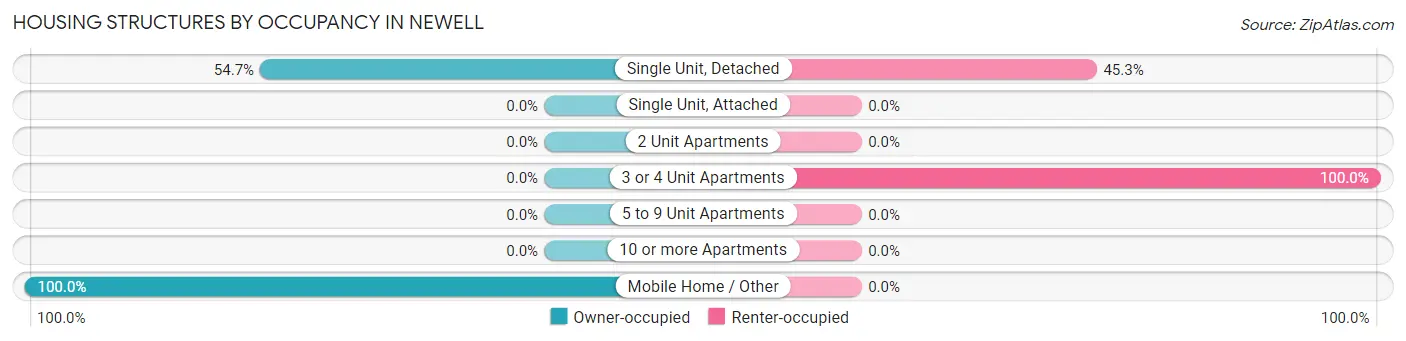
| Structure Type | Owner-occupied | Renter-occupied |
| Single Unit, Detached | 35 (54.7%) | 29 (45.3%) |
| Single Unit, Attached | 0 (0.0%) | 0 (0.0%) |
| 2 Unit Apartments | 0 (0.0%) | 0 (0.0%) |
| 3 or 4 Unit Apartments | 0 (0.0%) | 11 (100.0%) |
| 5 to 9 Unit Apartments | 0 (0.0%) | 0 (0.0%) |
| 10 or more Apartments | 0 (0.0%) | 0 (0.0%) |
| Mobile Home / Other | 41 (100.0%) | 0 (0.0%) |
| Total | 76 (65.5%) | 40 (34.5%) |
Housing Structures by Number of Rooms in Newell
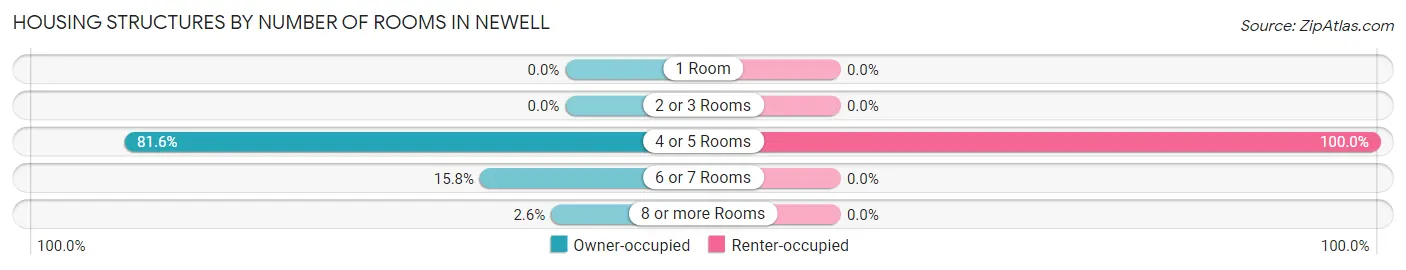
| Number of Rooms | Owner-occupied | Renter-occupied |
| 1 Room | 0 (0.0%) | 0 (0.0%) |
| 2 or 3 Rooms | 0 (0.0%) | 0 (0.0%) |
| 4 or 5 Rooms | 62 (81.6%) | 40 (100.0%) |
| 6 or 7 Rooms | 12 (15.8%) | 0 (0.0%) |
| 8 or more Rooms | 2 (2.6%) | 0 (0.0%) |
| Total | 76 (100.0%) | 40 (100.0%) |
Housing Structure by Heating Type in Newell
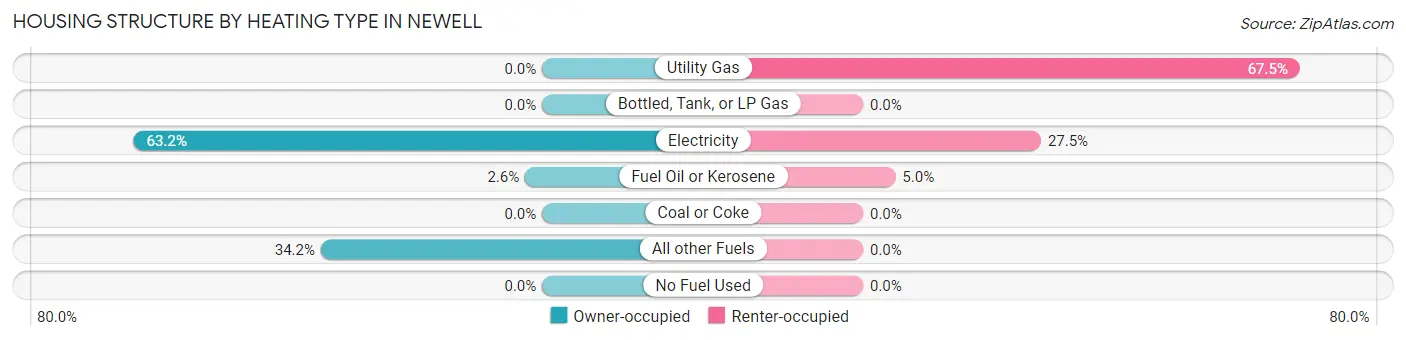
| Heating Type | Owner-occupied | Renter-occupied |
| Utility Gas | 0 (0.0%) | 27 (67.5%) |
| Bottled, Tank, or LP Gas | 0 (0.0%) | 0 (0.0%) |
| Electricity | 48 (63.2%) | 11 (27.5%) |
| Fuel Oil or Kerosene | 2 (2.6%) | 2 (5.0%) |
| Coal or Coke | 0 (0.0%) | 0 (0.0%) |
| All other Fuels | 26 (34.2%) | 0 (0.0%) |
| No Fuel Used | 0 (0.0%) | 0 (0.0%) |
| Total | 76 (100.0%) | 40 (100.0%) |
Household Vehicle Usage in Newell
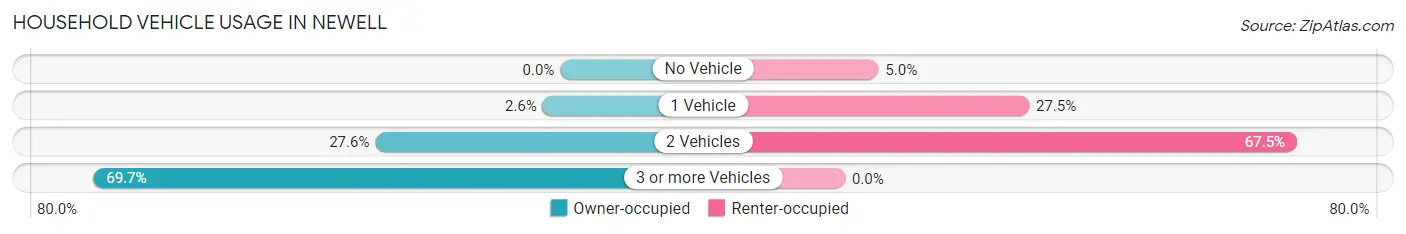
| Vehicles per Household | Owner-occupied | Renter-occupied |
| No Vehicle | 0 (0.0%) | 2 (5.0%) |
| 1 Vehicle | 2 (2.6%) | 11 (27.5%) |
| 2 Vehicles | 21 (27.6%) | 27 (67.5%) |
| 3 or more Vehicles | 53 (69.7%) | 0 (0.0%) |
| Total | 76 (100.0%) | 40 (100.0%) |
Real Estate & Mortgages in Newell
Real Estate and Mortgage Overview in Newell
| Characteristic | Without Mortgage | With Mortgage |
| Housing Units | 64 | 12 |
| Median Property Value | - | - |
| Median Household Income | $40,595 | $0 |
| Monthly Housing Costs | $409 | $0 |
| Real Estate Taxes | $624 | $0 |
Property Value by Mortgage Status in Newell
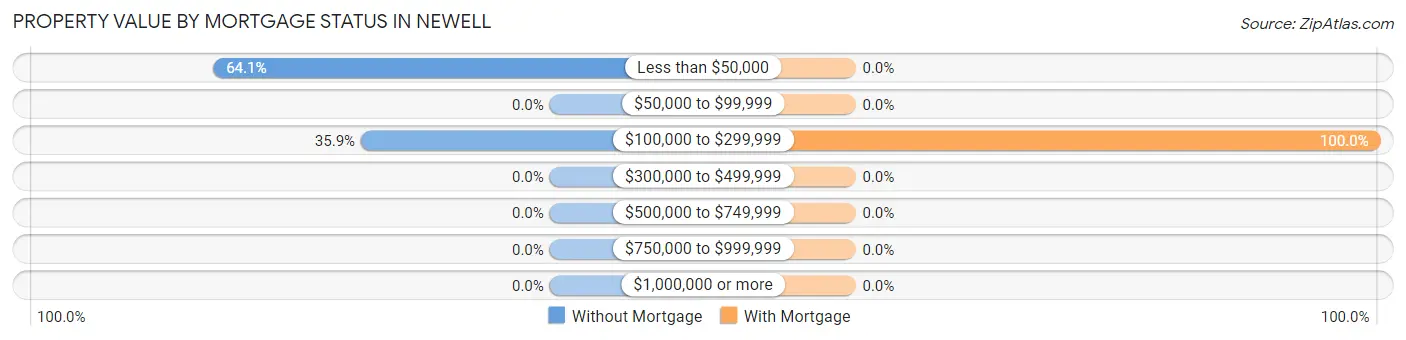
| Property Value | Without Mortgage | With Mortgage |
| Less than $50,000 | 41 (64.1%) | 0 (0.0%) |
| $50,000 to $99,999 | 0 (0.0%) | 0 (0.0%) |
| $100,000 to $299,999 | 23 (35.9%) | 12 (100.0%) |
| $300,000 to $499,999 | 0 (0.0%) | 0 (0.0%) |
| $500,000 to $749,999 | 0 (0.0%) | 0 (0.0%) |
| $750,000 to $999,999 | 0 (0.0%) | 0 (0.0%) |
| $1,000,000 or more | 0 (0.0%) | 0 (0.0%) |
| Total | 64 (100.0%) | 12 (100.0%) |
Household Income by Mortgage Status in Newell
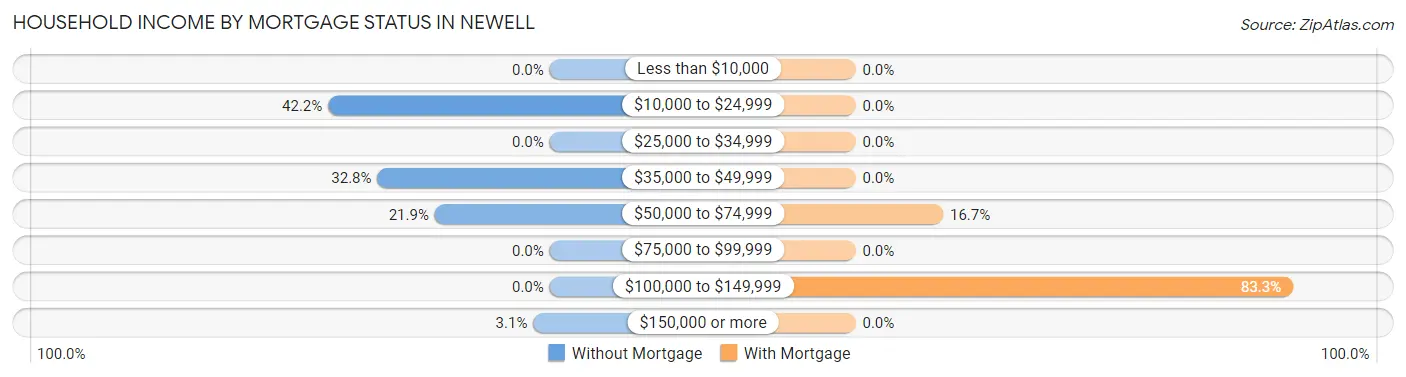
| Household Income | Without Mortgage | With Mortgage |
| Less than $10,000 | 0 (0.0%) | 0 (0.0%) |
| $10,000 to $24,999 | 27 (42.2%) | 0 (0.0%) |
| $25,000 to $34,999 | 0 (0.0%) | 0 (0.0%) |
| $35,000 to $49,999 | 21 (32.8%) | 0 (0.0%) |
| $50,000 to $74,999 | 14 (21.9%) | 2 (16.7%) |
| $75,000 to $99,999 | 0 (0.0%) | 0 (0.0%) |
| $100,000 to $149,999 | 0 (0.0%) | 10 (83.3%) |
| $150,000 or more | 2 (3.1%) | 0 (0.0%) |
| Total | 64 (100.0%) | 12 (100.0%) |
Property Value to Household Income Ratio in Newell
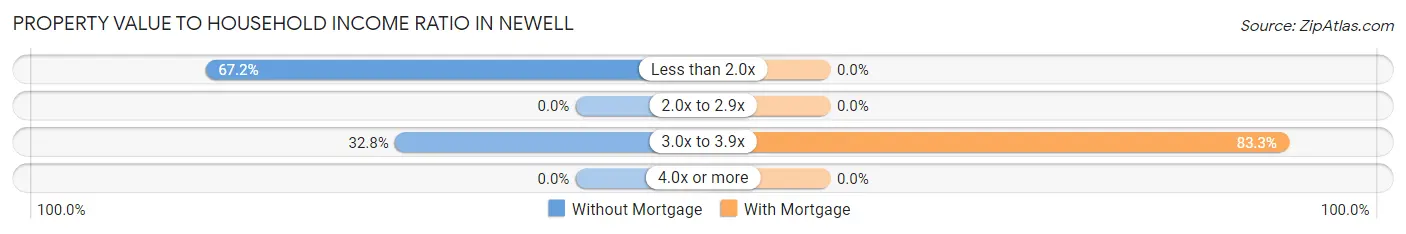
| Value-to-Income Ratio | Without Mortgage | With Mortgage |
| Less than 2.0x | 43 (67.2%) | 0 (0.0%) |
| 2.0x to 2.9x | 0 (0.0%) | 0 (0.0%) |
| 3.0x to 3.9x | 21 (32.8%) | 10 (83.3%) |
| 4.0x or more | 0 (0.0%) | 0 (0.0%) |
| Total | 64 (100.0%) | 12 (100.0%) |
Real Estate Taxes by Mortgage Status in Newell
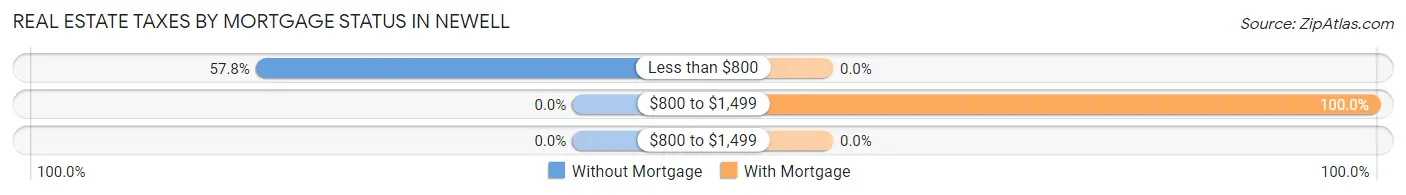
| Property Taxes | Without Mortgage | With Mortgage |
| Less than $800 | 37 (57.8%) | 0 (0.0%) |
| $800 to $1,499 | 0 (0.0%) | 12 (100.0%) |
| $800 to $1,499 | 0 (0.0%) | 0 (0.0%) |
| Total | 64 (100.0%) | 12 (100.0%) |
Health & Disability in Newell
Health Insurance Coverage by Age in Newell
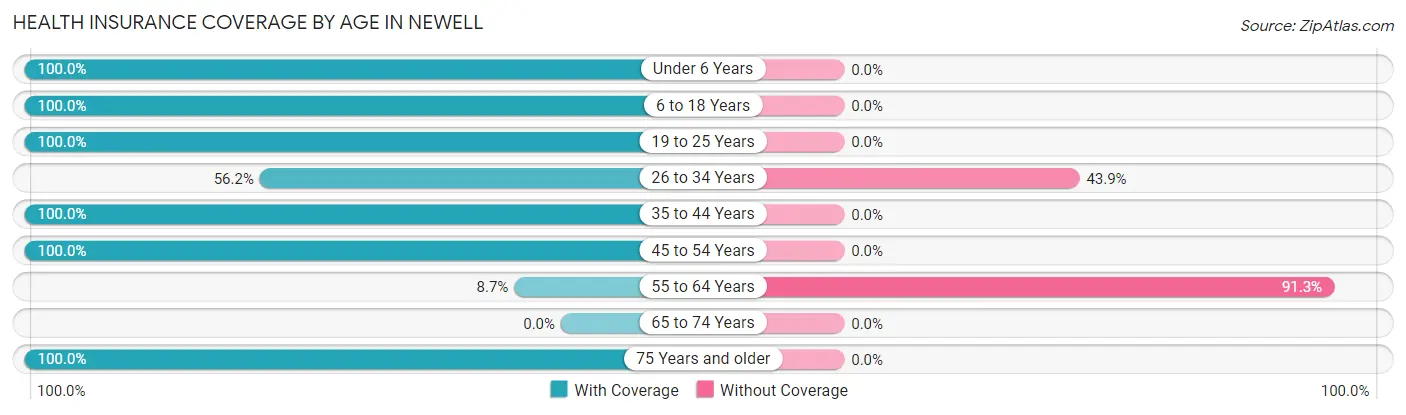
| Age Bracket | With Coverage | Without Coverage |
| Under 6 Years | 49 (100.0%) | 0 (0.0%) |
| 6 to 18 Years | 97 (100.0%) | 0 (0.0%) |
| 19 to 25 Years | 36 (100.0%) | 0 (0.0%) |
| 26 to 34 Years | 73 (56.1%) | 57 (43.9%) |
| 35 to 44 Years | 54 (100.0%) | 0 (0.0%) |
| 45 to 54 Years | 20 (100.0%) | 0 (0.0%) |
| 55 to 64 Years | 2 (8.7%) | 21 (91.3%) |
| 65 to 74 Years | 0 (0.0%) | 0 (0.0%) |
| 75 Years and older | 22 (100.0%) | 0 (0.0%) |
| Total | 353 (81.9%) | 78 (18.1%) |
Health Insurance Coverage by Citizenship Status in Newell
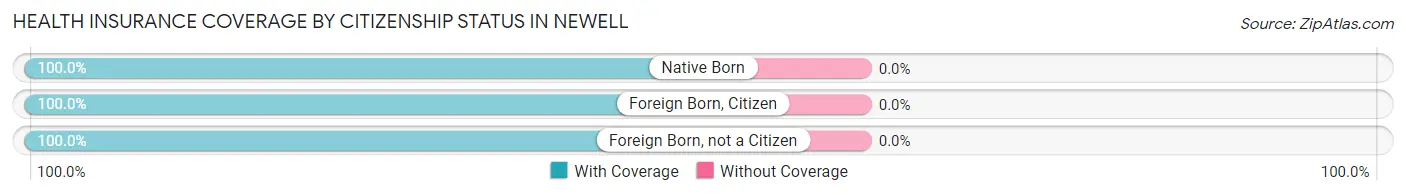
| Citizenship Status | With Coverage | Without Coverage |
| Native Born | 49 (100.0%) | 0 (0.0%) |
| Foreign Born, Citizen | 97 (100.0%) | 0 (0.0%) |
| Foreign Born, not a Citizen | 36 (100.0%) | 0 (0.0%) |
Health Insurance Coverage by Household Income in Newell
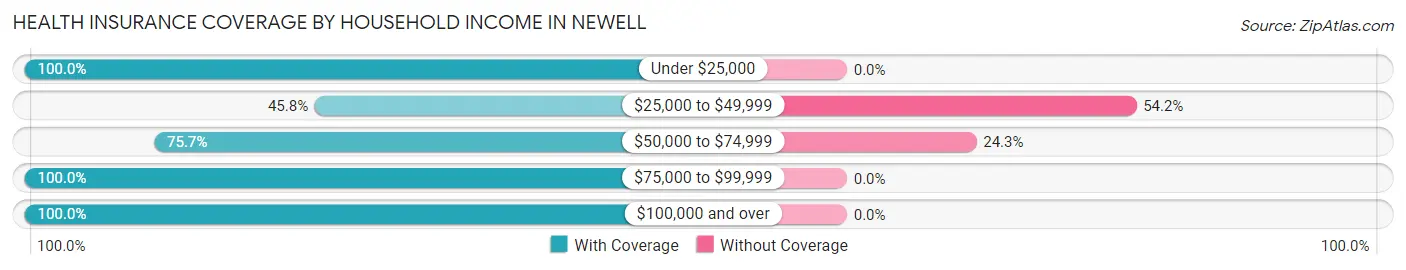
| Household Income | With Coverage | Without Coverage |
| Under $25,000 | 136 (100.0%) | 0 (0.0%) |
| $25,000 to $49,999 | 38 (45.8%) | 45 (54.2%) |
| $50,000 to $74,999 | 103 (75.7%) | 33 (24.3%) |
| $75,000 to $99,999 | 23 (100.0%) | 0 (0.0%) |
| $100,000 and over | 5 (100.0%) | 0 (0.0%) |
Public vs Private Health Insurance Coverage by Age in Newell
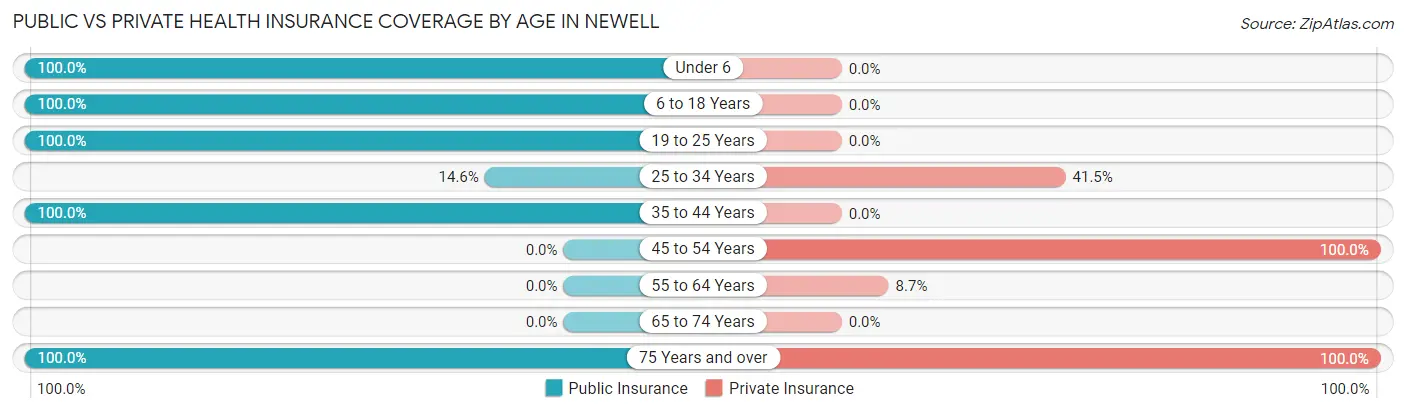
| Age Bracket | Public Insurance | Private Insurance |
| Under 6 | 49 (100.0%) | 0 (0.0%) |
| 6 to 18 Years | 97 (100.0%) | 0 (0.0%) |
| 19 to 25 Years | 36 (100.0%) | 0 (0.0%) |
| 25 to 34 Years | 19 (14.6%) | 54 (41.5%) |
| 35 to 44 Years | 54 (100.0%) | 0 (0.0%) |
| 45 to 54 Years | 0 (0.0%) | 20 (100.0%) |
| 55 to 64 Years | 0 (0.0%) | 2 (8.7%) |
| 65 to 74 Years | 0 (0.0%) | 0 (0.0%) |
| 75 Years and over | 22 (100.0%) | 22 (100.0%) |
| Total | 277 (64.3%) | 98 (22.7%) |
Disability Status by Sex by Age in Newell
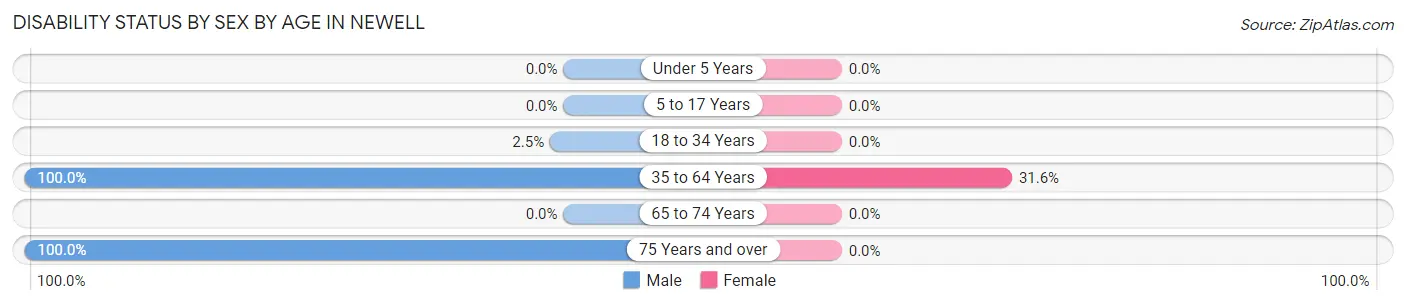
| Age Bracket | Male | Female |
| Under 5 Years | 0 (0.0%) | 0 (0.0%) |
| 5 to 17 Years | 0 (0.0%) | 0 (0.0%) |
| 18 to 34 Years | 3 (2.5%) | 0 (0.0%) |
| 35 to 64 Years | 2 (100.0%) | 30 (31.6%) |
| 65 to 74 Years | 0 (0.0%) | 0 (0.0%) |
| 75 Years and over | 22 (100.0%) | 0 (0.0%) |
Disability Class by Sex by Age in Newell
Disability Class: Hearing Difficulty
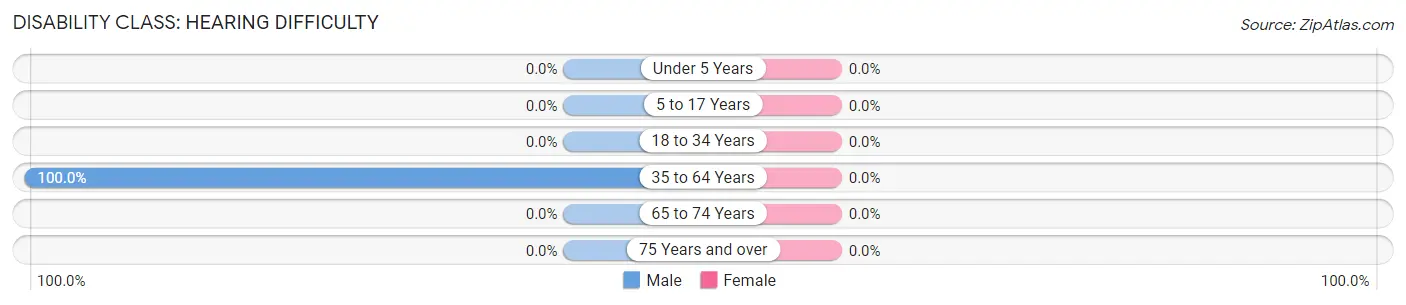
| Age Bracket | Male | Female |
| Under 5 Years | 0 (0.0%) | 0 (0.0%) |
| 5 to 17 Years | 0 (0.0%) | 0 (0.0%) |
| 18 to 34 Years | 0 (0.0%) | 0 (0.0%) |
| 35 to 64 Years | 2 (100.0%) | 0 (0.0%) |
| 65 to 74 Years | 0 (0.0%) | 0 (0.0%) |
| 75 Years and over | 0 (0.0%) | 0 (0.0%) |
Disability Class: Vision Difficulty
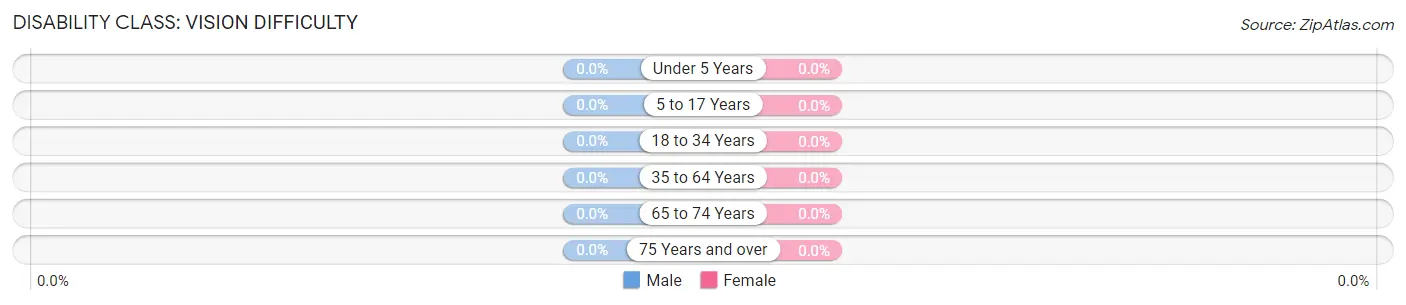
| Age Bracket | Male | Female |
| Under 5 Years | 0 (0.0%) | 0 (0.0%) |
| 5 to 17 Years | 0 (0.0%) | 0 (0.0%) |
| 18 to 34 Years | 0 (0.0%) | 0 (0.0%) |
| 35 to 64 Years | 0 (0.0%) | 0 (0.0%) |
| 65 to 74 Years | 0 (0.0%) | 0 (0.0%) |
| 75 Years and over | 0 (0.0%) | 0 (0.0%) |
Disability Class: Cognitive Difficulty
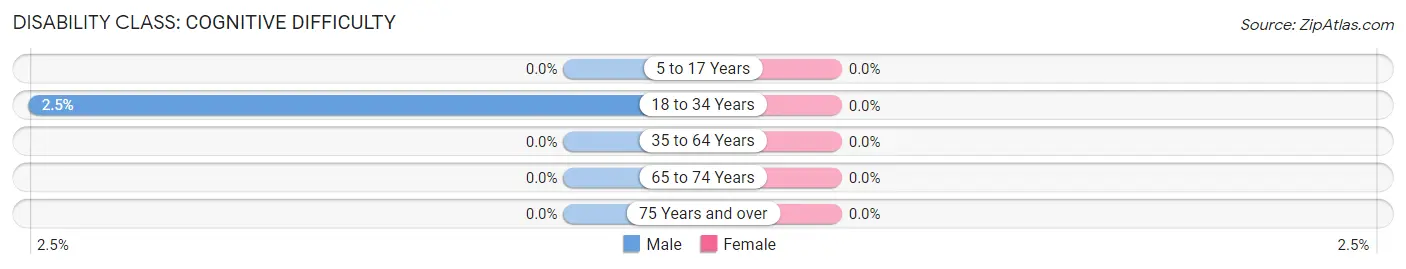
| Age Bracket | Male | Female |
| 5 to 17 Years | 0 (0.0%) | 0 (0.0%) |
| 18 to 34 Years | 3 (2.5%) | 0 (0.0%) |
| 35 to 64 Years | 0 (0.0%) | 0 (0.0%) |
| 65 to 74 Years | 0 (0.0%) | 0 (0.0%) |
| 75 Years and over | 0 (0.0%) | 0 (0.0%) |
Disability Class: Ambulatory Difficulty
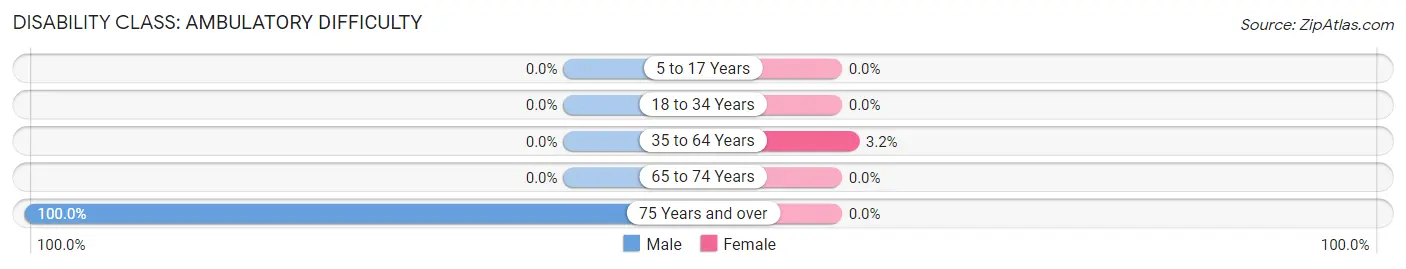
| Age Bracket | Male | Female |
| 5 to 17 Years | 0 (0.0%) | 0 (0.0%) |
| 18 to 34 Years | 0 (0.0%) | 0 (0.0%) |
| 35 to 64 Years | 0 (0.0%) | 3 (3.2%) |
| 65 to 74 Years | 0 (0.0%) | 0 (0.0%) |
| 75 Years and over | 22 (100.0%) | 0 (0.0%) |
Disability Class: Self-Care Difficulty
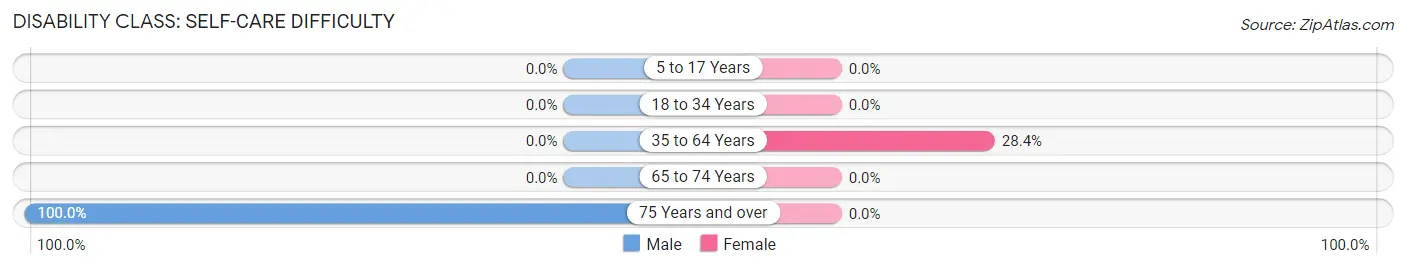
| Age Bracket | Male | Female |
| 5 to 17 Years | 0 (0.0%) | 0 (0.0%) |
| 18 to 34 Years | 0 (0.0%) | 0 (0.0%) |
| 35 to 64 Years | 0 (0.0%) | 27 (28.4%) |
| 65 to 74 Years | 0 (0.0%) | 0 (0.0%) |
| 75 Years and over | 22 (100.0%) | 0 (0.0%) |
Technology Access in Newell
Computing Device Access in Newell
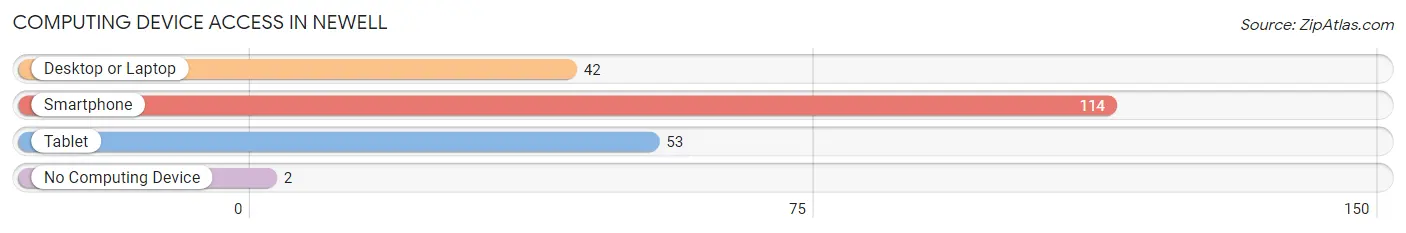
| Device Type | # Households | % Households |
| Desktop or Laptop | 42 | 36.2% |
| Smartphone | 114 | 98.3% |
| Tablet | 53 | 45.7% |
| No Computing Device | 2 | 1.7% |
| Total | 116 | 100.0% |
Internet Access in Newell
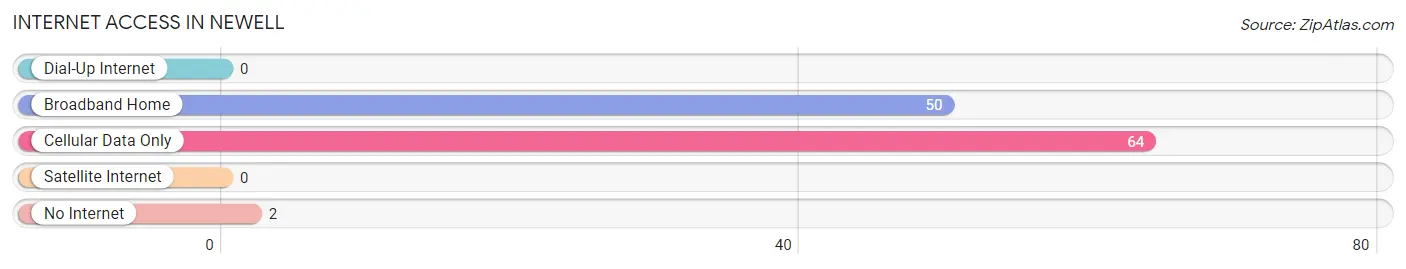
| Internet Type | # Households | % Households |
| Dial-Up Internet | 0 | 0.0% |
| Broadband Home | 50 | 43.1% |
| Cellular Data Only | 64 | 55.2% |
| Satellite Internet | 0 | 0.0% |
| No Internet | 2 | 1.7% |
| Total | 116 | 100.0% |
Newell Summary
Newell is a small unincorporated community located in the San Joaquin Valley of California, in the United States. It is situated in the western part of Fresno County, approximately 10 miles south of the city of Fresno. The population of Newell was estimated to be around 1,000 in 2020.
History
Newell was founded in 1891 by William Newell, a rancher from the Midwest. He purchased a large tract of land in the area and began to develop it for agricultural purposes. The town was named after him and was incorporated in 1895.
The town grew slowly but steadily over the years, and by the early 1900s, it had become a thriving agricultural community. The main crops grown in the area were cotton, wheat, and barley. In addition, the town was home to several small businesses, including a general store, a blacksmith shop, and a post office.
In the 1920s, the town began to experience a decline in population as many of its residents moved away to larger cities in search of better job opportunities. This trend continued until the 1950s, when the population began to slowly increase again.
Geography
Newell is located in the western part of Fresno County, in the San Joaquin Valley of California. It is situated at an elevation of approximately 200 feet above sea level. The town is surrounded by rolling hills and is located near the Kings River.
The climate in Newell is semi-arid, with hot summers and mild winters. The average annual temperature is around 70 degrees Fahrenheit. The average annual precipitation is around 10 inches.
Economy
The economy of Newell is largely based on agriculture. The main crops grown in the area are cotton, wheat, and barley. In addition, the town is home to several small businesses, including a general store, a blacksmith shop, and a post office.
The town also has a few small manufacturing companies, which produce a variety of products, including furniture, clothing, and electronics.
Demographics
As of 2020, the population of Newell was estimated to be around 1,000. The racial makeup of the town is predominantly white, with a small percentage of African Americans, Hispanics, and Asians. The median household income in Newell is around $50,000. The median age of the population is around 40 years old.
The town has a small but vibrant community, with a variety of churches, schools, and other organizations. The town also has a few parks and recreational areas, including a public swimming pool and a skate park.
Newell is a small but vibrant community, with a rich history and a diverse population. It is a great place to live and work, and it offers a variety of opportunities for those who are looking for a place to call home.
Common Questions
What is Per Capita Income in Newell?
Per Capita income in Newell is $17,377.
What is the Median Family Income in Newell?
Median Family Income in Newell is $34,659.
What is the Median Household income in Newell?
Median Household Income in Newell is $32,955.
What is Income or Wage Gap in Newell?
Income or Wage Gap in Newell is 56.2%.
Women in Newell earn 43.8 cents for every dollar earned by a man.
What is Inequality or Gini Index in Newell?
Inequality or Gini Index in Newell is 0.38.
What is the Total Population of Newell?
Total Population of Newell is 431.
What is the Total Male Population of Newell?
Total Male Population of Newell is 227.
What is the Total Female Population of Newell?
Total Female Population of Newell is 204.
What is the Ratio of Males per 100 Females in Newell?
There are 111.27 Males per 100 Females in Newell.
What is the Ratio of Females per 100 Males in Newell?
There are 89.87 Females per 100 Males in Newell.
What is the Median Population Age in Newell?
Median Population Age in Newell is 26.7 Years.
What is the Average Family Size in Newell
Average Family Size in Newell is 4.0 People.
What is the Average Household Size in Newell
Average Household Size in Newell is 3.3 People.
How Large is the Labor Force in Newell?
There are 193 People in the Labor Forcein in Newell.
What is the Percentage of People in the Labor Force in Newell?
67.7% of People are in the Labor Force in Newell.