Cities with the Highest Percentage of Population Employed in Construction & Extraction in Montana
RELATED REPORTS & OPTIONS
Construction & Extraction
Montana
Compare Cities
Map of Cities with the Highest Percentage of Population Employed in Construction & Extraction in Montana
0.0%
100.0%
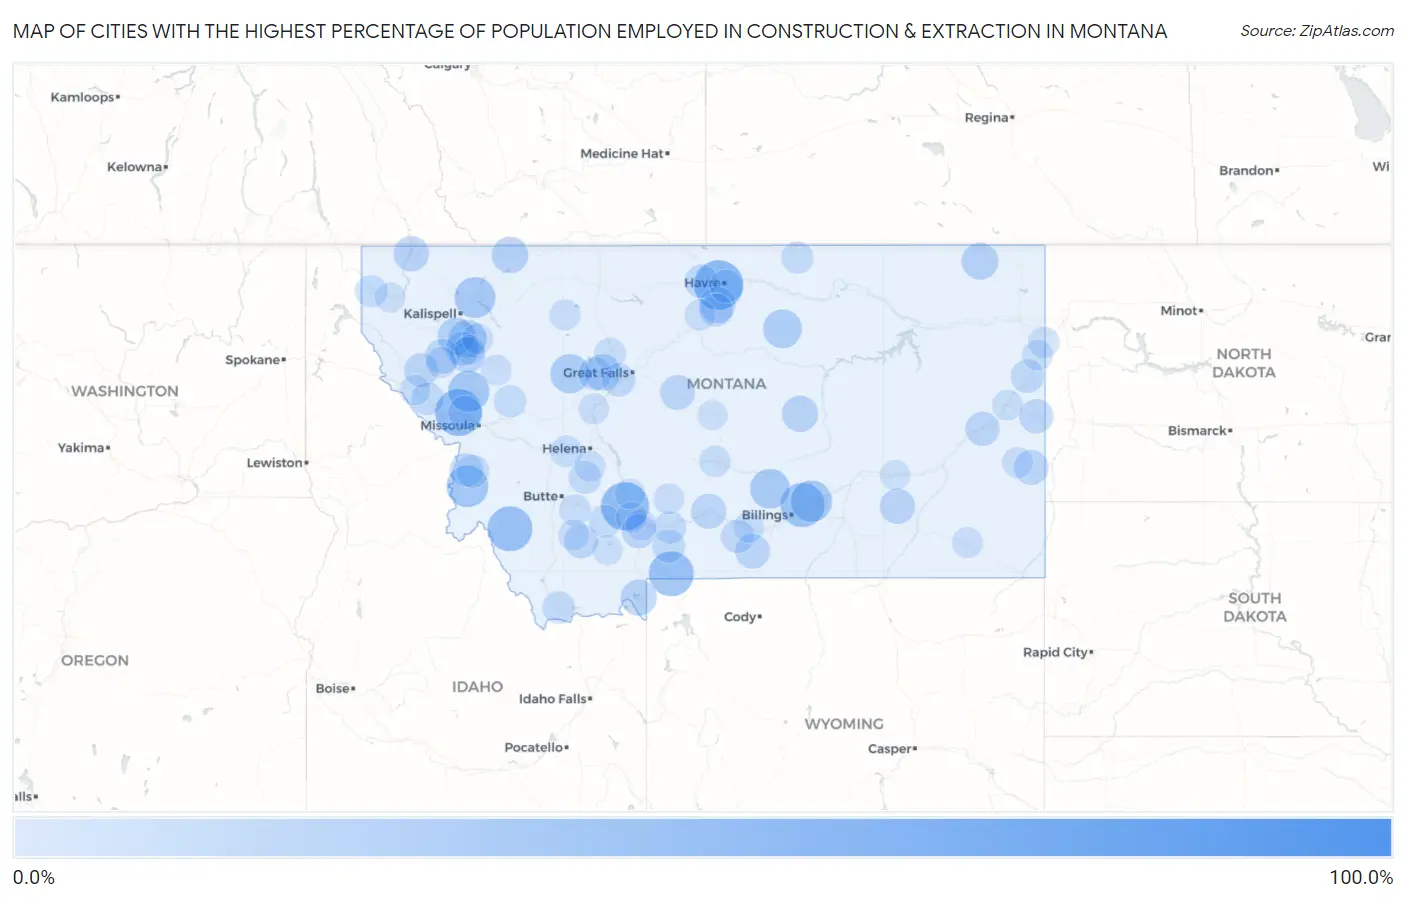
Cities with the Highest Percentage of Population Employed in Construction & Extraction in Montana
| City | % Employed | vs State | vs National | |
| 1. | Twin Hills Colony | 100.0% | 6.7% (+93.3)#1 | 5.0% (+95.0)#27 |
| 2. | Herron | 55.6% | 6.7% (+48.8)#2 | 5.0% (+50.6)#123 |
| 3. | Logan | 52.3% | 6.7% (+45.6)#3 | 5.0% (+47.3)#144 |
| 4. | Huson | 50.0% | 6.7% (+43.3)#4 | 5.0% (+45.0)#172 |
| 5. | Silver Star | 50.0% | 6.7% (+43.3)#5 | 5.0% (+45.0)#173 |
| 6. | Lindsay | 50.0% | 6.7% (+43.3)#6 | 5.0% (+45.0)#186 |
| 7. | Wisdom | 45.3% | 6.7% (+38.6)#7 | 5.0% (+40.3)#216 |
| 8. | Jardine | 45.2% | 6.7% (+38.4)#8 | 5.0% (+40.2)#218 |
| 9. | Huntley | 43.4% | 6.7% (+36.7)#9 | 5.0% (+38.4)#234 |
| 10. | Rhodes | 43.4% | 6.7% (+36.7)#10 | 5.0% (+38.4)#236 |
| 11. | Nye | 40.6% | 6.7% (+33.9)#11 | 5.0% (+35.6)#268 |
| 12. | Charlos Heights | 37.9% | 6.7% (+31.2)#12 | 5.0% (+32.9)#315 |
| 13. | Ballantine | 37.4% | 6.7% (+30.7)#13 | 5.0% (+32.4)#326 |
| 14. | Twin Creeks | 37.1% | 6.7% (+30.4)#14 | 5.0% (+32.1)#337 |
| 15. | Ravalli | 36.7% | 6.7% (+30.0)#15 | 5.0% (+31.7)#346 |
| 16. | Hungry Horse | 36.0% | 6.7% (+29.3)#16 | 5.0% (+31.0)#362 |
| 17. | Broadview | 33.3% | 6.7% (+26.6)#17 | 5.0% (+28.3)#414 |
| 18. | Glen | 32.4% | 6.7% (+25.6)#18 | 5.0% (+27.4)#461 |
| 19. | Augusta | 32.1% | 6.7% (+25.4)#19 | 5.0% (+27.1)#474 |
| 20. | Hays | 31.1% | 6.7% (+24.4)#20 | 5.0% (+26.1)#500 |
| 21. | Hall | 30.8% | 6.7% (+24.1)#21 | 5.0% (+25.8)#512 |
| 22. | Rollins | 28.9% | 6.7% (+22.2)#22 | 5.0% (+24.0)#591 |
| 23. | Lake Mary Ronan | 27.8% | 6.7% (+21.1)#23 | 5.0% (+22.8)#658 |
| 24. | Flaxville | 26.9% | 6.7% (+20.2)#24 | 5.0% (+21.9)#719 |
| 25. | Rapelje | 26.8% | 6.7% (+20.1)#25 | 5.0% (+21.8)#724 |
| 26. | Babb | 26.2% | 6.7% (+19.5)#26 | 5.0% (+21.2)#760 |
| 27. | Fort Shaw | 25.8% | 6.7% (+19.1)#27 | 5.0% (+20.8)#780 |
| 28. | Winnett | 25.5% | 6.7% (+18.8)#28 | 5.0% (+20.5)#798 |
| 29. | Azure | 25.3% | 6.7% (+18.6)#29 | 5.0% (+20.3)#810 |
| 30. | Fishtail | 25.0% | 6.7% (+18.3)#30 | 5.0% (+20.0)#834 |
| 31. | Hebgen Lake Estates | 25.0% | 6.7% (+18.3)#31 | 5.0% (+20.0)#836 |
| 32. | Pleasant Valley Colony | 25.0% | 6.7% (+18.3)#32 | 5.0% (+20.0)#844 |
| 33. | Jette | 23.7% | 6.7% (+17.0)#33 | 5.0% (+18.7)#946 |
| 34. | Rexford | 23.5% | 6.7% (+16.8)#34 | 5.0% (+18.5)#961 |
| 35. | Colstrip | 23.4% | 6.7% (+16.7)#35 | 5.0% (+18.4)#975 |
| 36. | Big Timber | 22.9% | 6.7% (+16.2)#36 | 5.0% (+17.9)#1,022 |
| 37. | Geyser | 22.9% | 6.7% (+16.1)#37 | 5.0% (+17.9)#1,031 |
| 38. | Roberts | 22.4% | 6.7% (+15.7)#38 | 5.0% (+17.4)#1,080 |
| 39. | Baker | 22.3% | 6.7% (+15.6)#39 | 5.0% (+17.3)#1,086 |
| 40. | Lonepine | 22.2% | 6.7% (+15.5)#40 | 5.0% (+17.2)#1,100 |
| 41. | Windham | 22.2% | 6.7% (+15.5)#41 | 5.0% (+17.2)#1,114 |
| 42. | Zurich | 21.7% | 6.7% (+15.0)#42 | 5.0% (+16.7)#1,162 |
| 43. | Rimrock Colony | 21.3% | 6.7% (+14.6)#43 | 5.0% (+16.3)#1,207 |
| 44. | Wibaux | 21.3% | 6.7% (+14.6)#44 | 5.0% (+16.3)#1,208 |
| 45. | Big Arm | 21.1% | 6.7% (+14.3)#45 | 5.0% (+16.1)#1,231 |
| 46. | Weeksville | 21.1% | 6.7% (+14.3)#46 | 5.0% (+16.1)#1,235 |
| 47. | Fallon | 20.9% | 6.7% (+14.2)#47 | 5.0% (+15.9)#1,254 |
| 48. | Sheridan | 20.6% | 6.7% (+13.9)#48 | 5.0% (+15.6)#1,291 |
| 49. | Gallatin Gateway | 20.5% | 6.7% (+13.8)#49 | 5.0% (+15.6)#1,306 |
| 50. | Nibbe | 20.0% | 6.7% (+13.3)#50 | 5.0% (+15.0)#1,365 |
| 51. | Jackson | 20.0% | 6.7% (+13.3)#51 | 5.0% (+15.0)#1,379 |
| 52. | Frenchtown | 19.9% | 6.7% (+13.2)#52 | 5.0% (+14.9)#1,388 |
| 53. | Pinesdale | 19.8% | 6.7% (+13.1)#53 | 5.0% (+14.8)#1,403 |
| 54. | Simms | 19.4% | 6.7% (+12.7)#54 | 5.0% (+14.4)#1,470 |
| 55. | Savage | 19.3% | 6.7% (+12.6)#55 | 5.0% (+14.3)#1,489 |
| 56. | Kremlin | 19.2% | 6.7% (+12.5)#56 | 5.0% (+14.2)#1,501 |
| 57. | Absarokee | 19.2% | 6.7% (+12.5)#57 | 5.0% (+14.2)#1,506 |
| 58. | Norris | 19.0% | 6.7% (+12.3)#58 | 5.0% (+14.1)#1,530 |
| 59. | Ulm | 19.0% | 6.7% (+12.3)#59 | 5.0% (+14.0)#1,539 |
| 60. | Saddle Butte | 18.8% | 6.7% (+12.1)#60 | 5.0% (+13.8)#1,569 |
| 61. | St Pierre | 18.8% | 6.7% (+12.0)#61 | 5.0% (+13.8)#1,581 |
| 62. | Corvallis | 18.4% | 6.7% (+11.7)#62 | 5.0% (+13.4)#1,649 |
| 63. | Pray | 18.1% | 6.7% (+11.4)#63 | 5.0% (+13.1)#1,725 |
| 64. | Superior | 17.8% | 6.7% (+11.1)#64 | 5.0% (+12.8)#1,794 |
| 65. | Boulder | 17.7% | 6.7% (+11.0)#65 | 5.0% (+12.7)#1,811 |
| 66. | Lima | 17.6% | 6.7% (+10.9)#66 | 5.0% (+12.6)#1,828 |
| 67. | Raynesford | 17.2% | 6.7% (+10.5)#67 | 5.0% (+12.2)#1,901 |
| 68. | Wineglass | 17.2% | 6.7% (+10.5)#68 | 5.0% (+12.2)#1,913 |
| 69. | Harrison | 17.1% | 6.7% (+10.4)#69 | 5.0% (+12.1)#1,929 |
| 70. | Seeley Lake | 16.8% | 6.7% (+10.1)#70 | 5.0% (+11.9)#1,988 |
| 71. | Troy | 16.7% | 6.7% (+9.95)#71 | 5.0% (+11.7)#2,033 |
| 72. | Turner | 16.7% | 6.7% (+9.95)#72 | 5.0% (+11.7)#2,060 |
| 73. | Elliston | 16.1% | 6.7% (+9.42)#73 | 5.0% (+11.1)#2,197 |
| 74. | Power | 15.6% | 6.7% (+8.91)#74 | 5.0% (+10.6)#2,345 |
| 75. | Rader Creek | 15.4% | 6.7% (+8.67)#75 | 5.0% (+10.4)#2,404 |
| 76. | Camas | 14.3% | 6.7% (+7.57)#76 | 5.0% (+9.29)#2,829 |
| 77. | Fairview | 14.3% | 6.7% (+7.54)#77 | 5.0% (+9.26)#2,836 |
| 78. | Harlowton | 14.2% | 6.7% (+7.53)#78 | 5.0% (+9.25)#2,837 |
| 79. | Big Sandy | 14.2% | 6.7% (+7.49)#79 | 5.0% (+9.20)#2,851 |
| 80. | King Arthur Park | 14.1% | 6.7% (+7.39)#80 | 5.0% (+9.11)#2,885 |
| 81. | Plevna | 14.0% | 6.7% (+7.32)#81 | 5.0% (+9.04)#2,910 |
| 82. | Dupuyer | 14.0% | 6.7% (+7.29)#82 | 5.0% (+9.01)#2,928 |
| 83. | Churchill | 13.9% | 6.7% (+7.23)#83 | 5.0% (+8.95)#2,946 |
| 84. | Jefferson City | 13.8% | 6.7% (+7.06)#84 | 5.0% (+8.78)#3,027 |
| 85. | Condon | 13.6% | 6.7% (+6.92)#85 | 5.0% (+8.64)#3,083 |
| 86. | Broadus | 13.6% | 6.7% (+6.87)#86 | 5.0% (+8.59)#3,100 |
| 87. | Bear Dance | 13.6% | 6.7% (+6.87)#87 | 5.0% (+8.59)#3,103 |
| 88. | Columbus | 13.5% | 6.7% (+6.83)#88 | 5.0% (+8.55)#3,127 |
| 89. | Twin Bridges | 13.4% | 6.7% (+6.72)#89 | 5.0% (+8.44)#3,177 |
| 90. | Sidney | 13.4% | 6.7% (+6.71)#90 | 5.0% (+8.43)#3,183 |
| 91. | Wilsall | 13.2% | 6.7% (+6.52)#91 | 5.0% (+8.24)#3,268 |
| 92. | Glendive | 13.2% | 6.7% (+6.50)#92 | 5.0% (+8.22)#3,275 |
| 93. | St Regis | 13.1% | 6.7% (+6.37)#93 | 5.0% (+8.09)#3,343 |
| 94. | Craig | 13.0% | 6.7% (+6.33)#94 | 5.0% (+8.05)#3,373 |
| 95. | Ponderosa Pines | 12.7% | 6.7% (+5.97)#95 | 5.0% (+7.69)#3,543 |
| 96. | Libby | 12.6% | 6.7% (+5.88)#96 | 5.0% (+7.59)#3,581 |
| 97. | Forsyth | 12.4% | 6.7% (+5.68)#97 | 5.0% (+7.40)#3,700 |
| 98. | Hobson | 12.1% | 6.7% (+5.41)#98 | 5.0% (+7.13)#3,856 |
| 99. | Kings Point | 12.0% | 6.7% (+5.34)#99 | 5.0% (+7.05)#3,893 |
| 100. | Ennis | 12.0% | 6.7% (+5.32)#100 | 5.0% (+7.04)#3,901 |
Common Questions
What are the Top 10 Cities with the Highest Percentage of Population Employed in Construction & Extraction in Montana?
Top 10 Cities with the Highest Percentage of Population Employed in Construction & Extraction in Montana are:
#1
55.6%
#2
52.3%
#3
50.0%
#4
45.3%
#5
45.2%
#6
43.4%
#7
37.9%
#8
37.4%
#9
36.7%
#10
36.0%
What city has the Highest Percentage of Population Employed in Construction & Extraction in Montana?
Herron has the Highest Percentage of Population Employed in Construction & Extraction in Montana with 55.6%.
What is the Percentage of Population Employed in Construction & Extraction in the State of Montana?
Percentage of Population Employed in Construction & Extraction in Montana is 6.7%.
What is the Percentage of Population Employed in Construction & Extraction in the United States?
Percentage of Population Employed in Construction & Extraction in the United States is 5.0%.