Cities with the Highest Percentage of Population Employed in Construction & Extraction in Connecticut
RELATED REPORTS & OPTIONS
Construction & Extraction
Connecticut
Compare Cities
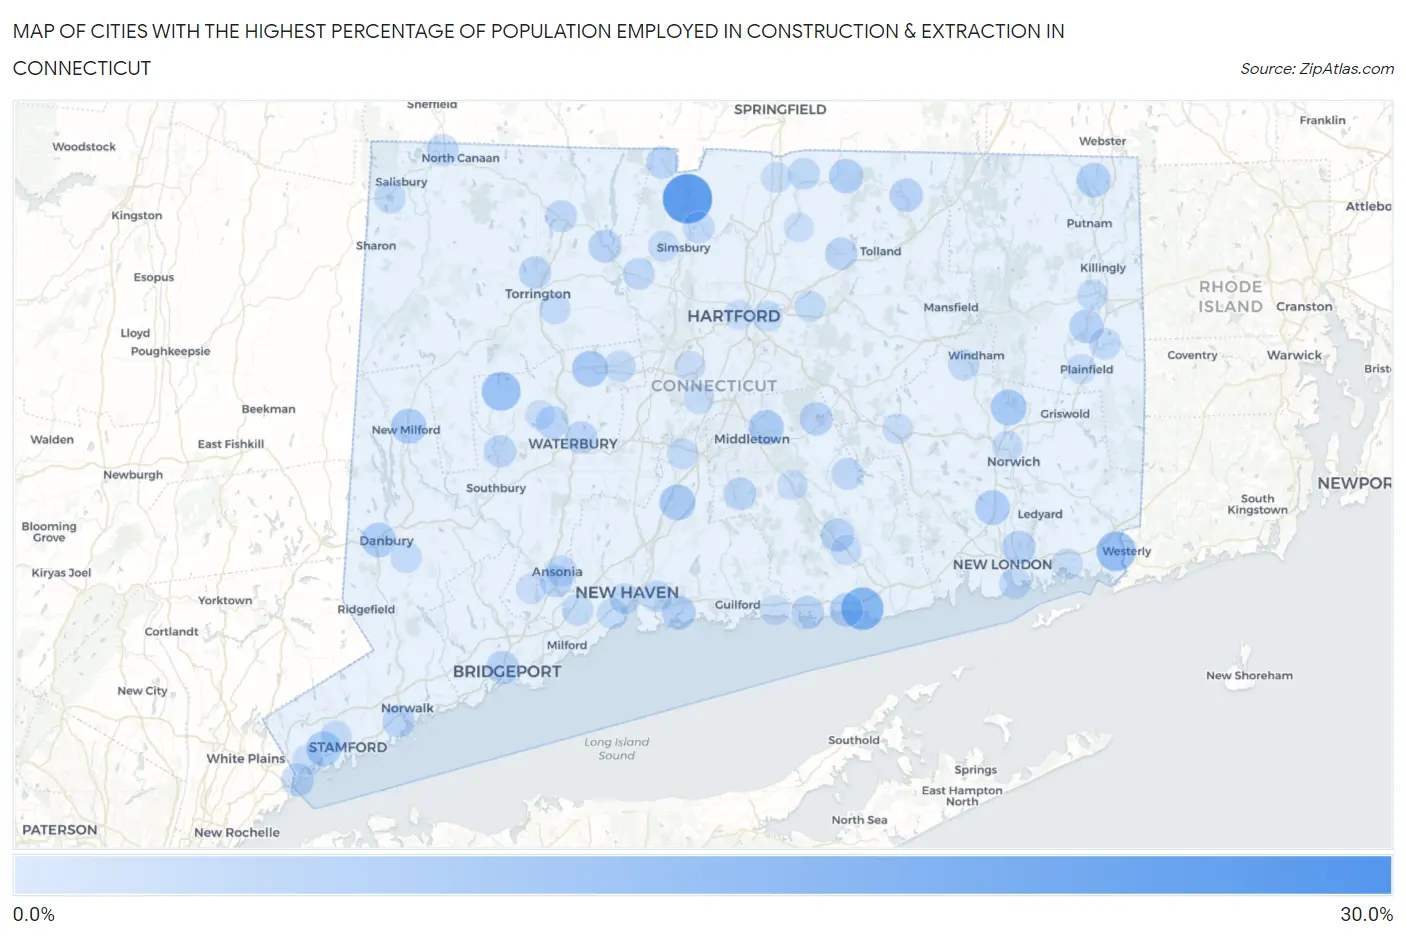
Map of Cities with the Highest Percentage of Population Employed in Construction & Extraction in Connecticut
0.0%
30.0%
Cities with the Highest Percentage of Population Employed in Construction & Extraction in Connecticut
| City | % Employed | vs State | vs National | |
| 1. | Branchville | 26.1% | 4.4%(+21.7)#1 | 5.0%(+21.1)#767 |
| 2. | Redding Center | 24.8% | 4.4%(+20.3)#2 | 5.0%(+19.8)#861 |
| 3. | Salmon Brook | 22.5% | 4.4%(+18.1)#3 | 5.0%(+17.5)#1,060 |
| 4. | Ball Pond | 16.6% | 4.4%(+12.2)#4 | 5.0%(+11.6)#2,076 |
| 5. | Inglenook | 15.9% | 4.4%(+11.5)#5 | 5.0%(+10.9)#2,275 |
| 6. | Saybrook Manor | 15.4% | 4.4%(+10.9)#6 | 5.0%(+10.4)#2,427 |
| 7. | Mechanicsville | 14.6% | 4.4%(+10.1)#7 | 5.0%(+9.57)#2,720 |
| 8. | Taylor Corners | 12.9% | 4.4%(+8.50)#8 | 5.0%(+7.94)#3,419 |
| 9. | Pawcatuck | 12.6% | 4.4%(+8.14)#9 | 5.0%(+7.58)#3,591 |
| 10. | Bethlehem Village | 11.9% | 4.4%(+7.48)#10 | 5.0%(+6.91)#3,983 |
| 11. | Stratford Downtown | 10.4% | 4.4%(+5.95)#11 | 5.0%(+5.39)#5,167 |
| 12. | Candlewood Orchards | 9.6% | 4.4%(+5.20)#12 | 5.0%(+4.64)#5,923 |
| 13. | Wallingford Center | 9.2% | 4.4%(+4.73)#13 | 5.0%(+4.17)#6,443 |
| 14. | Terryville | 9.1% | 4.4%(+4.69)#14 | 5.0%(+4.13)#6,487 |
| 15. | Baltic | 9.0% | 4.4%(+4.61)#15 | 5.0%(+4.05)#6,605 |
| 16. | Groton Long Point Borough | 8.6% | 4.4%(+4.16)#16 | 5.0%(+3.60)#7,172 |
| 17. | Portland | 8.6% | 4.4%(+4.12)#17 | 5.0%(+3.56)#7,249 |
| 18. | New Milford | 8.4% | 4.4%(+4.01)#18 | 5.0%(+3.45)#7,396 |
| 19. | Cos Cob | 8.4% | 4.4%(+3.94)#19 | 5.0%(+3.38)#7,482 |
| 20. | Quasset Lake | 8.3% | 4.4%(+3.84)#20 | 5.0%(+3.28)#7,634 |
| 21. | Danbury | 8.0% | 4.4%(+3.58)#21 | 5.0%(+3.02)#8,036 |
| 22. | Oxoboxo River | 8.0% | 4.4%(+3.57)#22 | 5.0%(+3.01)#8,048 |
| 23. | Jewett City Borough | 7.9% | 4.4%(+3.48)#23 | 5.0%(+2.92)#8,183 |
| 24. | North Grosvenor Dale | 7.7% | 4.4%(+3.23)#24 | 5.0%(+2.67)#8,610 |
| 25. | Somers | 7.6% | 4.4%(+3.20)#25 | 5.0%(+2.64)#8,658 |
| 26. | Branford Center | 7.5% | 4.4%(+3.06)#26 | 5.0%(+2.50)#8,892 |
| 27. | Westbrook Center | 7.0% | 4.4%(+2.56)#27 | 5.0%(+2.00)#9,788 |
| 28. | Wauregan | 7.0% | 4.4%(+2.55)#28 | 5.0%(+1.99)#9,798 |
| 29. | Conning Towers Nautilus Park | 7.0% | 4.4%(+2.53)#29 | 5.0%(+1.97)#9,836 |
| 30. | Chester Center | 6.9% | 4.4%(+2.46)#30 | 5.0%(+1.90)#9,972 |
| 31. | Stafford Springs | 6.8% | 4.4%(+2.41)#31 | 5.0%(+1.85)#10,065 |
| 32. | Lake Pocotopaug | 6.8% | 4.4%(+2.39)#32 | 5.0%(+1.83)#10,093 |
| 33. | Bridgeport | 6.7% | 4.4%(+2.28)#33 | 5.0%(+1.72)#10,298 |
| 34. | Clinton | 6.6% | 4.4%(+2.18)#34 | 5.0%(+1.62)#10,512 |
| 35. | New Hartford Center | 6.5% | 4.4%(+2.10)#35 | 5.0%(+1.54)#10,687 |
| 36. | Byram | 6.4% | 4.4%(+1.96)#36 | 5.0%(+1.40)#10,992 |
| 37. | Lake Bungee | 6.3% | 4.4%(+1.91)#37 | 5.0%(+1.35)#11,098 |
| 38. | West Mountain | 6.2% | 4.4%(+1.79)#38 | 5.0%(+1.23)#11,371 |
| 39. | Durham | 6.2% | 4.4%(+1.78)#39 | 5.0%(+1.22)#11,390 |
| 40. | North Granby | 6.2% | 4.4%(+1.72)#40 | 5.0%(+1.16)#11,520 |
| 41. | Norwalk | 6.1% | 4.4%(+1.62)#41 | 5.0%(+1.06)#11,742 |
| 42. | Oakville | 6.0% | 4.4%(+1.60)#42 | 5.0%(+1.04)#11,787 |
| 43. | Waterbury | 5.9% | 4.4%(+1.51)#43 | 5.0%(+0.953)#11,997 |
| 44. | Derby | 5.9% | 4.4%(+1.49)#44 | 5.0%(+0.929)#12,038 |
| 45. | Woodbury Center | 5.9% | 4.4%(+1.48)#45 | 5.0%(+0.915)#12,073 |
| 46. | Rockville | 5.9% | 4.4%(+1.46)#46 | 5.0%(+0.896)#12,112 |
| 47. | Torrington | 5.8% | 4.4%(+1.37)#47 | 5.0%(+0.812)#12,321 |
| 48. | Lakes East | 5.7% | 4.4%(+1.30)#48 | 5.0%(+0.738)#12,506 |
| 49. | Stepney | 5.7% | 4.4%(+1.22)#49 | 5.0%(+0.664)#12,677 |
| 50. | Canaan | 5.6% | 4.4%(+1.19)#50 | 5.0%(+0.626)#12,789 |
| 51. | Winsted | 5.4% | 4.4%(+0.937)#51 | 5.0%(+0.376)#13,392 |
| 52. | Canton Valley | 5.3% | 4.4%(+0.908)#52 | 5.0%(+0.347)#13,454 |
| 53. | Hazardville | 5.3% | 4.4%(+0.876)#53 | 5.0%(+0.315)#13,540 |
| 54. | Moodus | 5.3% | 4.4%(+0.867)#54 | 5.0%(+0.306)#13,564 |
| 55. | Plattsville | 5.3% | 4.4%(+0.844)#55 | 5.0%(+0.283)#13,615 |
| 56. | Ansonia | 5.3% | 4.4%(+0.837)#56 | 5.0%(+0.276)#13,630 |
| 57. | Tariffville | 5.3% | 4.4%(+0.825)#57 | 5.0%(+0.264)#13,666 |
| 58. | Lakeville | 5.2% | 4.4%(+0.746)#58 | 5.0%(+0.185)#13,848 |
| 59. | Weston | 5.2% | 4.4%(+0.724)#59 | 5.0%(+0.163)#13,901 |
| 60. | Bristol | 5.1% | 4.4%(+0.713)#60 | 5.0%(+0.152)#13,930 |
| 61. | Groton | 5.1% | 4.4%(+0.672)#61 | 5.0%(+0.111)#14,036 |
| 62. | East Haven | 5.1% | 4.4%(+0.664)#62 | 5.0%(+0.103)#14,073 |
| 63. | Sandy Hook | 5.1% | 4.4%(+0.662)#63 | 5.0%(+0.101)#14,078 |
| 64. | Moosup | 5.0% | 4.4%(+0.602)#64 | 5.0%(+0.041)#14,246 |
| 65. | Orange | 5.0% | 4.4%(+0.566)#65 | 5.0%(+0.005)#14,346 |
| 66. | Indian Field | 4.9% | 4.4%(+0.493)#66 | 5.0%(-0.068)#14,524 |
| 67. | Stamford | 4.8% | 4.4%(+0.389)#67 | 5.0%(-0.172)#14,791 |
| 68. | Meriden | 4.8% | 4.4%(+0.363)#68 | 5.0%(-0.198)#14,859 |
| 69. | Northwest Harwinton | 4.8% | 4.4%(+0.355)#69 | 5.0%(-0.206)#14,883 |
| 70. | West Haven | 4.8% | 4.4%(+0.344)#70 | 5.0%(-0.217)#14,909 |
| 71. | Bethel | 4.7% | 4.4%(+0.218)#71 | 5.0%(-0.342)#15,249 |
| 72. | East Brooklyn | 4.6% | 4.4%(+0.208)#72 | 5.0%(-0.353)#15,284 |
| 73. | South Windham | 4.6% | 4.4%(+0.204)#73 | 5.0%(-0.357)#15,298 |
| 74. | Bantam Borough | 4.6% | 4.4%(+0.191)#74 | 5.0%(-0.370)#15,341 |
| 75. | Tashua | 4.6% | 4.4%(+0.174)#75 | 5.0%(-0.387)#15,401 |
| 76. | Manchester | 4.6% | 4.4%(+0.161)#76 | 5.0%(-0.400)#15,436 |
| 77. | New Haven | 4.6% | 4.4%(+0.145)#77 | 5.0%(-0.415)#15,467 |
| 78. | Northford | 4.5% | 4.4%(+0.103)#78 | 5.0%(-0.458)#15,605 |
| 79. | West Simsbury | 4.5% | 4.4%(+0.060)#79 | 5.0%(-0.501)#15,704 |
| 80. | East Hartford | 4.4% | 4.4%(-0.025)#80 | 5.0%(-0.586)#15,935 |
| 81. | Naugatuck Borough | 4.4% | 4.4%(-0.044)#81 | 5.0%(-0.605)#15,987 |
| 82. | Newtown Borough | 4.3% | 4.4%(-0.110)#82 | 5.0%(-0.671)#16,186 |
| 83. | Mystic | 4.3% | 4.4%(-0.138)#83 | 5.0%(-0.699)#16,255 |
| 84. | Norwich | 4.3% | 4.4%(-0.138)#84 | 5.0%(-0.699)#16,258 |
| 85. | Kensington | 4.3% | 4.4%(-0.146)#85 | 5.0%(-0.707)#16,283 |
| 86. | Colchester | 4.2% | 4.4%(-0.262)#86 | 5.0%(-0.823)#16,630 |
| 87. | New Britain | 4.2% | 4.4%(-0.283)#87 | 5.0%(-0.844)#16,718 |
| 88. | Greenwich | 4.1% | 4.4%(-0.298)#88 | 5.0%(-0.859)#16,754 |
| 89. | Staples | 4.1% | 4.4%(-0.323)#89 | 5.0%(-0.884)#16,833 |
| 90. | Shelton | 4.1% | 4.4%(-0.347)#90 | 5.0%(-0.908)#16,909 |
| 91. | Cornwall Bridge | 4.1% | 4.4%(-0.351)#91 | 5.0%(-0.912)#16,929 |
| 92. | Higganum | 4.1% | 4.4%(-0.356)#92 | 5.0%(-0.917)#16,943 |
| 93. | Thompsonville | 4.1% | 4.4%(-0.381)#93 | 5.0%(-0.942)#17,033 |
| 94. | Madison Center | 4.0% | 4.4%(-0.409)#94 | 5.0%(-0.970)#17,117 |
| 95. | Deep River Center | 4.0% | 4.4%(-0.468)#95 | 5.0%(-1.03)#17,288 |
| 96. | Noroton | 4.0% | 4.4%(-0.473)#96 | 5.0%(-1.03)#17,304 |
| 97. | Plainfield Village | 3.8% | 4.4%(-0.636)#97 | 5.0%(-1.20)#17,786 |
| 98. | Hartford | 3.7% | 4.4%(-0.724)#98 | 5.0%(-1.28)#18,069 |
| 99. | Watertown | 3.6% | 4.4%(-0.820)#99 | 5.0%(-1.38)#18,340 |
| 100. | Broad Brook | 3.6% | 4.4%(-0.839)#100 | 5.0%(-1.40)#18,389 |
Common Questions
What are the Top 10 Cities with the Highest Percentage of Population Employed in Construction & Extraction in Connecticut?
Top 10 Cities with the Highest Percentage of Population Employed in Construction & Extraction in Connecticut are:
#1
22.5%
#2
15.4%
#3
12.6%
#4
11.9%
#5
9.2%
#6
9.1%
#7
9.0%
#8
8.6%
#9
8.4%
#10
8.4%
What city has the Highest Percentage of Population Employed in Construction & Extraction in Connecticut?
Salmon Brook has the Highest Percentage of Population Employed in Construction & Extraction in Connecticut with 22.5%.
What is the Percentage of Population Employed in Construction & Extraction in the State of Connecticut?
Percentage of Population Employed in Construction & Extraction in Connecticut is 4.4%.
What is the Percentage of Population Employed in Construction & Extraction in the United States?
Percentage of Population Employed in Construction & Extraction in the United States is 5.0%.