Cities with the Highest Percentage of Population Employed in Construction & Extraction in Utah
RELATED REPORTS & OPTIONS
Construction & Extraction
Utah
Compare Cities
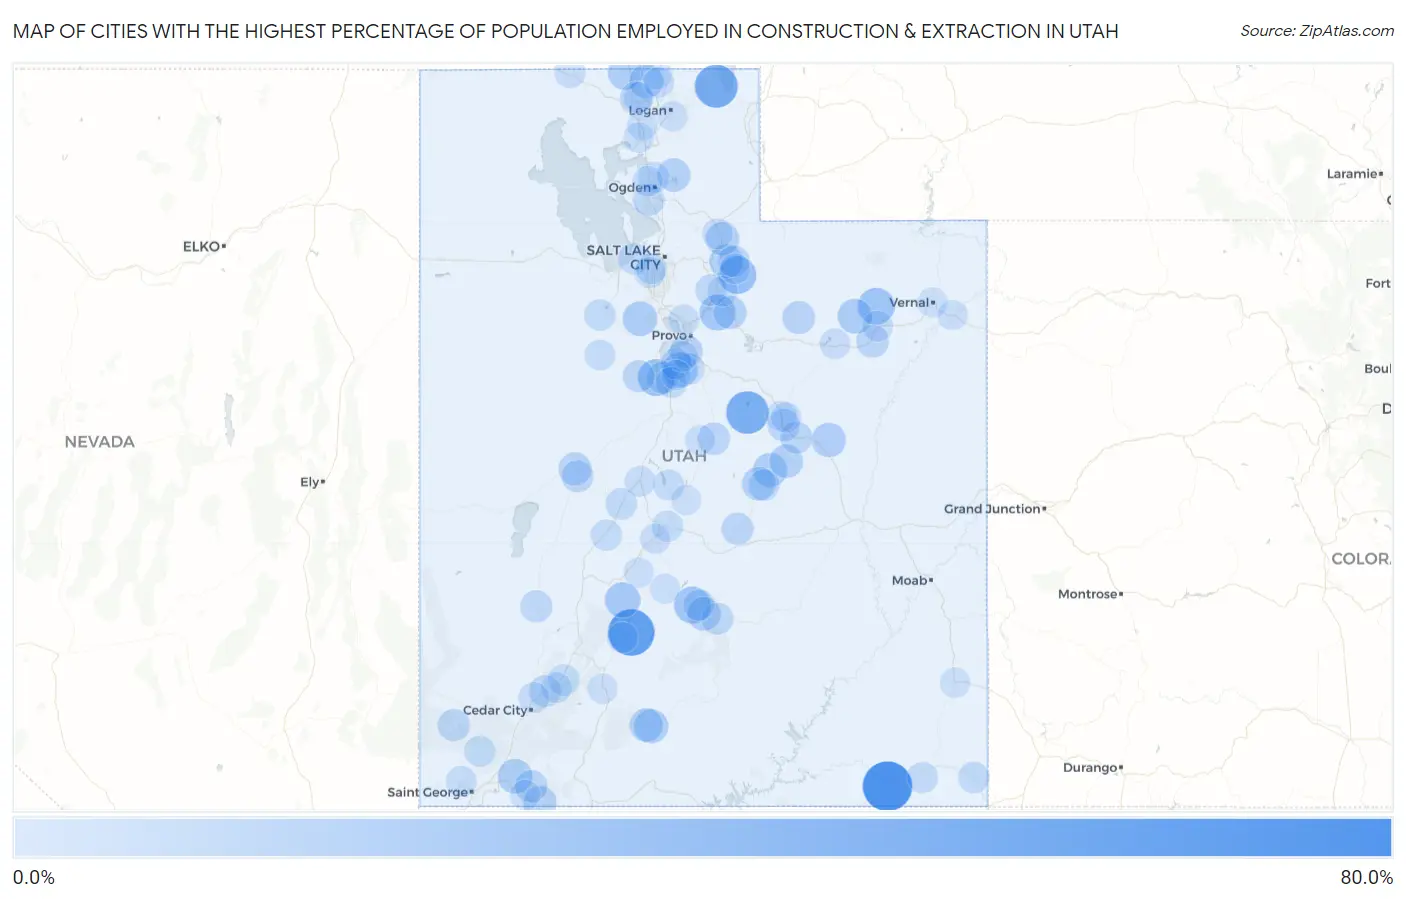
Map of Cities with the Highest Percentage of Population Employed in Construction & Extraction in Utah
0.0%
80.0%
Cities with the Highest Percentage of Population Employed in Construction & Extraction in Utah
| City | % Employed | vs State | vs National | |
| 1. | Halchita | 66.7% | 5.5%(+61.1)#1 | 5.0%(+61.7)#71 |
| 2. | Kingston | 57.0% | 5.5%(+51.5)#2 | 5.0%(+52.0)#113 |
| 3. | Garden | 46.2% | 5.5%(+40.6)#3 | 5.0%(+41.2)#207 |
| 4. | Scofield | 45.0% | 5.5%(+39.5)#4 | 5.0%(+40.0)#221 |
| 5. | Samak | 30.2% | 5.5%(+24.7)#5 | 5.0%(+25.2)#538 |
| 6. | Elberta | 28.1% | 5.5%(+22.6)#6 | 5.0%(+23.1)#636 |
| 7. | Loa | 27.8% | 5.5%(+22.3)#7 | 5.0%(+22.8)#654 |
| 8. | Neola | 27.6% | 5.5%(+22.1)#8 | 5.0%(+22.6)#666 |
| 9. | Wallsburg | 25.0% | 5.5%(+19.5)#9 | 5.0%(+20.0)#825 |
| 10. | Marysvale | 23.3% | 5.5%(+17.7)#10 | 5.0%(+18.3)#986 |
| 11. | Spring Lake | 22.7% | 5.5%(+17.2)#11 | 5.0%(+17.7)#1,050 |
| 12. | Bluebell | 21.2% | 5.5%(+15.7)#12 | 5.0%(+16.2)#1,215 |
| 13. | Cedar Fort | 21.0% | 5.5%(+15.5)#13 | 5.0%(+16.0)#1,244 |
| 14. | Portage | 20.7% | 5.5%(+15.2)#14 | 5.0%(+15.7)#1,281 |
| 15. | Virgin | 20.6% | 5.5%(+15.1)#15 | 5.0%(+15.6)#1,296 |
| 16. | East Carbon | 20.0% | 5.5%(+14.4)#16 | 5.0%(+15.0)#1,383 |
| 17. | Huntington | 19.7% | 5.5%(+14.2)#17 | 5.0%(+14.7)#1,415 |
| 18. | Henrieville | 19.3% | 5.5%(+13.8)#18 | 5.0%(+14.3)#1,487 |
| 19. | Clarkston | 18.8% | 5.5%(+13.3)#19 | 5.0%(+13.9)#1,561 |
| 20. | Peoa | 18.6% | 5.5%(+13.1)#20 | 5.0%(+13.6)#1,613 |
| 21. | Orangeville | 18.3% | 5.5%(+12.8)#21 | 5.0%(+13.3)#1,667 |
| 22. | Bicknell | 18.0% | 5.5%(+12.5)#22 | 5.0%(+13.0)#1,737 |
| 23. | Elmo | 18.0% | 5.5%(+12.5)#23 | 5.0%(+13.0)#1,738 |
| 24. | Cannonville | 18.0% | 5.5%(+12.5)#24 | 5.0%(+13.0)#1,739 |
| 25. | Hoytsville | 17.7% | 5.5%(+12.2)#25 | 5.0%(+12.7)#1,805 |
| 26. | Eden | 17.4% | 5.5%(+11.9)#26 | 5.0%(+12.4)#1,860 |
| 27. | Hildale | 17.0% | 5.5%(+11.4)#27 | 5.0%(+12.0)#1,970 |
| 28. | Independence | 16.7% | 5.5%(+11.1)#28 | 5.0%(+11.7)#2,057 |
| 29. | Hinckley | 15.8% | 5.5%(+10.3)#29 | 5.0%(+10.8)#2,285 |
| 30. | Tabiona | 15.6% | 5.5%(+10.1)#30 | 5.0%(+10.6)#2,347 |
| 31. | Palmyra | 15.6% | 5.5%(+10.0)#31 | 5.0%(+10.6)#2,363 |
| 32. | Myton | 15.2% | 5.5%(+9.72)#32 | 5.0%(+10.2)#2,464 |
| 33. | Rockville | 14.7% | 5.5%(+9.19)#33 | 5.0%(+9.71)#2,667 |
| 34. | Mount Pleasant | 14.4% | 5.5%(+8.85)#34 | 5.0%(+9.38)#2,783 |
| 35. | Goshen | 14.1% | 5.5%(+8.61)#35 | 5.0%(+9.13)#2,868 |
| 36. | Carbonville | 14.1% | 5.5%(+8.56)#36 | 5.0%(+9.09)#2,891 |
| 37. | Riverside | 14.0% | 5.5%(+8.53)#37 | 5.0%(+9.05)#2,903 |
| 38. | Enterprise | 13.8% | 5.5%(+8.25)#38 | 5.0%(+8.78)#3,026 |
| 39. | Emery | 13.7% | 5.5%(+8.20)#39 | 5.0%(+8.72)#3,046 |
| 40. | Wellington | 13.7% | 5.5%(+8.16)#40 | 5.0%(+8.68)#3,062 |
| 41. | Eureka | 13.5% | 5.5%(+7.95)#41 | 5.0%(+8.47)#3,158 |
| 42. | Deseret | 13.4% | 5.5%(+7.88)#42 | 5.0%(+8.41)#3,195 |
| 43. | Milford | 13.1% | 5.5%(+7.60)#43 | 5.0%(+8.12)#3,328 |
| 44. | Torrey | 12.8% | 5.5%(+7.27)#44 | 5.0%(+7.80)#3,494 |
| 45. | Interlaken | 12.7% | 5.5%(+7.21)#45 | 5.0%(+7.73)#3,528 |
| 46. | Summit | 12.6% | 5.5%(+7.07)#46 | 5.0%(+7.60)#3,579 |
| 47. | Oakley | 12.6% | 5.5%(+7.04)#47 | 5.0%(+7.56)#3,601 |
| 48. | Sunset | 12.4% | 5.5%(+6.87)#48 | 5.0%(+7.40)#3,703 |
| 49. | Holden | 12.3% | 5.5%(+6.78)#49 | 5.0%(+7.31)#3,751 |
| 50. | Castle Dale | 12.2% | 5.5%(+6.68)#50 | 5.0%(+7.21)#3,806 |
| 51. | Rush Valley | 12.1% | 5.5%(+6.57)#51 | 5.0%(+7.09)#3,878 |
| 52. | Elk Ridge | 11.9% | 5.5%(+6.37)#52 | 5.0%(+6.89)#4,008 |
| 53. | Aneth | 11.8% | 5.5%(+6.25)#53 | 5.0%(+6.77)#4,083 |
| 54. | Paragonah | 11.3% | 5.5%(+5.82)#54 | 5.0%(+6.34)#4,390 |
| 55. | Harrisville | 11.2% | 5.5%(+5.70)#55 | 5.0%(+6.22)#4,475 |
| 56. | West Mountain | 11.1% | 5.5%(+5.63)#56 | 5.0%(+6.15)#4,538 |
| 57. | Lyman | 10.9% | 5.5%(+5.37)#57 | 5.0%(+5.90)#4,750 |
| 58. | Meadow | 10.8% | 5.5%(+5.27)#58 | 5.0%(+5.79)#4,831 |
| 59. | Magna | 10.7% | 5.5%(+5.22)#59 | 5.0%(+5.75)#4,869 |
| 60. | Kearns | 10.7% | 5.5%(+5.18)#60 | 5.0%(+5.70)#4,912 |
| 61. | Fayette | 10.6% | 5.5%(+5.11)#61 | 5.0%(+5.63)#4,970 |
| 62. | Pine Valley | 10.5% | 5.5%(+5.01)#62 | 5.0%(+5.53)#5,045 |
| 63. | Tselakai Dezza | 10.5% | 5.5%(+5.01)#63 | 5.0%(+5.53)#5,060 |
| 64. | Salina | 10.5% | 5.5%(+4.95)#64 | 5.0%(+5.48)#5,102 |
| 65. | Rocky Ridge | 10.5% | 5.5%(+4.94)#65 | 5.0%(+5.47)#5,109 |
| 66. | Cornish | 10.4% | 5.5%(+4.92)#66 | 5.0%(+5.44)#5,129 |
| 67. | Parowan | 10.2% | 5.5%(+4.66)#67 | 5.0%(+5.18)#5,368 |
| 68. | Snowville | 10.2% | 5.5%(+4.65)#68 | 5.0%(+5.18)#5,376 |
| 69. | Circleville | 10.1% | 5.5%(+4.54)#69 | 5.0%(+5.07)#5,486 |
| 70. | West Valley City | 10.0% | 5.5%(+4.47)#70 | 5.0%(+4.99)#5,585 |
| 71. | Ivins | 9.9% | 5.5%(+4.43)#71 | 5.0%(+4.95)#5,617 |
| 72. | Enoch | 9.9% | 5.5%(+4.42)#72 | 5.0%(+4.94)#5,627 |
| 73. | Coalville | 9.8% | 5.5%(+4.26)#73 | 5.0%(+4.78)#5,776 |
| 74. | Roosevelt | 9.7% | 5.5%(+4.21)#74 | 5.0%(+4.73)#5,830 |
| 75. | Vernon | 9.6% | 5.5%(+4.12)#75 | 5.0%(+4.64)#5,921 |
| 76. | Lindon | 9.6% | 5.5%(+4.07)#76 | 5.0%(+4.59)#5,968 |
| 77. | Benjamin | 9.5% | 5.5%(+3.95)#77 | 5.0%(+4.48)#6,105 |
| 78. | Scipio | 9.5% | 5.5%(+3.93)#78 | 5.0%(+4.46)#6,120 |
| 79. | Duchesne | 9.4% | 5.5%(+3.90)#79 | 5.0%(+4.42)#6,154 |
| 80. | Helper | 9.4% | 5.5%(+3.90)#80 | 5.0%(+4.42)#6,155 |
| 81. | Marriott Slaterville | 9.3% | 5.5%(+3.81)#81 | 5.0%(+4.33)#6,256 |
| 82. | Honeyville | 9.2% | 5.5%(+3.69)#82 | 5.0%(+4.21)#6,391 |
| 83. | Heber | 9.1% | 5.5%(+3.60)#83 | 5.0%(+4.13)#6,490 |
| 84. | Fielding | 8.9% | 5.5%(+3.40)#84 | 5.0%(+3.92)#6,726 |
| 85. | Sigurd | 8.8% | 5.5%(+3.25)#85 | 5.0%(+3.78)#6,923 |
| 86. | Marion | 8.7% | 5.5%(+3.23)#86 | 5.0%(+3.76)#6,953 |
| 87. | Kenilworth | 8.7% | 5.5%(+3.18)#87 | 5.0%(+3.70)#7,044 |
| 88. | Trenton | 8.7% | 5.5%(+3.15)#88 | 5.0%(+3.67)#7,073 |
| 89. | Corinne | 8.6% | 5.5%(+3.04)#89 | 5.0%(+3.57)#7,228 |
| 90. | Panguitch | 8.5% | 5.5%(+2.95)#90 | 5.0%(+3.48)#7,362 |
| 91. | Monticello | 8.4% | 5.5%(+2.89)#91 | 5.0%(+3.41)#7,445 |
| 92. | Apple Valley | 8.4% | 5.5%(+2.86)#92 | 5.0%(+3.38)#7,478 |
| 93. | Millville | 8.4% | 5.5%(+2.84)#93 | 5.0%(+3.37)#7,502 |
| 94. | Monroe | 8.4% | 5.5%(+2.84)#94 | 5.0%(+3.36)#7,512 |
| 95. | Vernal | 8.2% | 5.5%(+2.71)#95 | 5.0%(+3.23)#7,701 |
| 96. | Jensen | 8.2% | 5.5%(+2.64)#96 | 5.0%(+3.17)#7,814 |
| 97. | Koosharem | 8.1% | 5.5%(+2.59)#97 | 5.0%(+3.11)#7,897 |
| 98. | Mayfield | 8.0% | 5.5%(+2.48)#98 | 5.0%(+3.01)#8,058 |
| 99. | Santaquin | 8.0% | 5.5%(+2.48)#99 | 5.0%(+3.00)#8,067 |
| 100. | Moroni | 8.0% | 5.5%(+2.47)#100 | 5.0%(+2.99)#8,072 |
Common Questions
What are the Top 10 Cities with the Highest Percentage of Population Employed in Construction & Extraction in Utah?
Top 10 Cities with the Highest Percentage of Population Employed in Construction & Extraction in Utah are:
What city has the Highest Percentage of Population Employed in Construction & Extraction in Utah?
Halchita has the Highest Percentage of Population Employed in Construction & Extraction in Utah with 66.7%.
What is the Percentage of Population Employed in Construction & Extraction in the State of Utah?
Percentage of Population Employed in Construction & Extraction in Utah is 5.5%.
What is the Percentage of Population Employed in Construction & Extraction in the United States?
Percentage of Population Employed in Construction & Extraction in the United States is 5.0%.