Julian, CA Map & Demographics
Julian Map
Julian Overview
$48,108
PER CAPITA INCOME
$98,460
AVG FAMILY INCOME
$81,126
AVG HOUSEHOLD INCOME
0.9%
WAGE / INCOME GAP [ % ]
99.1¢/ $1
WAGE / INCOME GAP [ $ ]
0.26
INEQUALITY / GINI INDEX
1,377
TOTAL POPULATION
705
MALE POPULATION
672
FEMALE POPULATION
104.91
MALES / 100 FEMALES
95.32
FEMALES / 100 MALES
59.3
MEDIAN AGE
2.4
AVG FAMILY SIZE
1.8
AVG HOUSEHOLD SIZE
647
LABOR FORCE [ PEOPLE ]
51.0%
PERCENT IN LABOR FORCE
Julian Zip Codes
Julian Area Codes
Income in Julian
Income Overview in Julian
Per Capita Income in Julian is $48,108, while median incomes of families and households are $98,460 and $81,126 respectively.
| Characteristic | Number | Measure |
| Per Capita Income | 1,377 | $48,108 |
| Median Family Income | 359 | $98,460 |
| Mean Family Income | 359 | $112,076 |
| Median Household Income | 762 | $81,126 |
| Mean Household Income | 762 | $85,248 |
| Income Deficit | 359 | $0 |
| Wage / Income Gap (%) | 1,377 | 0.92% |
| Wage / Income Gap ($) | 1,377 | 99.08¢ per $1 |
| Gini / Inequality Index | 1,377 | 0.26 |
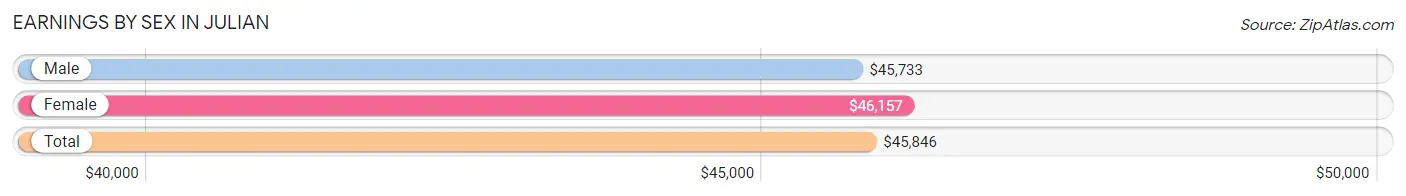
Earnings by Sex in Julian
Average Earnings in Julian are $45,846, $45,733 for men and $46,157 for women, a difference of 0.9%.
| Sex | Number | Average Earnings |
| Male | 404 (62.4%) | $45,733 |
| Female | 243 (37.6%) | $46,157 |
| Total | 647 (100.0%) | $45,846 |
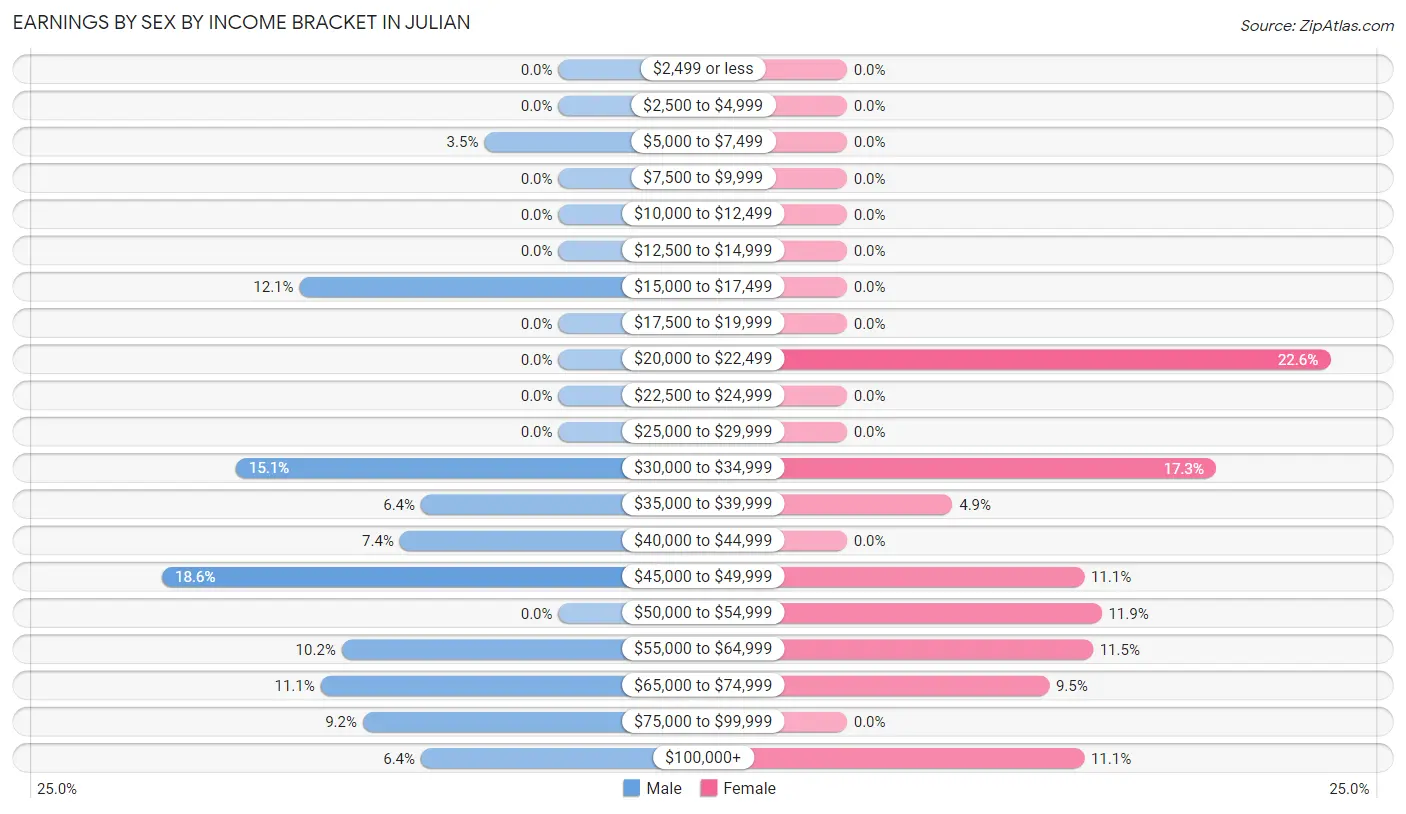
Earnings by Sex by Income Bracket in Julian
The most common earnings brackets in Julian are $45,000 to $49,999 for men (75 | 18.6%) and $20,000 to $22,499 for women (55 | 22.6%).
| Income | Male | Female |
| $2,499 or less | 0 (0.0%) | 0 (0.0%) |
| $2,500 to $4,999 | 0 (0.0%) | 0 (0.0%) |
| $5,000 to $7,499 | 14 (3.5%) | 0 (0.0%) |
| $7,500 to $9,999 | 0 (0.0%) | 0 (0.0%) |
| $10,000 to $12,499 | 0 (0.0%) | 0 (0.0%) |
| $12,500 to $14,999 | 0 (0.0%) | 0 (0.0%) |
| $15,000 to $17,499 | 49 (12.1%) | 0 (0.0%) |
| $17,500 to $19,999 | 0 (0.0%) | 0 (0.0%) |
| $20,000 to $22,499 | 0 (0.0%) | 55 (22.6%) |
| $22,500 to $24,999 | 0 (0.0%) | 0 (0.0%) |
| $25,000 to $29,999 | 0 (0.0%) | 0 (0.0%) |
| $30,000 to $34,999 | 61 (15.1%) | 42 (17.3%) |
| $35,000 to $39,999 | 26 (6.4%) | 12 (4.9%) |
| $40,000 to $44,999 | 30 (7.4%) | 0 (0.0%) |
| $45,000 to $49,999 | 75 (18.6%) | 27 (11.1%) |
| $50,000 to $54,999 | 0 (0.0%) | 29 (11.9%) |
| $55,000 to $64,999 | 41 (10.2%) | 28 (11.5%) |
| $65,000 to $74,999 | 45 (11.1%) | 23 (9.5%) |
| $75,000 to $99,999 | 37 (9.2%) | 0 (0.0%) |
| $100,000+ | 26 (6.4%) | 27 (11.1%) |
| Total | 404 (100.0%) | 243 (100.0%) |
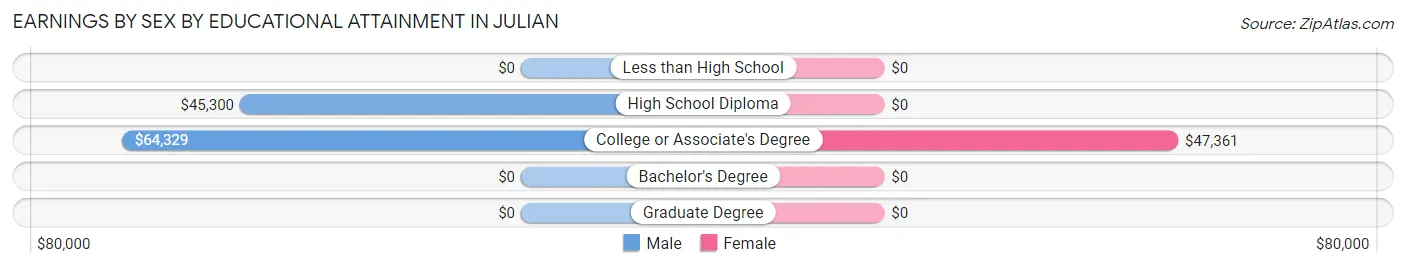
Earnings by Sex by Educational Attainment in Julian
Average earnings in Julian are $45,733 for men and $51,121 for women, a difference of 10.5%. Men with an educational attainment of college or associate's degree enjoy the highest average annual earnings of $64,329, while those with high school diploma education earn the least with $45,300. Women with an educational attainment of college or associate's degree earn the most with the average annual earnings of $47,361, while those with college or associate's degree education have the smallest earnings of $47,361.
| Educational Attainment | Male Income | Female Income |
| Less than High School | - | - |
| High School Diploma | $45,300 | $0 |
| College or Associate's Degree | $64,329 | $47,361 |
| Bachelor's Degree | - | - |
| Graduate Degree | - | - |
| Total | $45,733 | $51,121 |
Family Income in Julian
Family Income Brackets in Julian
According to the Julian family income data, there are 158 families falling into the $75,000 to $99,999 income range, which is the most common income bracket and makes up 44.0% of all families.
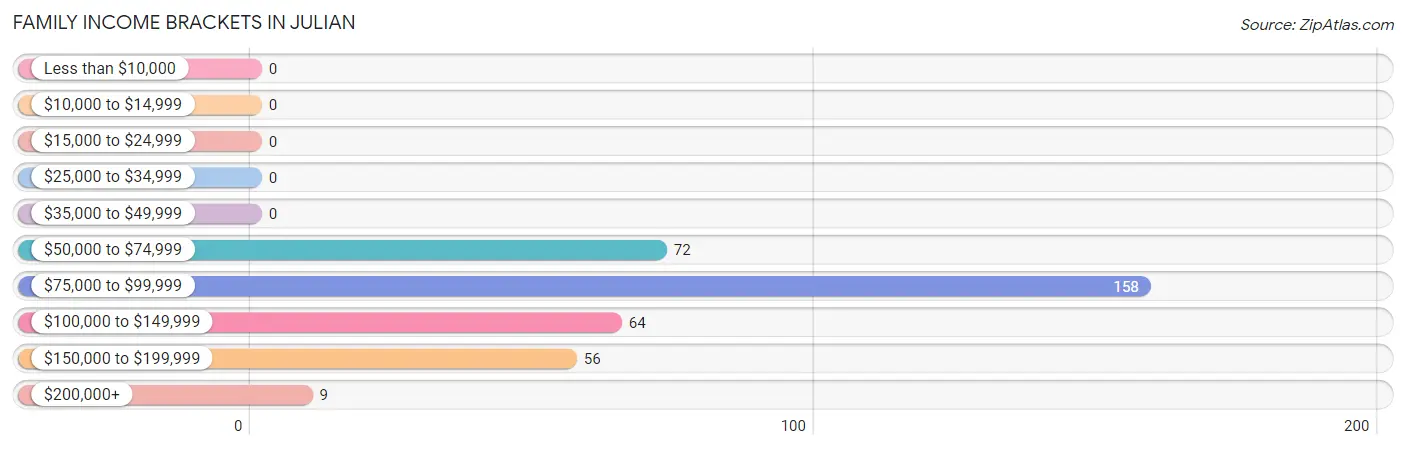
| Income Bracket | # Families | % Families |
| Less than $10,000 | 0 | 0.0% |
| $10,000 to $14,999 | 0 | 0.0% |
| $15,000 to $24,999 | 0 | 0.0% |
| $25,000 to $34,999 | 0 | 0.0% |
| $35,000 to $49,999 | 0 | 0.0% |
| $50,000 to $74,999 | 72 | 20.1% |
| $75,000 to $99,999 | 158 | 44.0% |
| $100,000 to $149,999 | 64 | 17.8% |
| $150,000 to $199,999 | 56 | 15.6% |
| $200,000+ | 9 | 2.5% |
Family Income by Famaliy Size in Julian
3-person families (65 | 18.1%) account for the highest median family income in Julian with $98,958 per family, while 2-person families (262 | 73.0%) have the highest median income of $49,471 per family member.
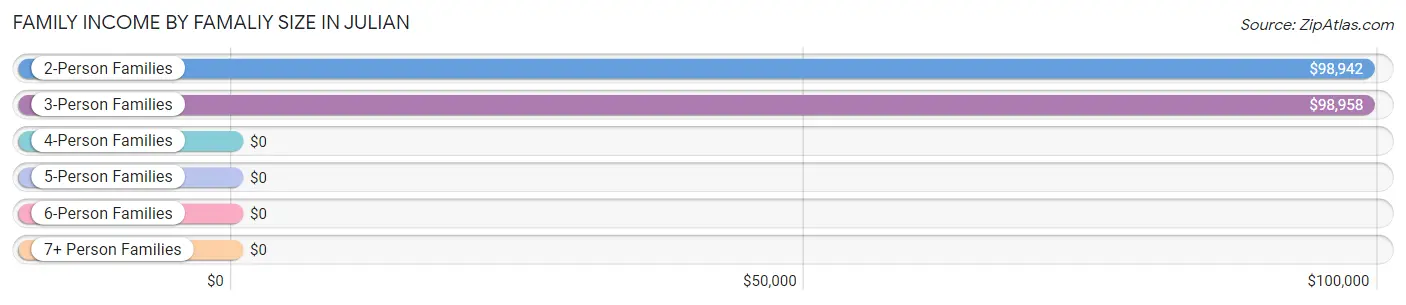
| Income Bracket | # Families | Median Income |
| 2-Person Families | 262 (73.0%) | $98,942 |
| 3-Person Families | 65 (18.1%) | $98,958 |
| 4-Person Families | 32 (8.9%) | $0 |
| 5-Person Families | 0 (0.0%) | $0 |
| 6-Person Families | 0 (0.0%) | $0 |
| 7+ Person Families | 0 (0.0%) | $0 |
| Total | 359 (100.0%) | $98,460 |
Family Income by Number of Earners in Julian
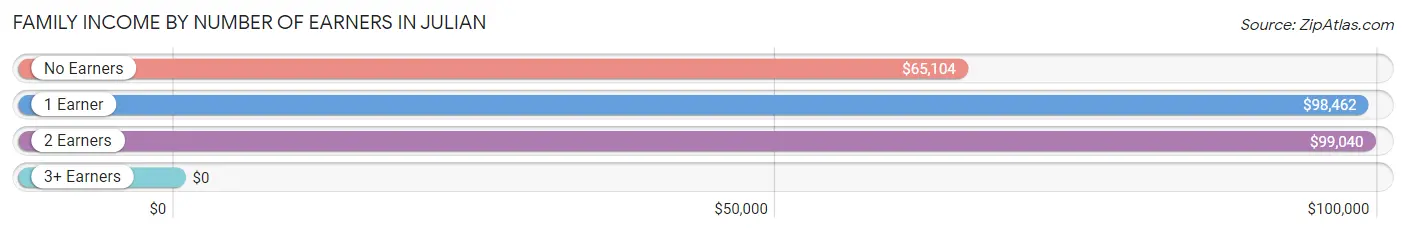
| Number of Earners | # Families | Median Income |
| No Earners | 98 (27.3%) | $65,104 |
| 1 Earner | 84 (23.4%) | $98,462 |
| 2 Earners | 157 (43.7%) | $99,040 |
| 3+ Earners | 20 (5.6%) | $0 |
| Total | 359 (100.0%) | $98,460 |
Household Income in Julian
Household Income Brackets in Julian
With 329 households falling in the category, the $75,000 to $99,999 income range is the most frequent in Julian, accounting for 43.2% of all households.
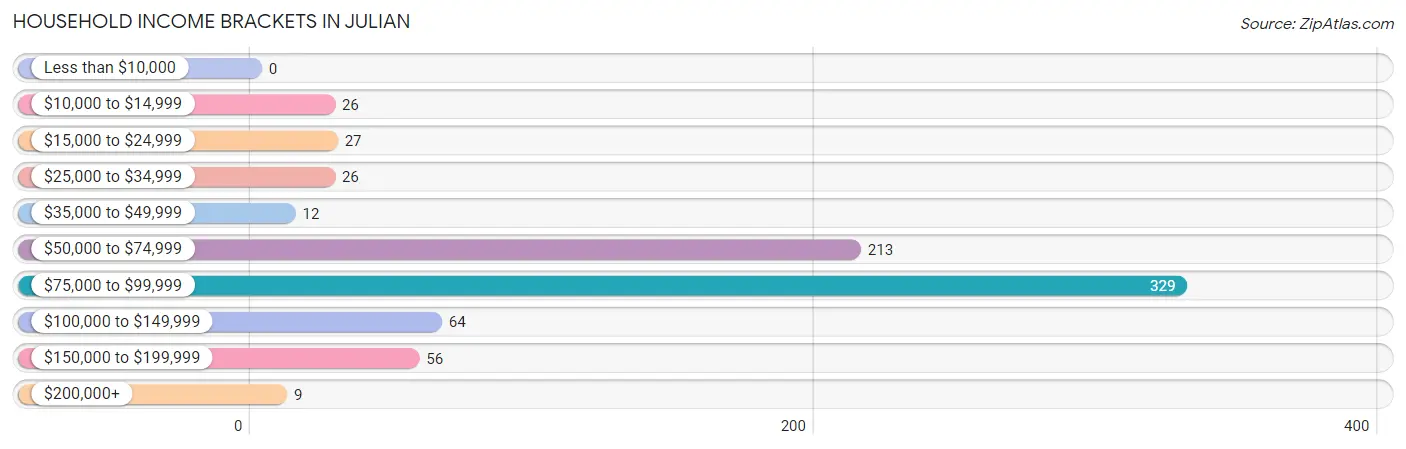
| Income Bracket | # Households | % Households |
| Less than $10,000 | 0 | 0.0% |
| $10,000 to $14,999 | 26 | 3.4% |
| $15,000 to $24,999 | 27 | 3.5% |
| $25,000 to $34,999 | 26 | 3.4% |
| $35,000 to $49,999 | 12 | 1.6% |
| $50,000 to $74,999 | 213 | 28.0% |
| $75,000 to $99,999 | 329 | 43.2% |
| $100,000 to $149,999 | 64 | 8.4% |
| $150,000 to $199,999 | 56 | 7.3% |
| $200,000+ | 9 | 1.2% |
Household Income by Householder Age in Julian
The median household income in Julian is $81,126, with the highest median household income of $99,351 found in the 45 to 64 years age bracket for the primary householder. A total of 155 households (20.3%) fall into this category. Meanwhile, the 15 to 24 years age bracket for the primary householder has the lowest median household income of $0, with 55 households (7.2%) in this group.
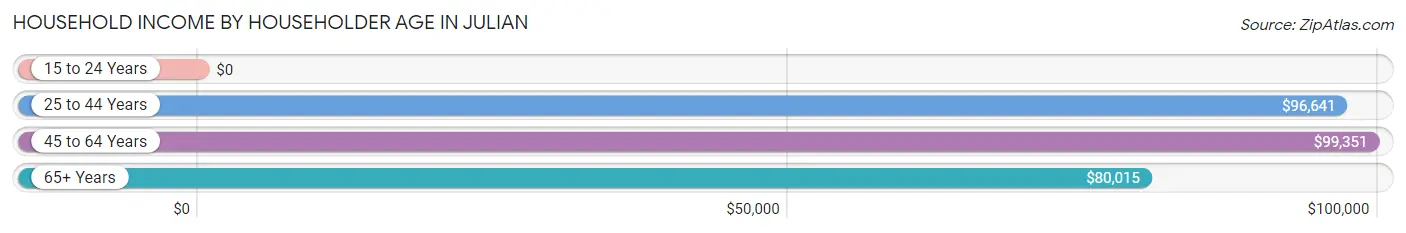
| Income Bracket | # Households | Median Income |
| 15 to 24 Years | 55 (7.2%) | $0 |
| 25 to 44 Years | 100 (13.1%) | $96,641 |
| 45 to 64 Years | 155 (20.3%) | $99,351 |
| 65+ Years | 452 (59.3%) | $80,015 |
| Total | 762 (100.0%) | $81,126 |
Poverty in Julian
Income Below Poverty by Sex and Age in Julian
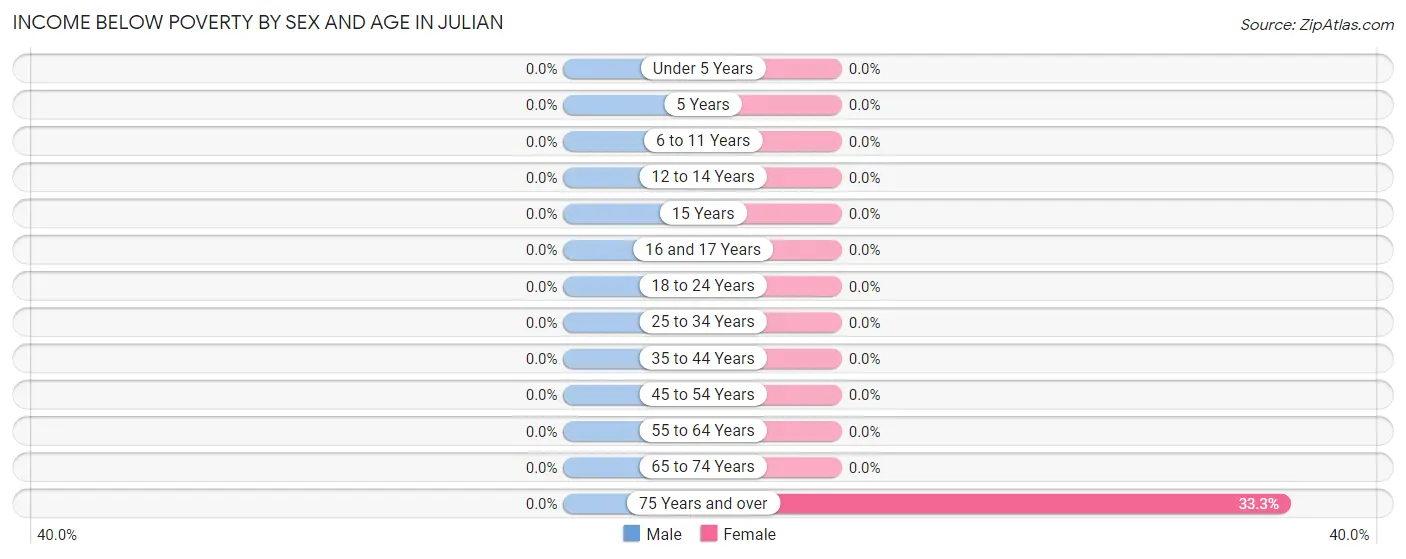
| Age Bracket | Male | Female |
| Under 5 Years | 0 (0.0%) | 0 (0.0%) |
| 5 Years | 0 (0.0%) | 0 (0.0%) |
| 6 to 11 Years | 0 (0.0%) | 0 (0.0%) |
| 12 to 14 Years | 0 (0.0%) | 0 (0.0%) |
| 15 Years | 0 (0.0%) | 0 (0.0%) |
| 16 and 17 Years | 0 (0.0%) | 0 (0.0%) |
| 18 to 24 Years | 0 (0.0%) | 0 (0.0%) |
| 25 to 34 Years | 0 (0.0%) | 0 (0.0%) |
| 35 to 44 Years | 0 (0.0%) | 0 (0.0%) |
| 45 to 54 Years | 0 (0.0%) | 0 (0.0%) |
| 55 to 64 Years | 0 (0.0%) | 0 (0.0%) |
| 65 to 74 Years | 0 (0.0%) | 0 (0.0%) |
| 75 Years and over | 0 (0.0%) | 26 (33.3%) |
| Total | 0 (0.0%) | 26 (3.9%) |
Income Above Poverty by Sex and Age in Julian
According to the poverty statistics in Julian, males aged under 5 years and females aged under 5 years are the age groups that are most secure financially, with 100.0% of males and 100.0% of females in these age groups living above the poverty line.
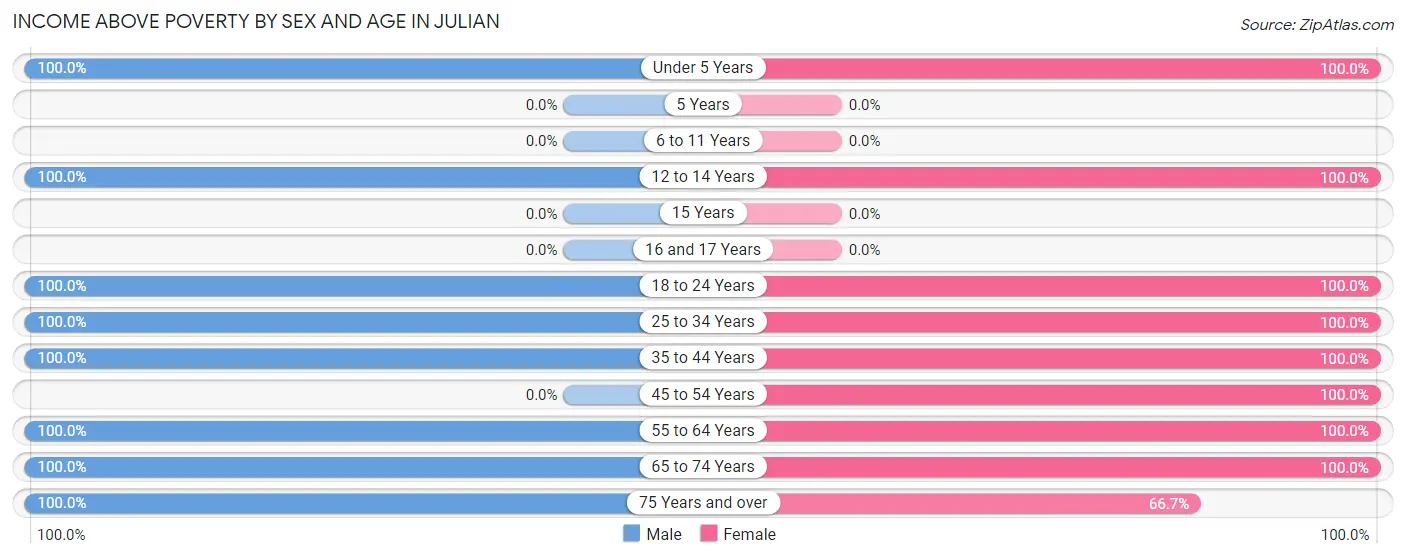
| Age Bracket | Male | Female |
| Under 5 Years | 33 (100.0%) | 35 (100.0%) |
| 5 Years | 0 (0.0%) | 0 (0.0%) |
| 6 to 11 Years | 0 (0.0%) | 0 (0.0%) |
| 12 to 14 Years | 29 (100.0%) | 12 (100.0%) |
| 15 Years | 0 (0.0%) | 0 (0.0%) |
| 16 and 17 Years | 0 (0.0%) | 0 (0.0%) |
| 18 to 24 Years | 33 (100.0%) | 55 (100.0%) |
| 25 to 34 Years | 124 (100.0%) | 32 (100.0%) |
| 35 to 44 Years | 85 (100.0%) | 67 (100.0%) |
| 45 to 54 Years | 0 (0.0%) | 27 (100.0%) |
| 55 to 64 Years | 158 (100.0%) | 77 (100.0%) |
| 65 to 74 Years | 170 (100.0%) | 289 (100.0%) |
| 75 Years and over | 73 (100.0%) | 52 (66.7%) |
| Total | 705 (100.0%) | 646 (96.1%) |
Income Below Poverty Among Married-Couple Families in Julian
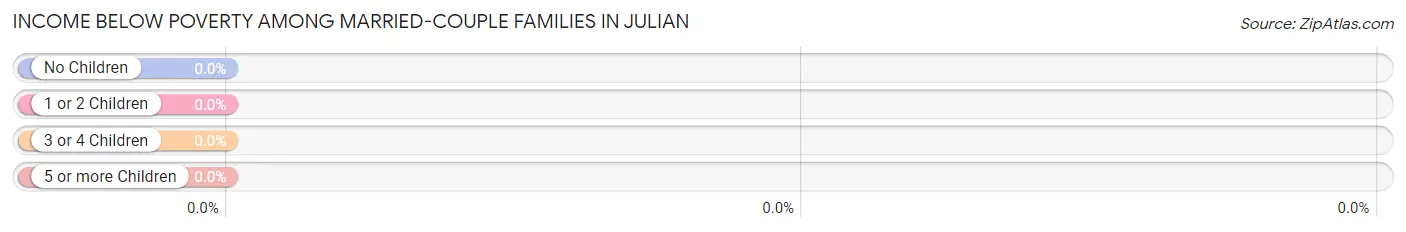
| Children | Above Poverty | Below Poverty |
| No Children | 259 (100.0%) | 0 (0.0%) |
| 1 or 2 Children | 47 (100.0%) | 0 (0.0%) |
| 3 or 4 Children | 0 (0.0%) | 0 (0.0%) |
| 5 or more Children | 0 (0.0%) | 0 (0.0%) |
| Total | 306 (100.0%) | 0 (0.0%) |
Income Below Poverty Among Single-Parent Households in Julian
| Children | Single Father | Single Mother |
| No Children | 0 (0.0%) | 0 (0.0%) |
| 1 or 2 Children | 0 (0.0%) | 0 (0.0%) |
| 3 or 4 Children | 0 (0.0%) | 0 (0.0%) |
| 5 or more Children | 0 (0.0%) | 0 (0.0%) |
| Total | 0 (0.0%) | 0 (0.0%) |
Income Below Poverty Among Married-Couple vs Single-Parent Households in Julian
| Children | Married-Couple Families | Single-Parent Households |
| No Children | 0 (0.0%) | 0 (0.0%) |
| 1 or 2 Children | 0 (0.0%) | 0 (0.0%) |
| 3 or 4 Children | 0 (0.0%) | 0 (0.0%) |
| 5 or more Children | 0 (0.0%) | 0 (0.0%) |
| Total | 0 (0.0%) | 0 (0.0%) |
Race in Julian
The most populous races in Julian are White / Caucasian (1,076 | 78.1%), Hispanic or Latino (301 | 21.9%), and Two or more Races (301 | 21.9%).
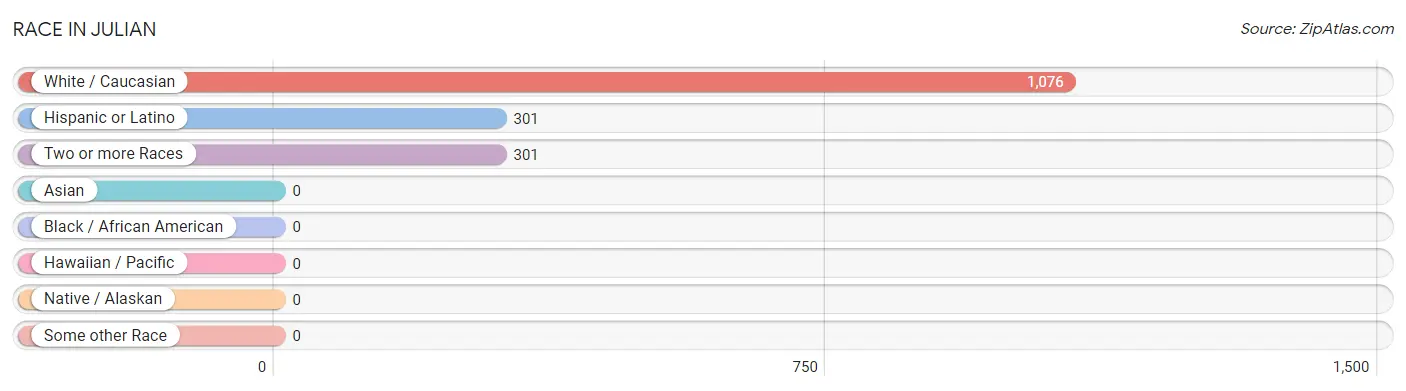
| Race | # Population | % Population |
| Asian | 0 | 0.0% |
| Black / African American | 0 | 0.0% |
| Hawaiian / Pacific | 0 | 0.0% |
| Hispanic or Latino | 301 | 21.9% |
| Native / Alaskan | 0 | 0.0% |
| White / Caucasian | 1,076 | 78.1% |
| Two or more Races | 301 | 21.9% |
| Some other Race | 0 | 0.0% |
| Total | 1,377 | 100.0% |
Ancestry in Julian
The most populous ancestries reported in Julian are Mexican (301 | 21.9%), German (238 | 17.3%), Italian (168 | 12.2%), English (167 | 12.1%), and Irish (132 | 9.6%), together accounting for 73.1% of all Julian residents.
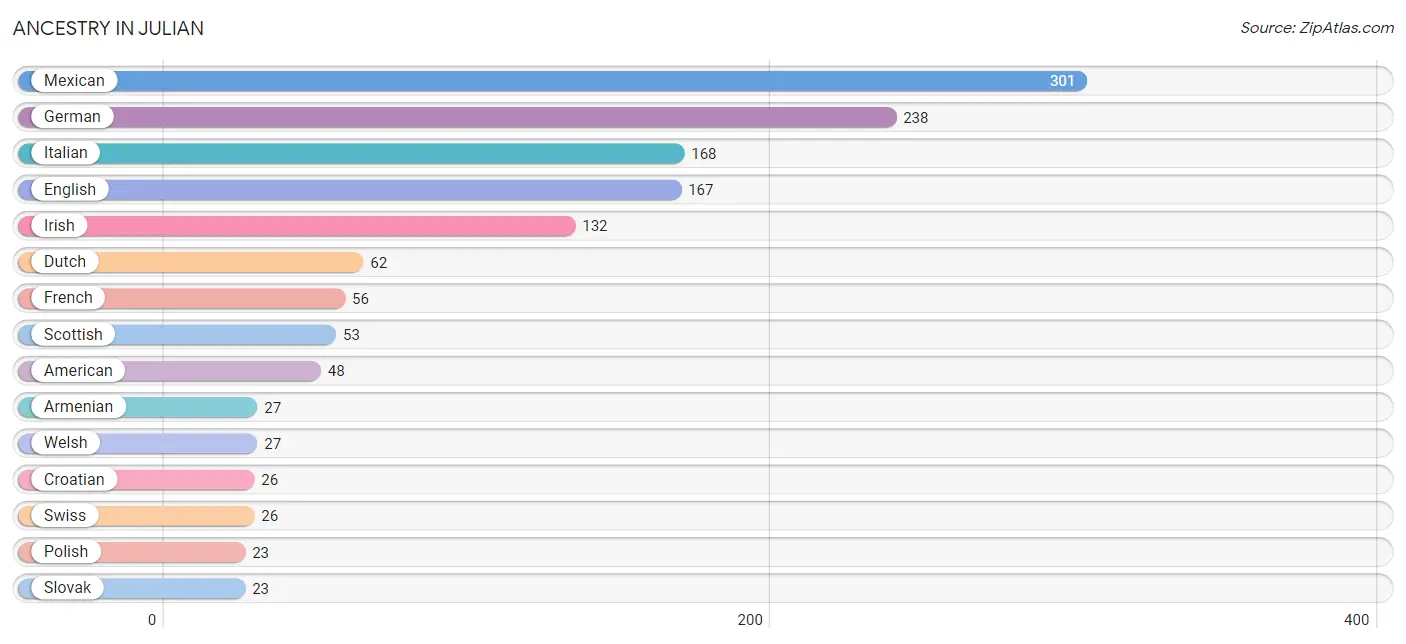
| Ancestry | # Population | % Population |
| American | 48 | 3.5% |
| Armenian | 27 | 2.0% |
| Croatian | 26 | 1.9% |
| Dutch | 62 | 4.5% |
| English | 167 | 12.1% |
| French | 56 | 4.1% |
| German | 238 | 17.3% |
| Greek | 9 | 0.6% |
| Irish | 132 | 9.6% |
| Italian | 168 | 12.2% |
| Mexican | 301 | 21.9% |
| Polish | 23 | 1.7% |
| Russian | 12 | 0.9% |
| Scottish | 53 | 3.8% |
| Slovak | 23 | 1.7% |
| Swiss | 26 | 1.9% |
| Welsh | 27 | 2.0% | View All 17 Rows |
Immigrants in Julian
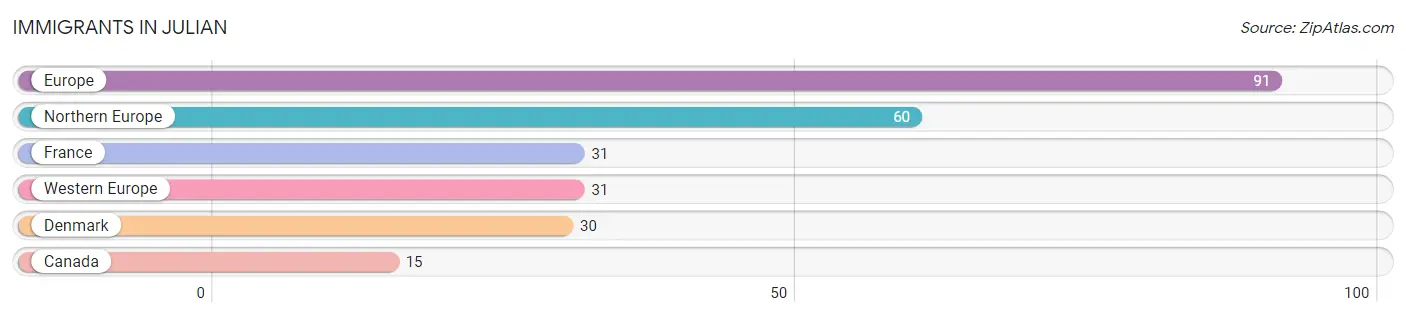
The most numerous immigrant groups reported in Julian came from Europe (91 | 6.6%), Northern Europe (60 | 4.4%), France (31 | 2.2%), Western Europe (31 | 2.2%), and Denmark (30 | 2.2%), together accounting for 17.6% of all Julian residents.
| Immigration Origin | # Population | % Population |
| Canada | 15 | 1.1% |
| Denmark | 30 | 2.2% |
| Europe | 91 | 6.6% |
| France | 31 | 2.2% |
| Northern Europe | 60 | 4.4% |
| Western Europe | 31 | 2.2% | View All 6 Rows |
Sex and Age in Julian
Sex and Age in Julian
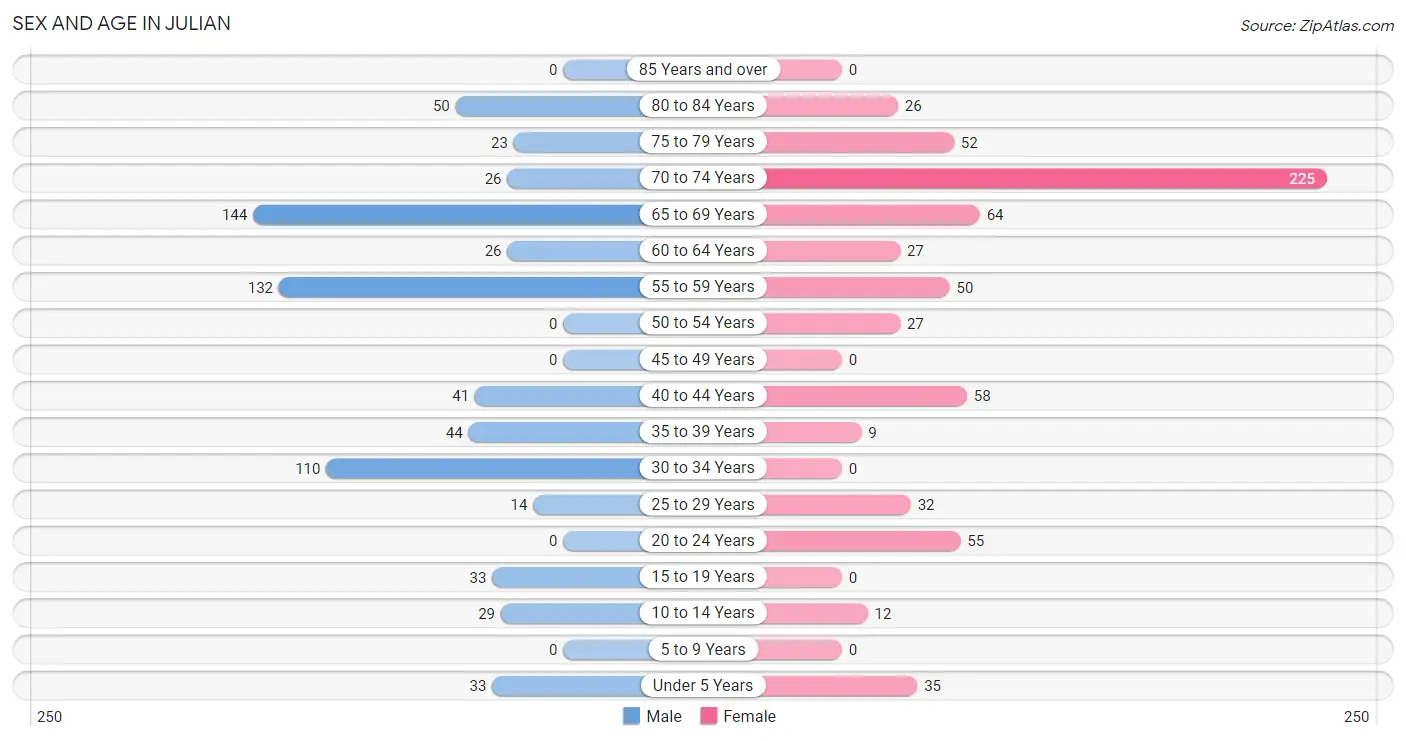
The most populous age groups in Julian are 65 to 69 Years (144 | 20.4%) for men and 70 to 74 Years (225 | 33.5%) for women.
| Age Bracket | Male | Female |
| Under 5 Years | 33 (4.7%) | 35 (5.2%) |
| 5 to 9 Years | 0 (0.0%) | 0 (0.0%) |
| 10 to 14 Years | 29 (4.1%) | 12 (1.8%) |
| 15 to 19 Years | 33 (4.7%) | 0 (0.0%) |
| 20 to 24 Years | 0 (0.0%) | 55 (8.2%) |
| 25 to 29 Years | 14 (2.0%) | 32 (4.8%) |
| 30 to 34 Years | 110 (15.6%) | 0 (0.0%) |
| 35 to 39 Years | 44 (6.2%) | 9 (1.3%) |
| 40 to 44 Years | 41 (5.8%) | 58 (8.6%) |
| 45 to 49 Years | 0 (0.0%) | 0 (0.0%) |
| 50 to 54 Years | 0 (0.0%) | 27 (4.0%) |
| 55 to 59 Years | 132 (18.7%) | 50 (7.4%) |
| 60 to 64 Years | 26 (3.7%) | 27 (4.0%) |
| 65 to 69 Years | 144 (20.4%) | 64 (9.5%) |
| 70 to 74 Years | 26 (3.7%) | 225 (33.5%) |
| 75 to 79 Years | 23 (3.3%) | 52 (7.7%) |
| 80 to 84 Years | 50 (7.1%) | 26 (3.9%) |
| 85 Years and over | 0 (0.0%) | 0 (0.0%) |
| Total | 705 (100.0%) | 672 (100.0%) |
Families and Households in Julian
Median Family Size in Julian
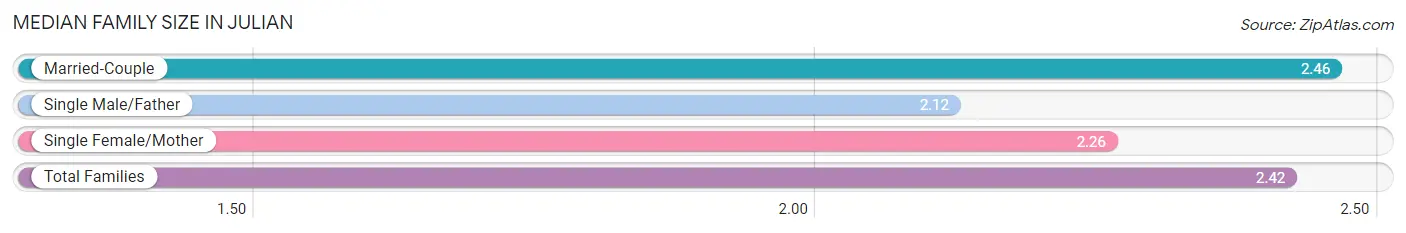
The median family size in Julian is 2.42 persons per family, with married-couple families (306 | 85.2%) accounting for the largest median family size of 2.46 persons per family. On the other hand, single male/father families (26 | 7.2%) represent the smallest median family size with 2.12 persons per family.
| Family Type | # Families | Family Size |
| Married-Couple | 306 (85.2%) | 2.46 |
| Single Male/Father | 26 (7.2%) | 2.12 |
| Single Female/Mother | 27 (7.5%) | 2.26 |
| Total Families | 359 (100.0%) | 2.42 |
Median Household Size in Julian
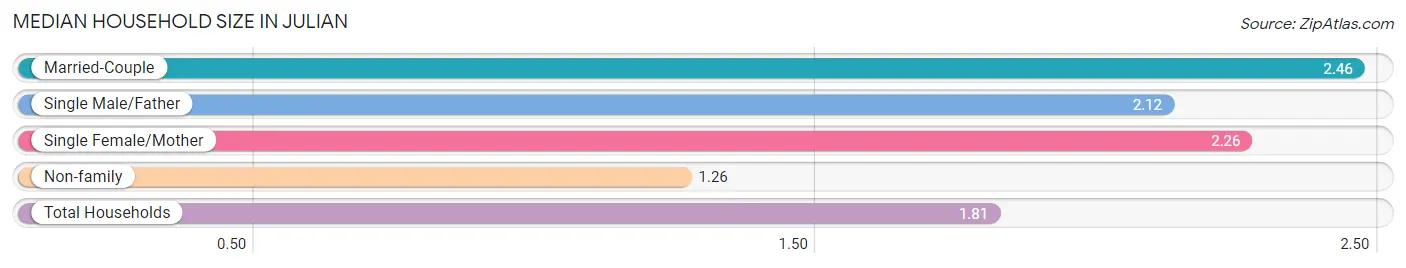
The median household size in Julian is 1.81 persons per household, with married-couple households (306 | 40.2%) accounting for the largest median household size of 2.46 persons per household. non-family households (403 | 52.9%) represent the smallest median household size with 1.26 persons per household.
| Household Type | # Households | Household Size |
| Married-Couple | 306 (40.2%) | 2.46 |
| Single Male/Father | 26 (3.4%) | 2.12 |
| Single Female/Mother | 27 (3.5%) | 2.26 |
| Non-family | 403 (52.9%) | 1.26 |
| Total Households | 762 (100.0%) | 1.81 |
Household Size by Marriage Status in Julian
Out of a total of 762 households in Julian, 359 (47.1%) are family households, while 403 (52.9%) are nonfamily households. The most numerous type of family households are 2-person households, comprising 262, and the most common type of nonfamily households are 1-person households, comprising 318.

| Household Size | Family Households | Nonfamily Households |
| 1-Person Households | - | 318 (41.7%) |
| 2-Person Households | 262 (34.4%) | 85 (11.2%) |
| 3-Person Households | 65 (8.5%) | 0 (0.0%) |
| 4-Person Households | 32 (4.2%) | 0 (0.0%) |
| 5-Person Households | 0 (0.0%) | 0 (0.0%) |
| 6-Person Households | 0 (0.0%) | 0 (0.0%) |
| 7+ Person Households | 0 (0.0%) | 0 (0.0%) |
| Total | 359 (47.1%) | 403 (52.9%) |
Female Fertility in Julian
Fertility by Age in Julian
| Age Bracket | Women with Births | Births / 1,000 Women |
| 15 to 19 years | 0 (0.0%) | 0.0 |
| 20 to 34 years | 0 (0.0%) | 0.0 |
| 35 to 50 years | 0 (0.0%) | 0.0 |
| Total | 0 (0.0%) | 0.0 |
Fertility by Age by Marriage Status in Julian
| Age Bracket | Married | Unmarried |
| 15 to 19 years | 0 (0.0%) | 0 (0.0%) |
| 20 to 34 years | 0 (0.0%) | 0 (0.0%) |
| 35 to 50 years | 0 (0.0%) | 0 (0.0%) |
| Total | 0 (0.0%) | 0 (0.0%) |
Fertility by Education in Julian
| Educational Attainment | Women with Births | Births / 1,000 Women |
| Less than High School | 0 (0.0%) | 0.0 |
| High School Diploma | 0 (0.0%) | 0.0 |
| College or Associate's Degree | 0 (0.0%) | 0.0 |
| Bachelor's Degree | 0 (0.0%) | 0.0 |
| Graduate Degree | 0 (0.0%) | 0.0 |
| Total | 0 (0.0%) | 0.0 |
Fertility by Education by Marriage Status in Julian
| Educational Attainment | Married | Unmarried |
| Less than High School | 0 (0.0%) | 0 (0.0%) |
| High School Diploma | 0 (0.0%) | 0 (0.0%) |
| College or Associate's Degree | 0 (0.0%) | 0 (0.0%) |
| Bachelor's Degree | 0 (0.0%) | 0 (0.0%) |
| Graduate Degree | 0 (0.0%) | 0 (0.0%) |
| Total | 0 (0.0%) | 0 (0.0%) |
Employment Characteristics in Julian
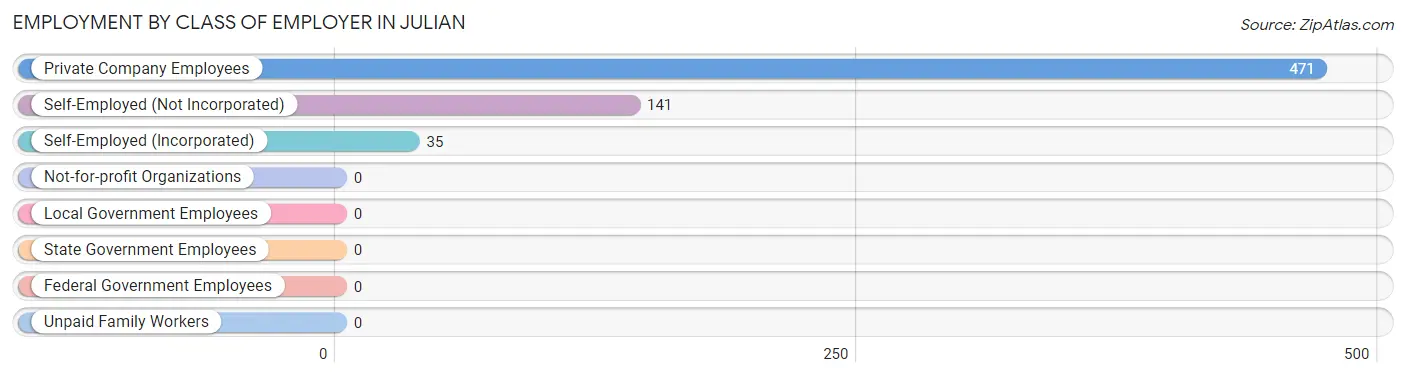
Employment by Class of Employer in Julian
Among the 647 employed individuals in Julian, private company employees (471 | 72.8%), self-employed (not incorporated) (141 | 21.8%), and self-employed (incorporated) (35 | 5.4%) make up the most common classes of employment.
| Employer Class | # Employees | % Employees |
| Private Company Employees | 471 | 72.8% |
| Self-Employed (Incorporated) | 35 | 5.4% |
| Self-Employed (Not Incorporated) | 141 | 21.8% |
| Not-for-profit Organizations | 0 | 0.0% |
| Local Government Employees | 0 | 0.0% |
| State Government Employees | 0 | 0.0% |
| Federal Government Employees | 0 | 0.0% |
| Unpaid Family Workers | 0 | 0.0% |
| Total | 647 | 100.0% |
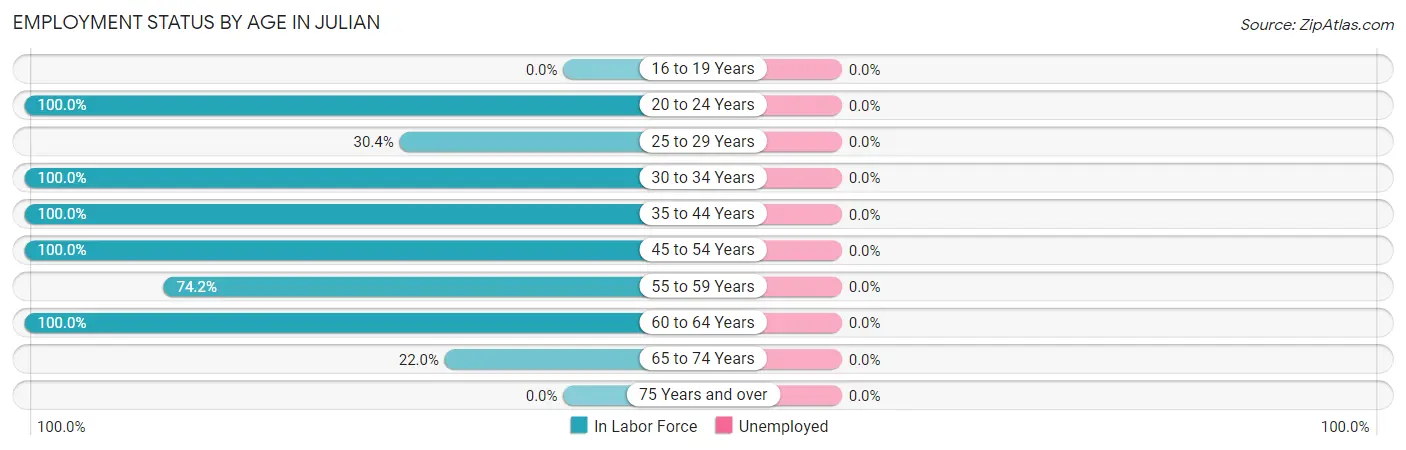
Employment Status by Age in Julian
| Age Bracket | In Labor Force | Unemployed |
| 16 to 19 Years | 0 (0.0%) | 0 (0.0%) |
| 20 to 24 Years | 55 (100.0%) | 0 (0.0%) |
| 25 to 29 Years | 14 (30.4%) | 0 (0.0%) |
| 30 to 34 Years | 110 (100.0%) | 0 (0.0%) |
| 35 to 44 Years | 152 (100.0%) | 0 (0.0%) |
| 45 to 54 Years | 27 (100.0%) | 0 (0.0%) |
| 55 to 59 Years | 135 (74.2%) | 0 (0.0%) |
| 60 to 64 Years | 53 (100.0%) | 0 (0.0%) |
| 65 to 74 Years | 101 (22.0%) | 0 (0.0%) |
| 75 Years and over | 0 (0.0%) | 0 (0.0%) |
| Total | 647 (51.0%) | 0 (0.0%) |
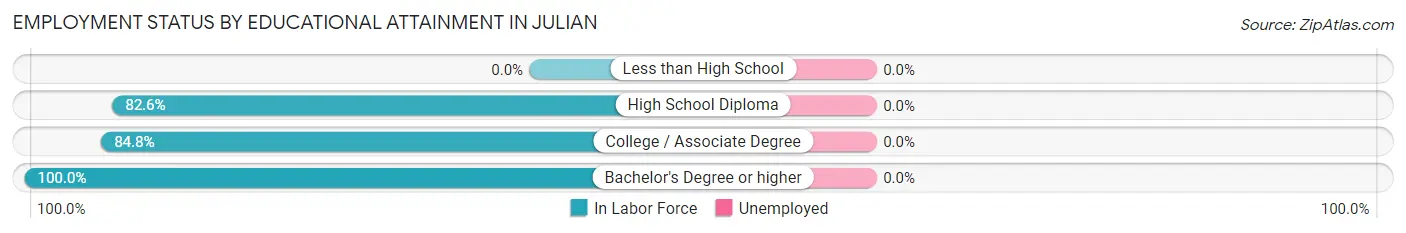
Employment Status by Educational Attainment in Julian
| Educational Attainment | In Labor Force | Unemployed |
| Less than High School | 0 (0.0%) | 0 (0.0%) |
| High School Diploma | 114 (82.6%) | 0 (0.0%) |
| College / Associate Degree | 307 (84.8%) | 0 (0.0%) |
| Bachelor's Degree or higher | 70 (100.0%) | 0 (0.0%) |
| Total | 491 (86.1%) | 0 (0.0%) |
Employment Occupations by Sex in Julian
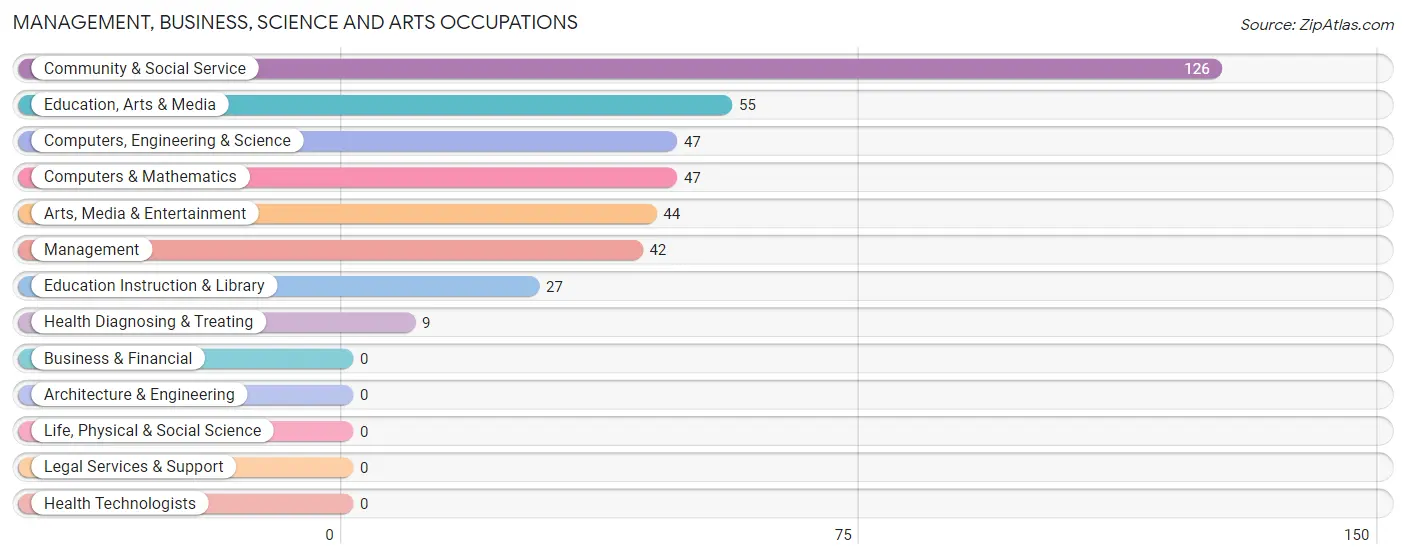
Management, Business, Science and Arts Occupations
The most common Management, Business, Science and Arts occupations in Julian are Community & Social Service (126 | 19.5%), Education, Arts & Media (55 | 8.5%), Computers, Engineering & Science (47 | 7.3%), Computers & Mathematics (47 | 7.3%), and Arts, Media & Entertainment (44 | 6.8%).
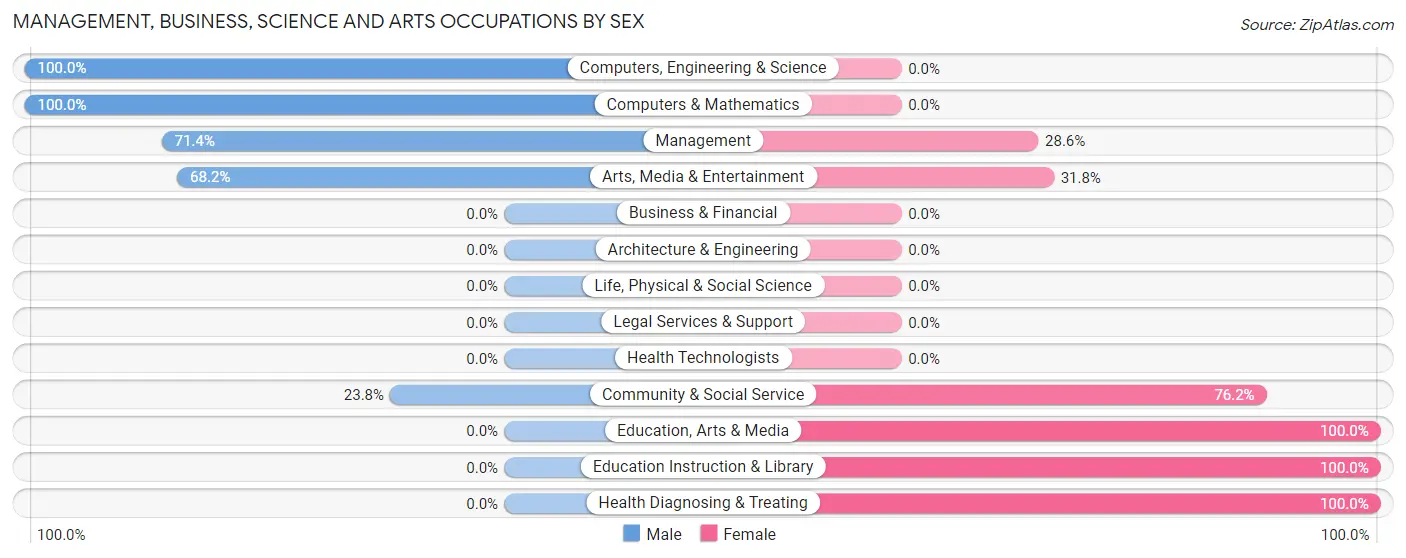
Management, Business, Science and Arts Occupations by Sex
Within the Management, Business, Science and Arts occupations in Julian, the most male-oriented occupations are Computers, Engineering & Science (100.0%), Computers & Mathematics (100.0%), and Management (71.4%), while the most female-oriented occupations are Education, Arts & Media (100.0%), Education Instruction & Library (100.0%), and Health Diagnosing & Treating (100.0%).
| Occupation | Male | Female |
| Management | 30 (71.4%) | 12 (28.6%) |
| Business & Financial | 0 (0.0%) | 0 (0.0%) |
| Computers, Engineering & Science | 47 (100.0%) | 0 (0.0%) |
| Computers & Mathematics | 47 (100.0%) | 0 (0.0%) |
| Architecture & Engineering | 0 (0.0%) | 0 (0.0%) |
| Life, Physical & Social Science | 0 (0.0%) | 0 (0.0%) |
| Community & Social Service | 30 (23.8%) | 96 (76.2%) |
| Education, Arts & Media | 0 (0.0%) | 55 (100.0%) |
| Legal Services & Support | 0 (0.0%) | 0 (0.0%) |
| Education Instruction & Library | 0 (0.0%) | 27 (100.0%) |
| Arts, Media & Entertainment | 30 (68.2%) | 14 (31.8%) |
| Health Diagnosing & Treating | 0 (0.0%) | 9 (100.0%) |
| Health Technologists | 0 (0.0%) | 0 (0.0%) |
| Total (Category) | 107 (47.8%) | 117 (52.2%) |
| Total (Overall) | 404 (62.4%) | 243 (37.6%) |
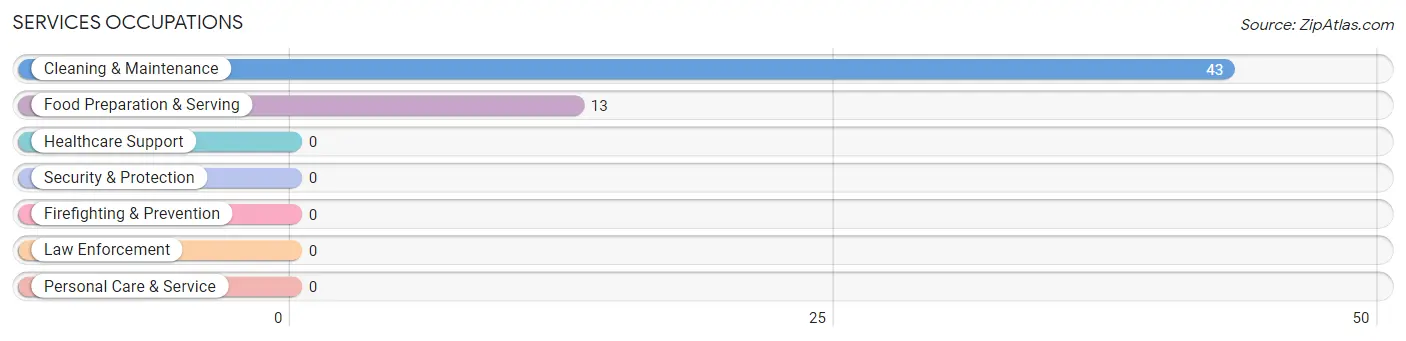
Services Occupations
The most common Services occupations in Julian are Cleaning & Maintenance (43 | 6.7%), and Food Preparation & Serving (13 | 2.0%).
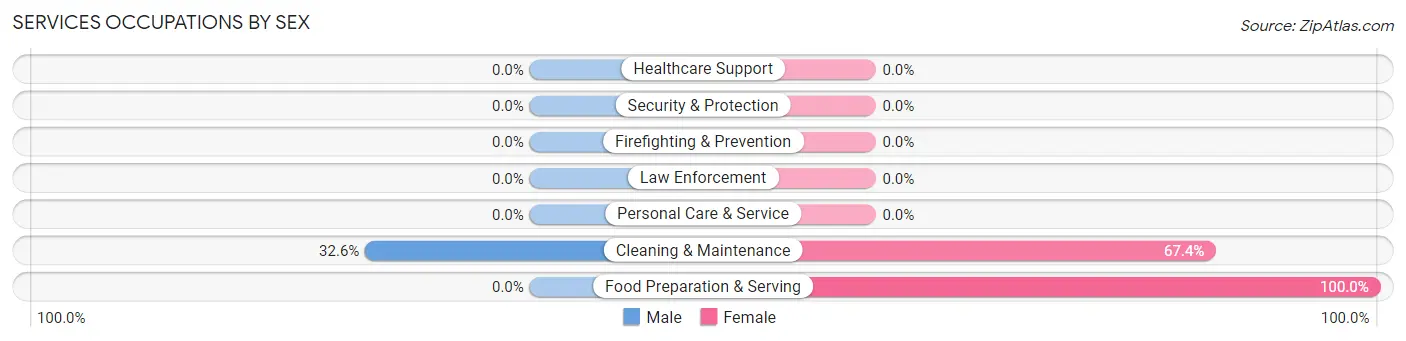
Services Occupations by Sex
| Occupation | Male | Female |
| Healthcare Support | 0 (0.0%) | 0 (0.0%) |
| Security & Protection | 0 (0.0%) | 0 (0.0%) |
| Firefighting & Prevention | 0 (0.0%) | 0 (0.0%) |
| Law Enforcement | 0 (0.0%) | 0 (0.0%) |
| Food Preparation & Serving | 0 (0.0%) | 13 (100.0%) |
| Cleaning & Maintenance | 14 (32.6%) | 29 (67.4%) |
| Personal Care & Service | 0 (0.0%) | 0 (0.0%) |
| Total (Category) | 14 (25.0%) | 42 (75.0%) |
| Total (Overall) | 404 (62.4%) | 243 (37.6%) |
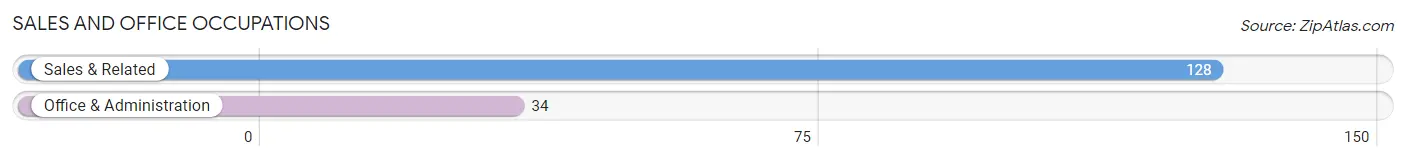
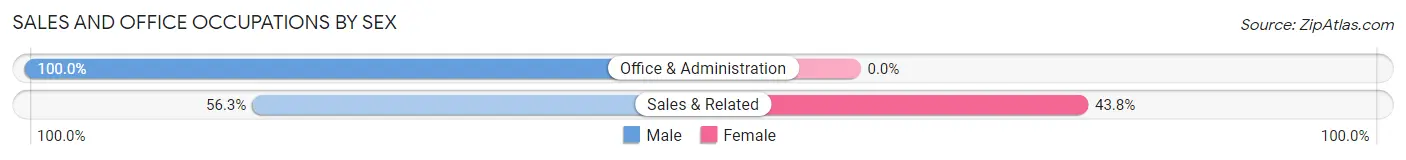
Sales and Office Occupations
The most common Sales and Office occupations in Julian are Sales & Related (128 | 19.8%), and Office & Administration (34 | 5.3%).
Sales and Office Occupations by Sex
| Occupation | Male | Female |
| Sales & Related | 72 (56.2%) | 56 (43.8%) |
| Office & Administration | 34 (100.0%) | 0 (0.0%) |
| Total (Category) | 106 (65.4%) | 56 (34.6%) |
| Total (Overall) | 404 (62.4%) | 243 (37.6%) |
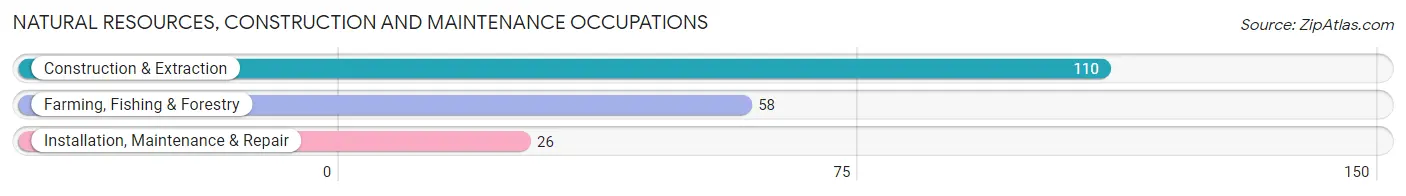
Natural Resources, Construction and Maintenance Occupations
The most common Natural Resources, Construction and Maintenance occupations in Julian are Construction & Extraction (110 | 17.0%), Farming, Fishing & Forestry (58 | 9.0%), and Installation, Maintenance & Repair (26 | 4.0%).
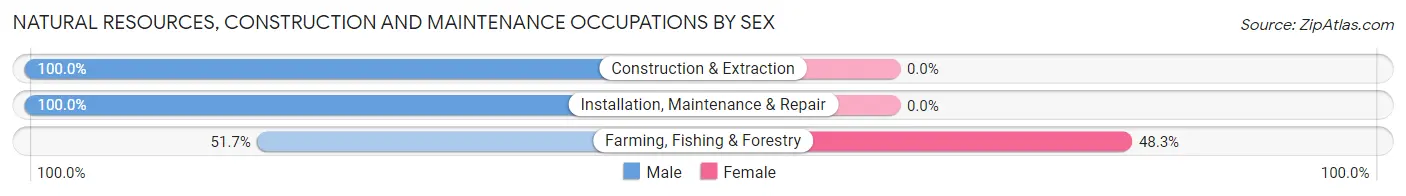
Natural Resources, Construction and Maintenance Occupations by Sex
| Occupation | Male | Female |
| Farming, Fishing & Forestry | 30 (51.7%) | 28 (48.3%) |
| Construction & Extraction | 110 (100.0%) | 0 (0.0%) |
| Installation, Maintenance & Repair | 26 (100.0%) | 0 (0.0%) |
| Total (Category) | 166 (85.6%) | 28 (14.4%) |
| Total (Overall) | 404 (62.4%) | 243 (37.6%) |
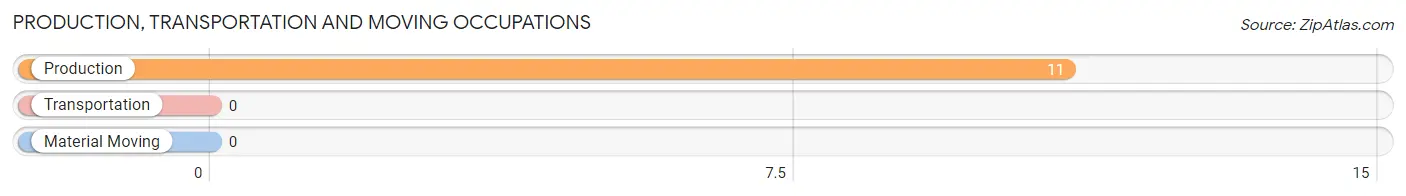
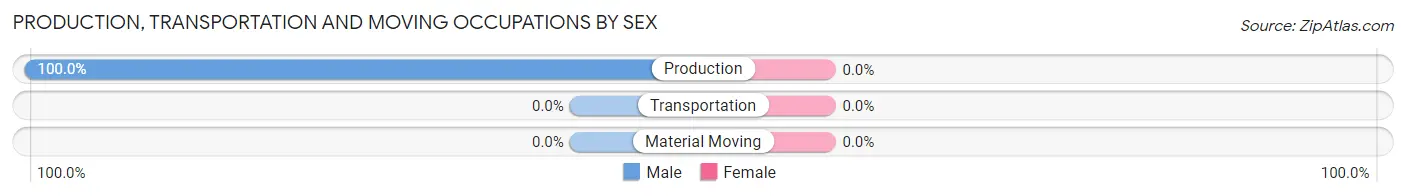
Production, Transportation and Moving Occupations
The most common Production, Transportation and Moving occupations in Julian are , and Production (11 | 1.7%).
Production, Transportation and Moving Occupations by Sex
| Occupation | Male | Female |
| Production | 11 (100.0%) | 0 (0.0%) |
| Transportation | 0 (0.0%) | 0 (0.0%) |
| Material Moving | 0 (0.0%) | 0 (0.0%) |
| Total (Category) | 11 (100.0%) | 0 (0.0%) |
| Total (Overall) | 404 (62.4%) | 243 (37.6%) |
Employment Industries by Sex in Julian
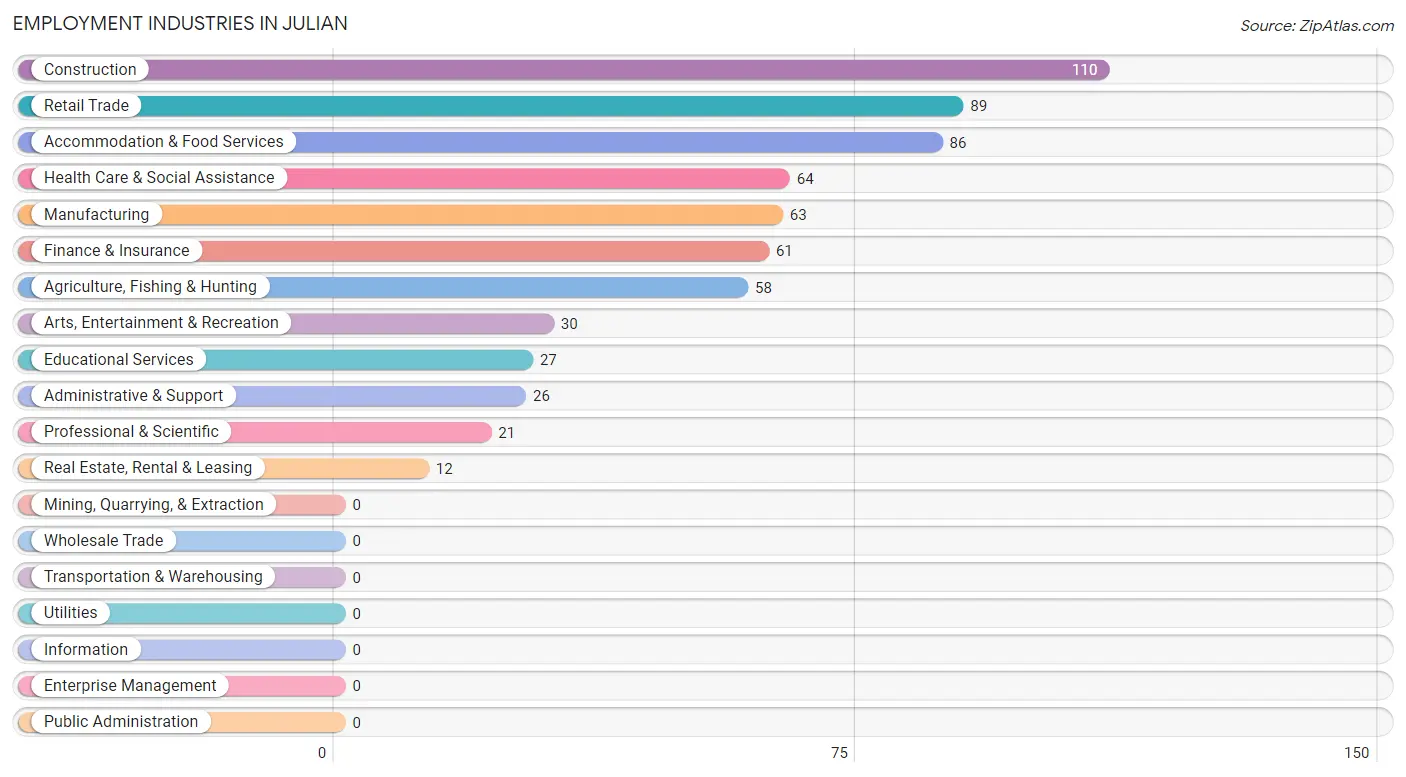
Employment Industries in Julian
The major employment industries in Julian include Construction (110 | 17.0%), Retail Trade (89 | 13.8%), Accommodation & Food Services (86 | 13.3%), Health Care & Social Assistance (64 | 9.9%), and Manufacturing (63 | 9.7%).
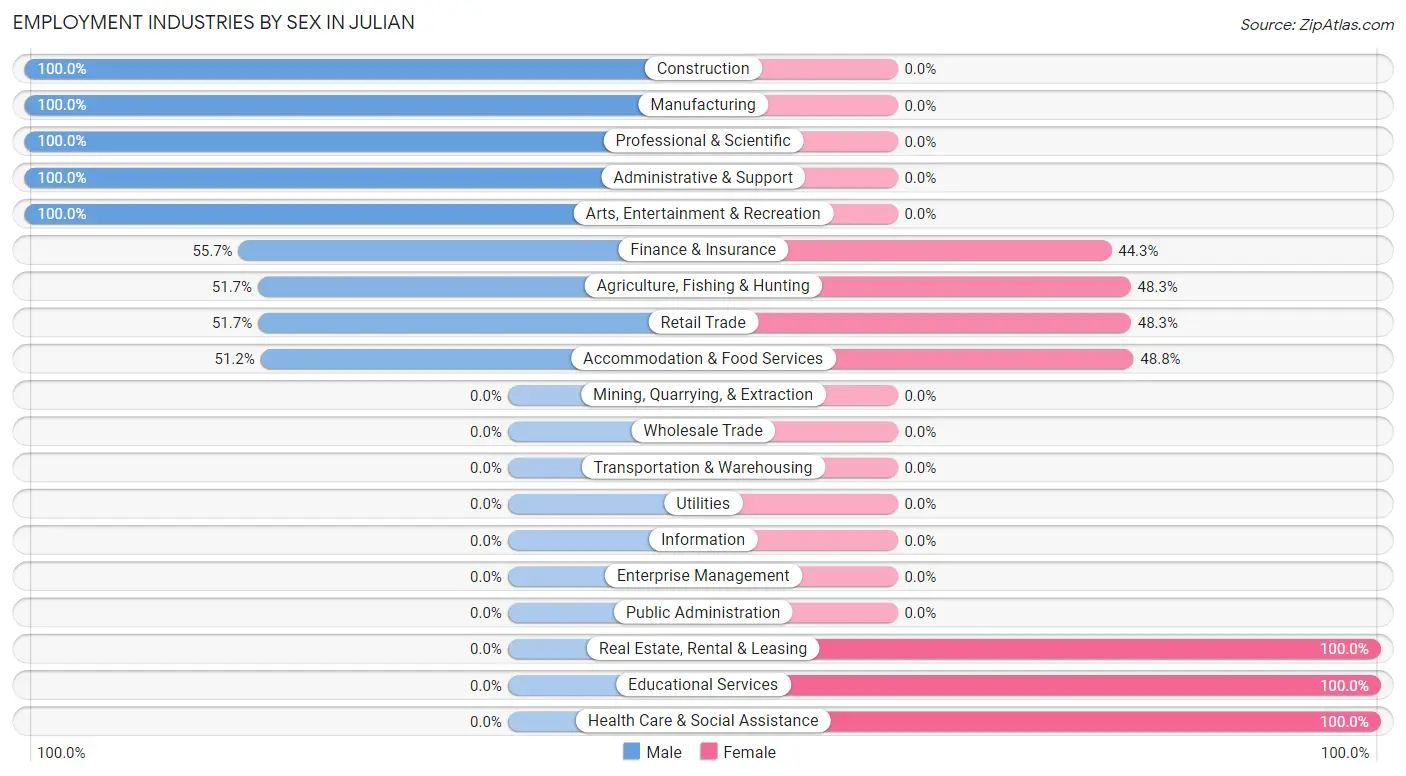
Employment Industries by Sex in Julian
The Julian industries that see more men than women are Construction (100.0%), Manufacturing (100.0%), and Professional & Scientific (100.0%), whereas the industries that tend to have a higher number of women are Real Estate, Rental & Leasing (100.0%), Educational Services (100.0%), and Health Care & Social Assistance (100.0%).
| Industry | Male | Female |
| Agriculture, Fishing & Hunting | 30 (51.7%) | 28 (48.3%) |
| Mining, Quarrying, & Extraction | 0 (0.0%) | 0 (0.0%) |
| Construction | 110 (100.0%) | 0 (0.0%) |
| Manufacturing | 63 (100.0%) | 0 (0.0%) |
| Wholesale Trade | 0 (0.0%) | 0 (0.0%) |
| Retail Trade | 46 (51.7%) | 43 (48.3%) |
| Transportation & Warehousing | 0 (0.0%) | 0 (0.0%) |
| Utilities | 0 (0.0%) | 0 (0.0%) |
| Information | 0 (0.0%) | 0 (0.0%) |
| Finance & Insurance | 34 (55.7%) | 27 (44.3%) |
| Real Estate, Rental & Leasing | 0 (0.0%) | 12 (100.0%) |
| Professional & Scientific | 21 (100.0%) | 0 (0.0%) |
| Enterprise Management | 0 (0.0%) | 0 (0.0%) |
| Administrative & Support | 26 (100.0%) | 0 (0.0%) |
| Educational Services | 0 (0.0%) | 27 (100.0%) |
| Health Care & Social Assistance | 0 (0.0%) | 64 (100.0%) |
| Arts, Entertainment & Recreation | 30 (100.0%) | 0 (0.0%) |
| Accommodation & Food Services | 44 (51.2%) | 42 (48.8%) |
| Public Administration | 0 (0.0%) | 0 (0.0%) |
| Total | 404 (62.4%) | 243 (37.6%) |
Education in Julian
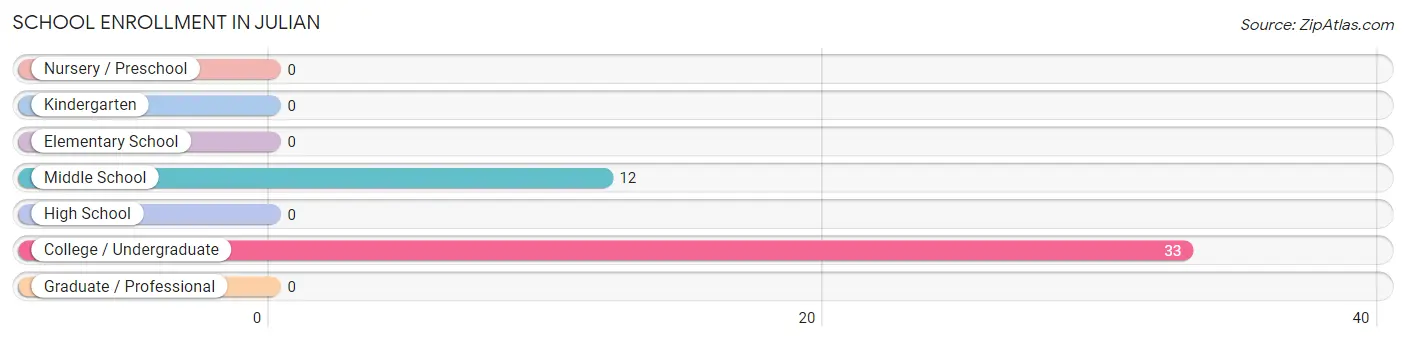
School Enrollment in Julian
The most common levels of schooling among the 45 students in Julian are college / undergraduate (33 | 73.3%), and middle school (12 | 26.7%).
| School Level | # Students | % Students |
| Nursery / Preschool | 0 | 0.0% |
| Kindergarten | 0 | 0.0% |
| Elementary School | 0 | 0.0% |
| Middle School | 12 | 26.7% |
| High School | 0 | 0.0% |
| College / Undergraduate | 33 | 73.3% |
| Graduate / Professional | 0 | 0.0% |
| Total | 45 | 100.0% |
School Enrollment by Age by Funding Source in Julian
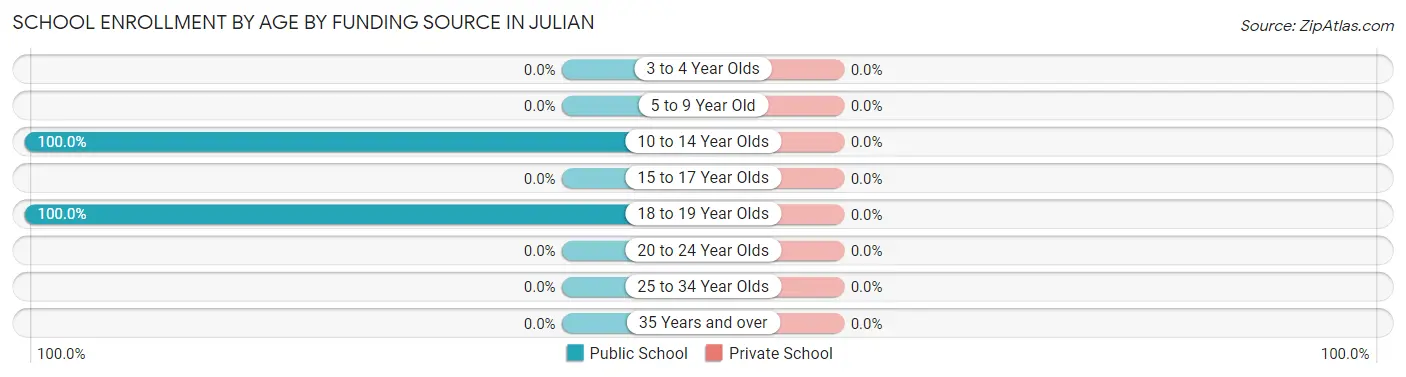
| Age Bracket | Public School | Private School |
| 3 to 4 Year Olds | 0 (0.0%) | 0 (0.0%) |
| 5 to 9 Year Old | 0 (0.0%) | 0 (0.0%) |
| 10 to 14 Year Olds | 12 (100.0%) | 0 (0.0%) |
| 15 to 17 Year Olds | 0 (0.0%) | 0 (0.0%) |
| 18 to 19 Year Olds | 33 (100.0%) | 0 (0.0%) |
| 20 to 24 Year Olds | 0 (0.0%) | 0 (0.0%) |
| 25 to 34 Year Olds | 0 (0.0%) | 0 (0.0%) |
| 35 Years and over | 0 (0.0%) | 0 (0.0%) |
| Total | 45 (100.0%) | 0 (0.0%) |
Educational Attainment by Field of Study in Julian
Science & technology (197 | 52.5%), bio, nature & agricultural (58 | 15.5%), visual & performing arts (30 | 8.0%), business (26 | 6.9%), and literature & languages (26 | 6.9%) are the most common fields of study among 375 individuals in Julian who have obtained a bachelor's degree or higher.
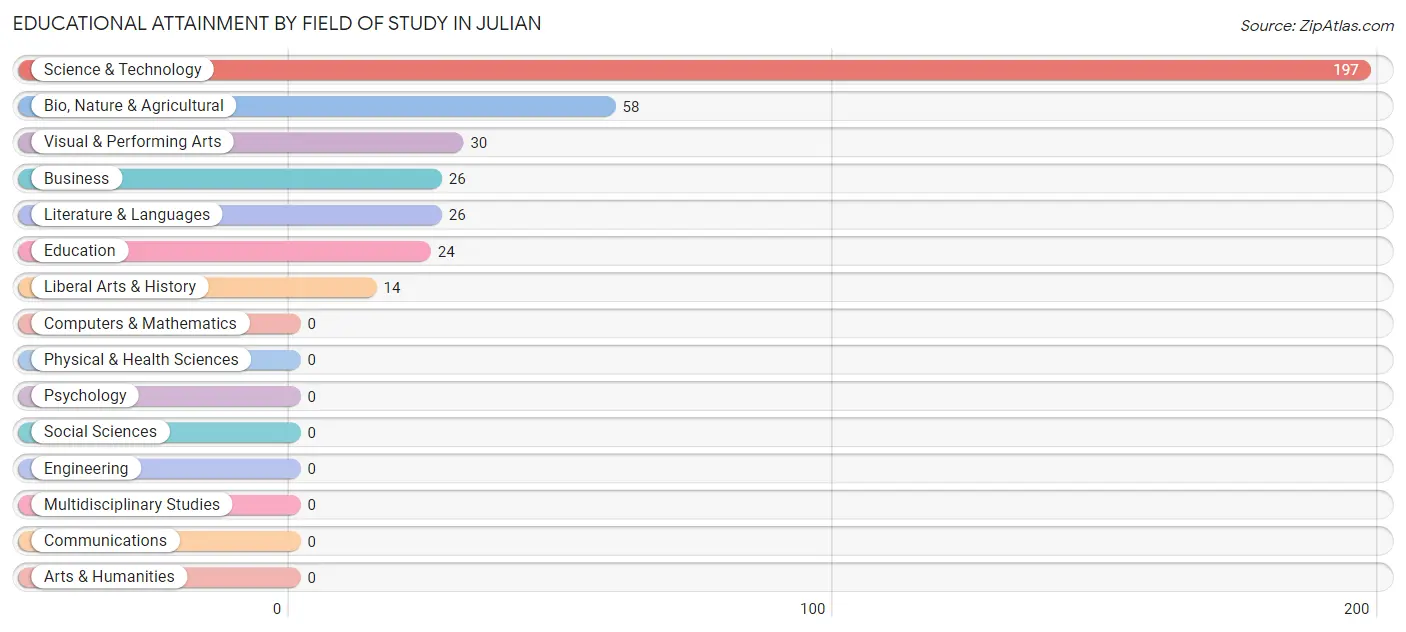
| Field of Study | # Graduates | % Graduates |
| Computers & Mathematics | 0 | 0.0% |
| Bio, Nature & Agricultural | 58 | 15.5% |
| Physical & Health Sciences | 0 | 0.0% |
| Psychology | 0 | 0.0% |
| Social Sciences | 0 | 0.0% |
| Engineering | 0 | 0.0% |
| Multidisciplinary Studies | 0 | 0.0% |
| Science & Technology | 197 | 52.5% |
| Business | 26 | 6.9% |
| Education | 24 | 6.4% |
| Literature & Languages | 26 | 6.9% |
| Liberal Arts & History | 14 | 3.7% |
| Visual & Performing Arts | 30 | 8.0% |
| Communications | 0 | 0.0% |
| Arts & Humanities | 0 | 0.0% |
| Total | 375 | 100.0% |
Transportation & Commute in Julian
Vehicle Availability by Sex in Julian
The most prevalent vehicle ownership categories in Julian are males with 3 vehicles (218, accounting for 54.0%) and females with 3 vehicles (68, making up 89.7%).
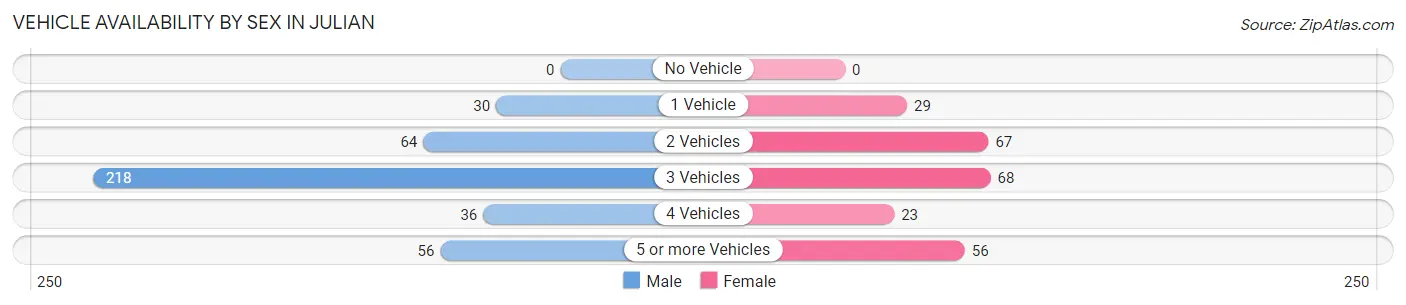
| Vehicles Available | Male | Female |
| No Vehicle | 0 (0.0%) | 0 (0.0%) |
| 1 Vehicle | 30 (7.4%) | 29 (11.9%) |
| 2 Vehicles | 64 (15.8%) | 67 (27.6%) |
| 3 Vehicles | 218 (54.0%) | 68 (28.0%) |
| 4 Vehicles | 36 (8.9%) | 23 (9.5%) |
| 5 or more Vehicles | 56 (13.9%) | 56 (23.1%) |
| Total | 404 (100.0%) | 243 (100.0%) |
Commute Time in Julian
The most frequently occuring commute durations in Julian are 60 to 89 minutes (107 commuters, 25.7%), 45 to 59 minutes (106 commuters, 25.5%), and 20 to 24 minutes (85 commuters, 20.4%).
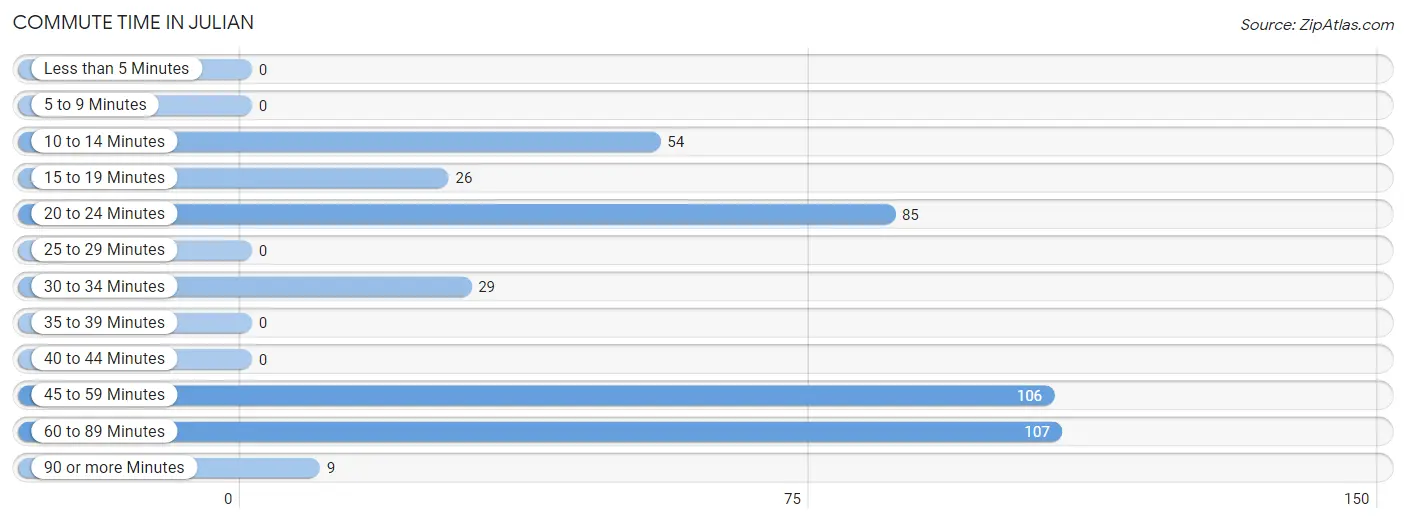
| Commute Time | # Commuters | % Commuters |
| Less than 5 Minutes | 0 | 0.0% |
| 5 to 9 Minutes | 0 | 0.0% |
| 10 to 14 Minutes | 54 | 13.0% |
| 15 to 19 Minutes | 26 | 6.2% |
| 20 to 24 Minutes | 85 | 20.4% |
| 25 to 29 Minutes | 0 | 0.0% |
| 30 to 34 Minutes | 29 | 7.0% |
| 35 to 39 Minutes | 0 | 0.0% |
| 40 to 44 Minutes | 0 | 0.0% |
| 45 to 59 Minutes | 106 | 25.5% |
| 60 to 89 Minutes | 107 | 25.7% |
| 90 or more Minutes | 9 | 2.2% |
Commute Time by Sex in Julian
The most common commute times in Julian are 45 to 59 minutes (106 commuters, 35.9%) for males and 10 to 14 minutes (40 commuters, 33.1%) for females.
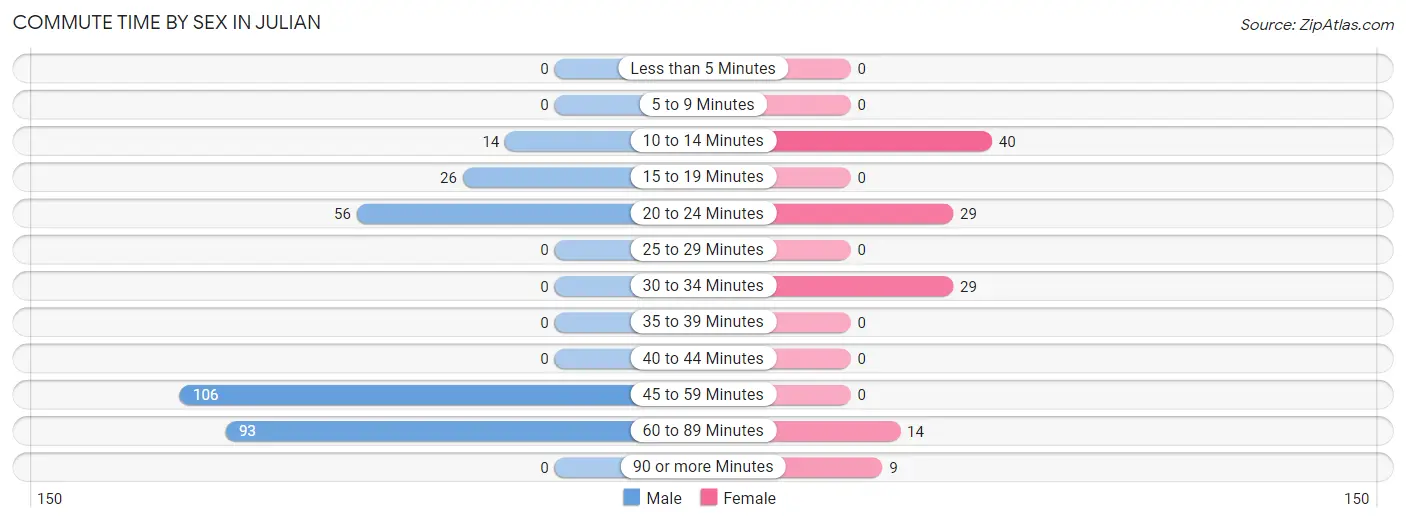
| Commute Time | Male | Female |
| Less than 5 Minutes | 0 (0.0%) | 0 (0.0%) |
| 5 to 9 Minutes | 0 (0.0%) | 0 (0.0%) |
| 10 to 14 Minutes | 14 (4.8%) | 40 (33.1%) |
| 15 to 19 Minutes | 26 (8.8%) | 0 (0.0%) |
| 20 to 24 Minutes | 56 (19.0%) | 29 (24.0%) |
| 25 to 29 Minutes | 0 (0.0%) | 0 (0.0%) |
| 30 to 34 Minutes | 0 (0.0%) | 29 (24.0%) |
| 35 to 39 Minutes | 0 (0.0%) | 0 (0.0%) |
| 40 to 44 Minutes | 0 (0.0%) | 0 (0.0%) |
| 45 to 59 Minutes | 106 (35.9%) | 0 (0.0%) |
| 60 to 89 Minutes | 93 (31.5%) | 14 (11.6%) |
| 90 or more Minutes | 0 (0.0%) | 9 (7.4%) |
Time of Departure to Work by Sex in Julian
The most frequent times of departure to work in Julian are 6:00 AM to 6:29 AM (136, 46.1%) for males and 6:00 AM to 6:29 AM (29, 24.0%) for females.
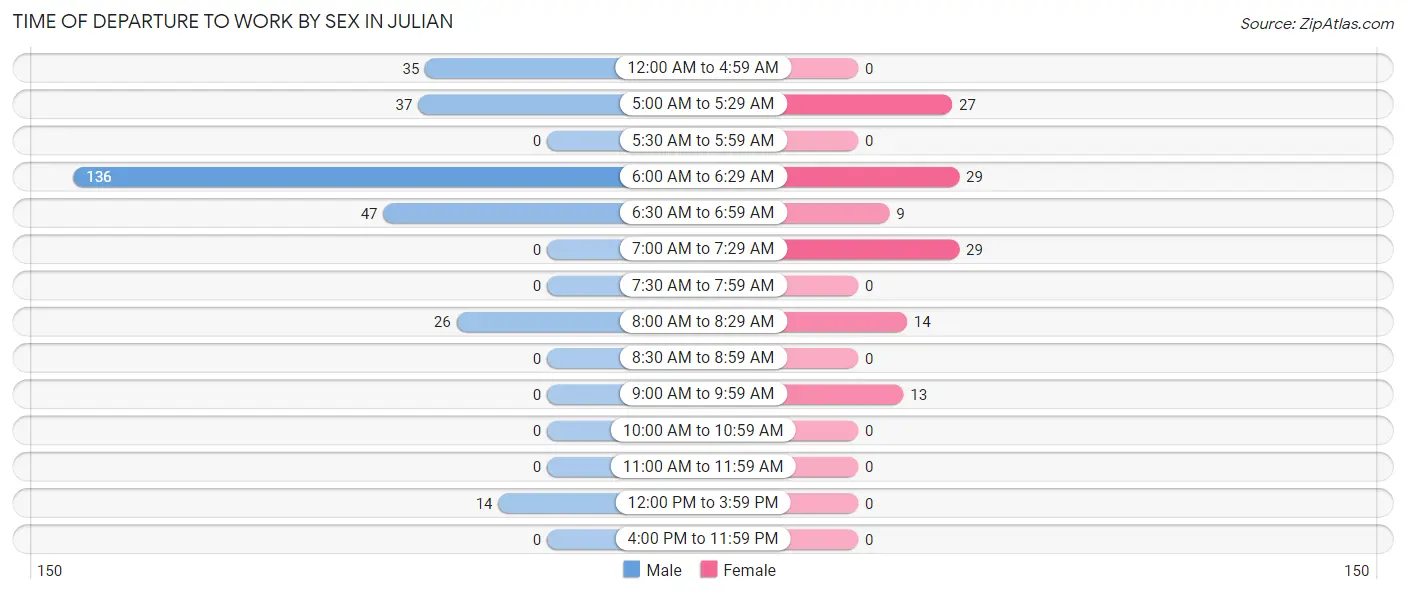
| Time of Departure | Male | Female |
| 12:00 AM to 4:59 AM | 35 (11.9%) | 0 (0.0%) |
| 5:00 AM to 5:29 AM | 37 (12.5%) | 27 (22.3%) |
| 5:30 AM to 5:59 AM | 0 (0.0%) | 0 (0.0%) |
| 6:00 AM to 6:29 AM | 136 (46.1%) | 29 (24.0%) |
| 6:30 AM to 6:59 AM | 47 (15.9%) | 9 (7.4%) |
| 7:00 AM to 7:29 AM | 0 (0.0%) | 29 (24.0%) |
| 7:30 AM to 7:59 AM | 0 (0.0%) | 0 (0.0%) |
| 8:00 AM to 8:29 AM | 26 (8.8%) | 14 (11.6%) |
| 8:30 AM to 8:59 AM | 0 (0.0%) | 0 (0.0%) |
| 9:00 AM to 9:59 AM | 0 (0.0%) | 13 (10.7%) |
| 10:00 AM to 10:59 AM | 0 (0.0%) | 0 (0.0%) |
| 11:00 AM to 11:59 AM | 0 (0.0%) | 0 (0.0%) |
| 12:00 PM to 3:59 PM | 14 (4.8%) | 0 (0.0%) |
| 4:00 PM to 11:59 PM | 0 (0.0%) | 0 (0.0%) |
| Total | 295 (100.0%) | 121 (100.0%) |
Housing Occupancy in Julian
Occupancy by Ownership in Julian
Of the total 762 dwellings in Julian, owner-occupied units account for 651 (85.4%), while renter-occupied units make up 111 (14.6%).
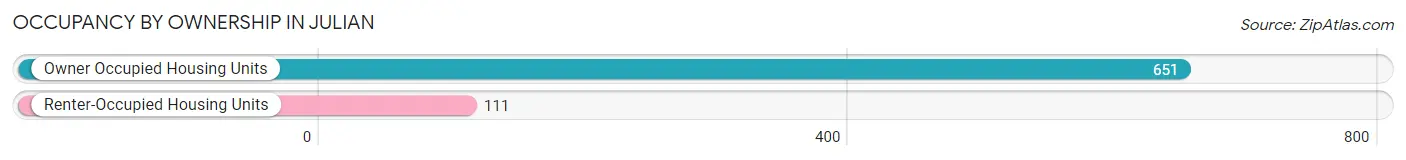
| Occupancy | # Housing Units | % Housing Units |
| Owner Occupied Housing Units | 651 | 85.4% |
| Renter-Occupied Housing Units | 111 | 14.6% |
| Total Occupied Housing Units | 762 | 100.0% |
Occupancy by Household Size in Julian
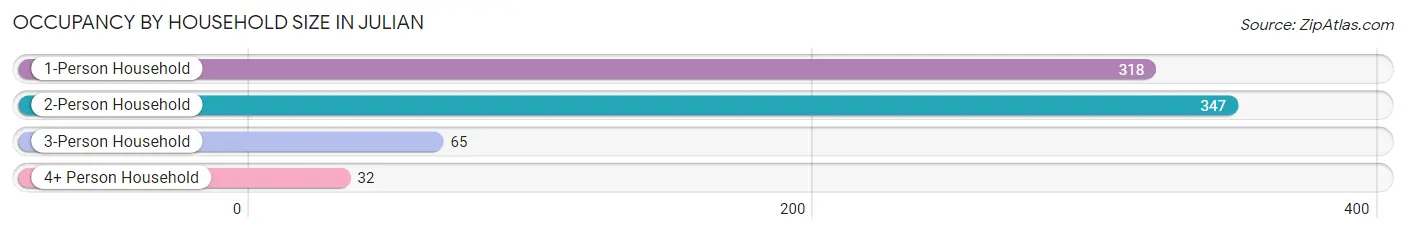
| Household Size | # Housing Units | % Housing Units |
| 1-Person Household | 318 | 41.7% |
| 2-Person Household | 347 | 45.5% |
| 3-Person Household | 65 | 8.5% |
| 4+ Person Household | 32 | 4.2% |
| Total Housing Units | 762 | 100.0% |
Occupancy by Ownership by Household Size in Julian
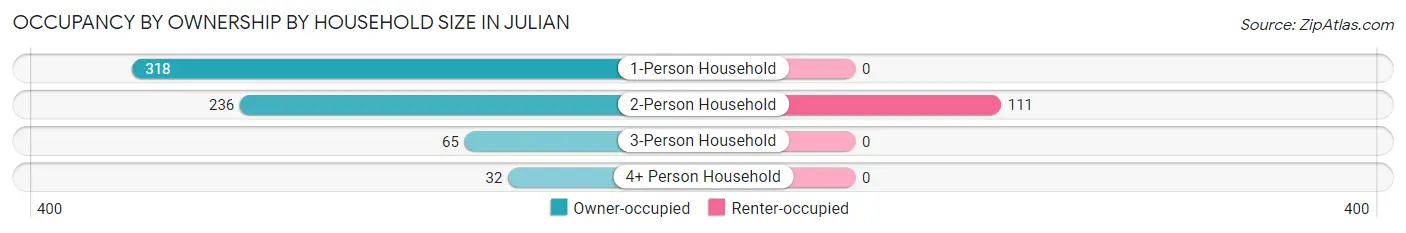
| Household Size | Owner-occupied | Renter-occupied |
| 1-Person Household | 318 (100.0%) | 0 (0.0%) |
| 2-Person Household | 236 (68.0%) | 111 (32.0%) |
| 3-Person Household | 65 (100.0%) | 0 (0.0%) |
| 4+ Person Household | 32 (100.0%) | 0 (0.0%) |
| Total Housing Units | 651 (85.4%) | 111 (14.6%) |
Occupancy by Educational Attainment in Julian
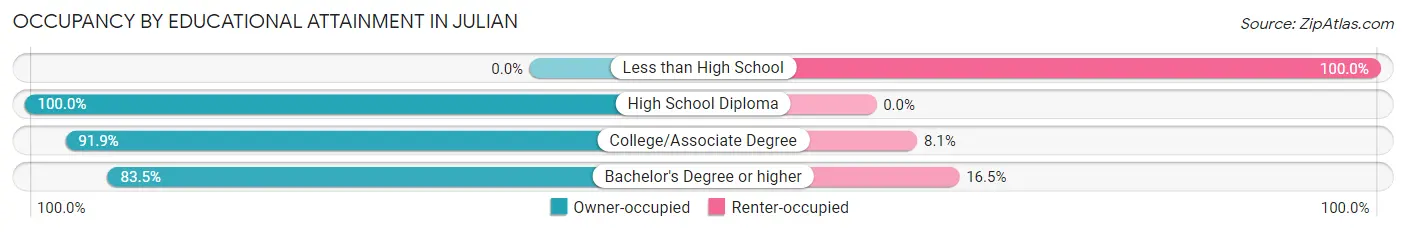
| Household Size | Owner-occupied | Renter-occupied |
| Less than High School | 0 (0.0%) | 30 (100.0%) |
| High School Diploma | 77 (100.0%) | 0 (0.0%) |
| College/Associate Degree | 295 (91.9%) | 26 (8.1%) |
| Bachelor's Degree or higher | 279 (83.5%) | 55 (16.5%) |
Occupancy by Age of Householder in Julian
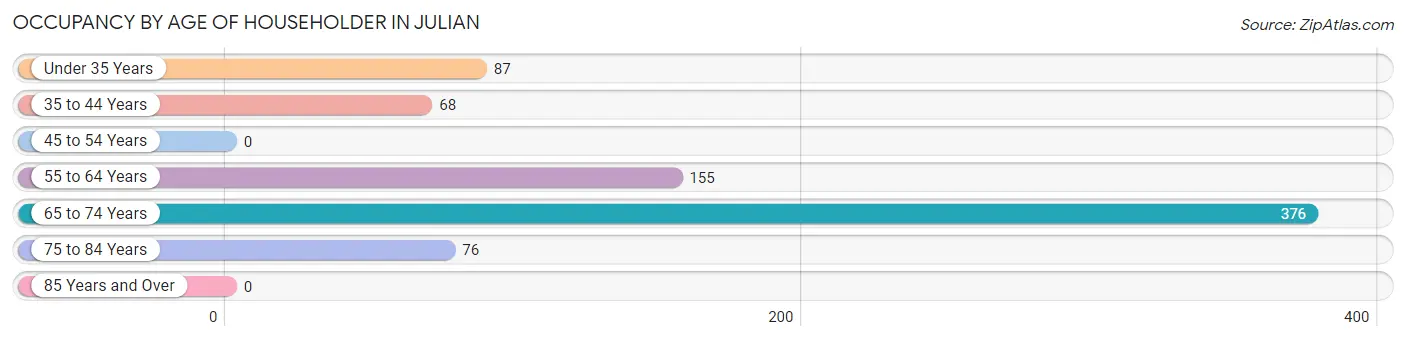
| Age Bracket | # Households | % Households |
| Under 35 Years | 87 | 11.4% |
| 35 to 44 Years | 68 | 8.9% |
| 45 to 54 Years | 0 | 0.0% |
| 55 to 64 Years | 155 | 20.3% |
| 65 to 74 Years | 376 | 49.3% |
| 75 to 84 Years | 76 | 10.0% |
| 85 Years and Over | 0 | 0.0% |
| Total | 762 | 100.0% |
Housing Finances in Julian
Median Income by Occupancy in Julian
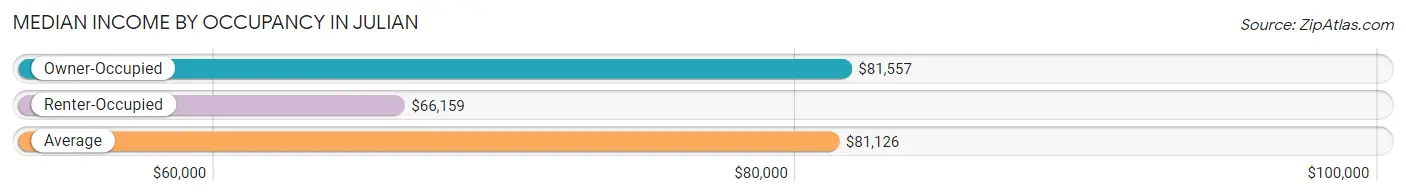
| Occupancy Type | # Households | Median Income |
| Owner-Occupied | 651 (85.4%) | $81,557 |
| Renter-Occupied | 111 (14.6%) | $66,159 |
| Average | 762 (100.0%) | $81,126 |
Occupancy by Householder Income Bracket in Julian
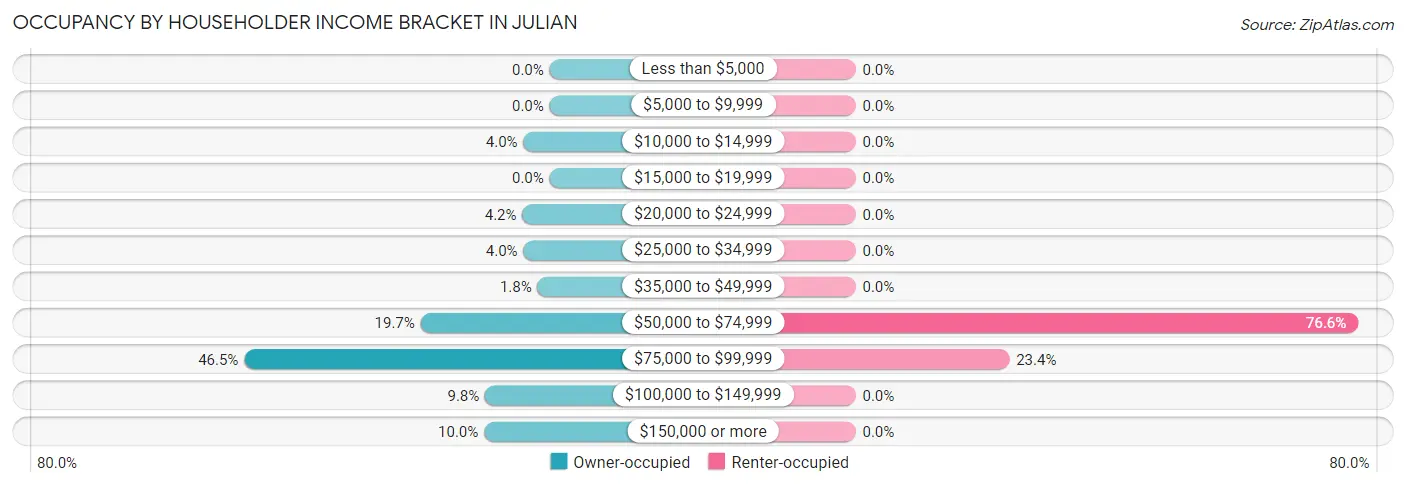
| Income Bracket | Owner-occupied | Renter-occupied |
| Less than $5,000 | 0 (0.0%) | 0 (0.0%) |
| $5,000 to $9,999 | 0 (0.0%) | 0 (0.0%) |
| $10,000 to $14,999 | 26 (4.0%) | 0 (0.0%) |
| $15,000 to $19,999 | 0 (0.0%) | 0 (0.0%) |
| $20,000 to $24,999 | 27 (4.2%) | 0 (0.0%) |
| $25,000 to $34,999 | 26 (4.0%) | 0 (0.0%) |
| $35,000 to $49,999 | 12 (1.8%) | 0 (0.0%) |
| $50,000 to $74,999 | 128 (19.7%) | 85 (76.6%) |
| $75,000 to $99,999 | 303 (46.5%) | 26 (23.4%) |
| $100,000 to $149,999 | 64 (9.8%) | 0 (0.0%) |
| $150,000 or more | 65 (10.0%) | 0 (0.0%) |
| Total | 651 (100.0%) | 111 (100.0%) |
Monthly Housing Cost Tiers in Julian
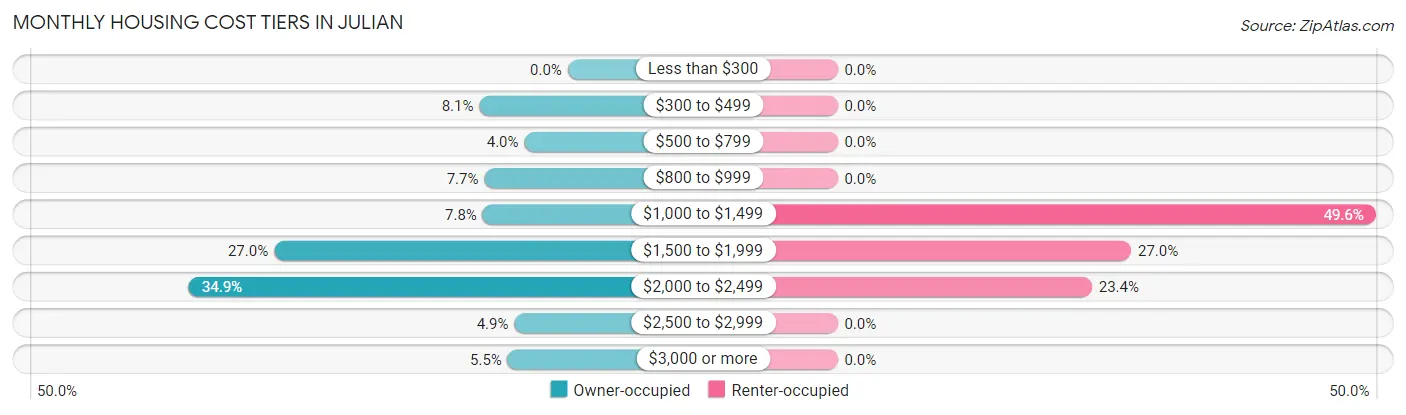
| Monthly Cost | Owner-occupied | Renter-occupied |
| Less than $300 | 0 (0.0%) | 0 (0.0%) |
| $300 to $499 | 53 (8.1%) | 0 (0.0%) |
| $500 to $799 | 26 (4.0%) | 0 (0.0%) |
| $800 to $999 | 50 (7.7%) | 0 (0.0%) |
| $1,000 to $1,499 | 51 (7.8%) | 55 (49.5%) |
| $1,500 to $1,999 | 176 (27.0%) | 30 (27.0%) |
| $2,000 to $2,499 | 227 (34.9%) | 26 (23.4%) |
| $2,500 to $2,999 | 32 (4.9%) | 0 (0.0%) |
| $3,000 or more | 36 (5.5%) | 0 (0.0%) |
| Total | 651 (100.0%) | 111 (100.0%) |
Physical Housing Characteristics in Julian
Housing Structures in Julian
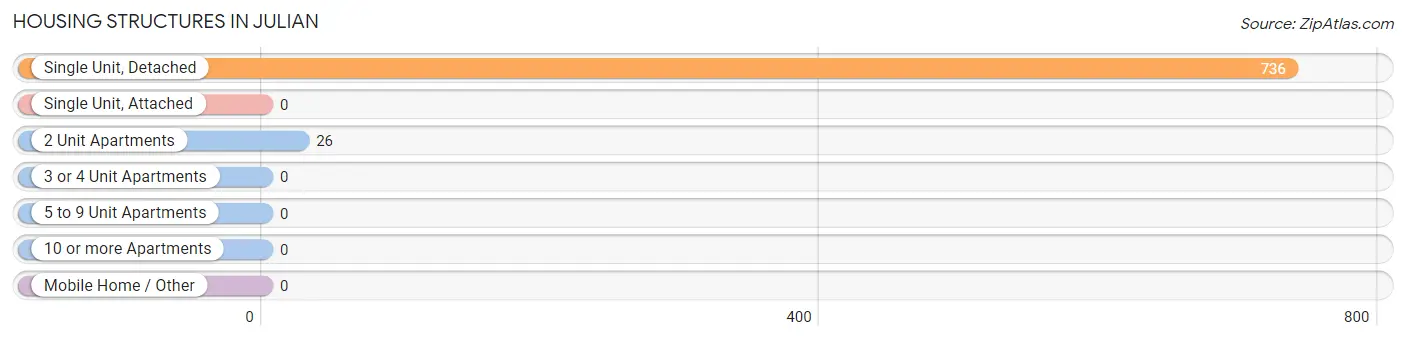
| Structure Type | # Housing Units | % Housing Units |
| Single Unit, Detached | 736 | 96.6% |
| Single Unit, Attached | 0 | 0.0% |
| 2 Unit Apartments | 26 | 3.4% |
| 3 or 4 Unit Apartments | 0 | 0.0% |
| 5 to 9 Unit Apartments | 0 | 0.0% |
| 10 or more Apartments | 0 | 0.0% |
| Mobile Home / Other | 0 | 0.0% |
| Total | 762 | 100.0% |
Housing Structures by Occupancy in Julian
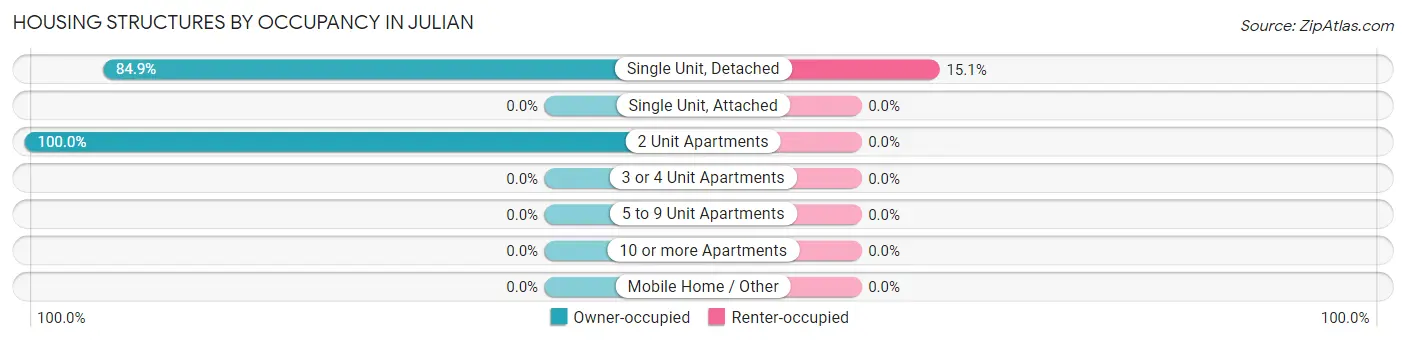
| Structure Type | Owner-occupied | Renter-occupied |
| Single Unit, Detached | 625 (84.9%) | 111 (15.1%) |
| Single Unit, Attached | 0 (0.0%) | 0 (0.0%) |
| 2 Unit Apartments | 26 (100.0%) | 0 (0.0%) |
| 3 or 4 Unit Apartments | 0 (0.0%) | 0 (0.0%) |
| 5 to 9 Unit Apartments | 0 (0.0%) | 0 (0.0%) |
| 10 or more Apartments | 0 (0.0%) | 0 (0.0%) |
| Mobile Home / Other | 0 (0.0%) | 0 (0.0%) |
| Total | 651 (85.4%) | 111 (14.6%) |
Housing Structures by Number of Rooms in Julian
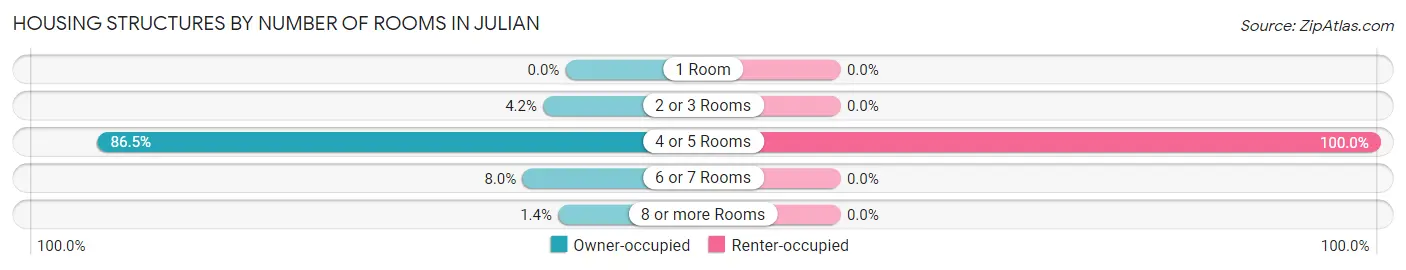
| Number of Rooms | Owner-occupied | Renter-occupied |
| 1 Room | 0 (0.0%) | 0 (0.0%) |
| 2 or 3 Rooms | 27 (4.2%) | 0 (0.0%) |
| 4 or 5 Rooms | 563 (86.5%) | 111 (100.0%) |
| 6 or 7 Rooms | 52 (8.0%) | 0 (0.0%) |
| 8 or more Rooms | 9 (1.4%) | 0 (0.0%) |
| Total | 651 (100.0%) | 111 (100.0%) |
Housing Structure by Heating Type in Julian
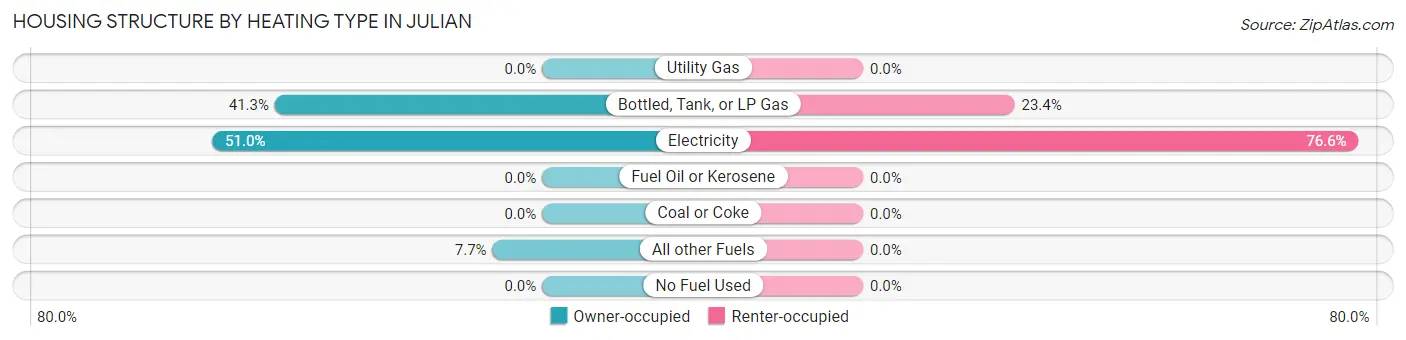
| Heating Type | Owner-occupied | Renter-occupied |
| Utility Gas | 0 (0.0%) | 0 (0.0%) |
| Bottled, Tank, or LP Gas | 269 (41.3%) | 26 (23.4%) |
| Electricity | 332 (51.0%) | 85 (76.6%) |
| Fuel Oil or Kerosene | 0 (0.0%) | 0 (0.0%) |
| Coal or Coke | 0 (0.0%) | 0 (0.0%) |
| All other Fuels | 50 (7.7%) | 0 (0.0%) |
| No Fuel Used | 0 (0.0%) | 0 (0.0%) |
| Total | 651 (100.0%) | 111 (100.0%) |
Household Vehicle Usage in Julian
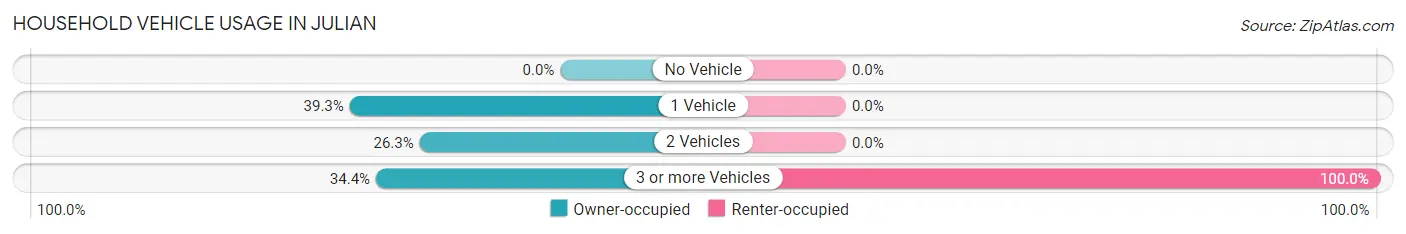
| Vehicles per Household | Owner-occupied | Renter-occupied |
| No Vehicle | 0 (0.0%) | 0 (0.0%) |
| 1 Vehicle | 256 (39.3%) | 0 (0.0%) |
| 2 Vehicles | 171 (26.3%) | 0 (0.0%) |
| 3 or more Vehicles | 224 (34.4%) | 111 (100.0%) |
| Total | 651 (100.0%) | 111 (100.0%) |
Real Estate & Mortgages in Julian
Real Estate and Mortgage Overview in Julian
| Characteristic | Without Mortgage | With Mortgage |
| Housing Units | 115 | 536 |
| Median Property Value | $458,700 | $591,800 |
| Median Household Income | - | - |
| Monthly Housing Costs | $617 | $36 |
| Real Estate Taxes | $2,594 | $9 |
Property Value by Mortgage Status in Julian
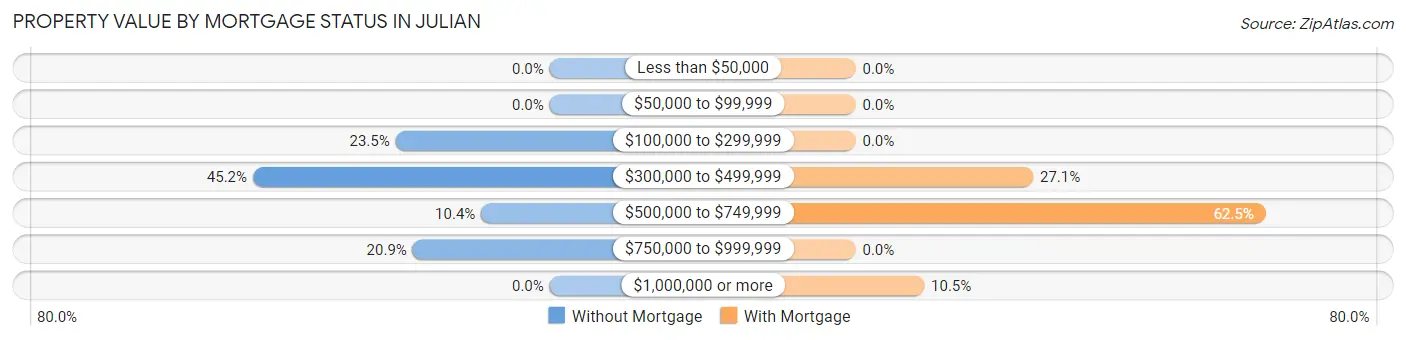
| Property Value | Without Mortgage | With Mortgage |
| Less than $50,000 | 0 (0.0%) | 0 (0.0%) |
| $50,000 to $99,999 | 0 (0.0%) | 0 (0.0%) |
| $100,000 to $299,999 | 27 (23.5%) | 0 (0.0%) |
| $300,000 to $499,999 | 52 (45.2%) | 145 (27.1%) |
| $500,000 to $749,999 | 12 (10.4%) | 335 (62.5%) |
| $750,000 to $999,999 | 24 (20.9%) | 0 (0.0%) |
| $1,000,000 or more | 0 (0.0%) | 56 (10.4%) |
| Total | 115 (100.0%) | 536 (100.0%) |
Household Income by Mortgage Status in Julian
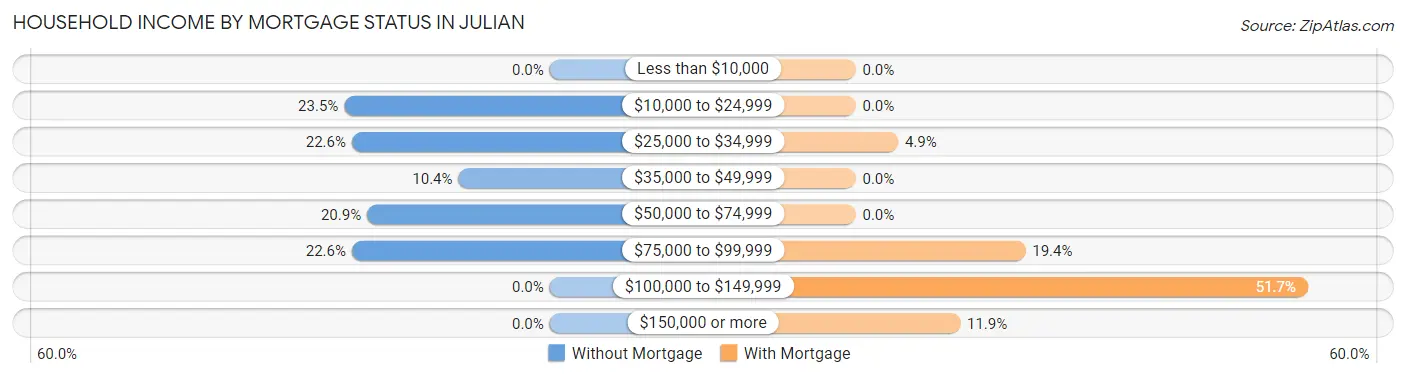
| Household Income | Without Mortgage | With Mortgage |
| Less than $10,000 | 0 (0.0%) | 0 (0.0%) |
| $10,000 to $24,999 | 27 (23.5%) | 0 (0.0%) |
| $25,000 to $34,999 | 26 (22.6%) | 26 (4.9%) |
| $35,000 to $49,999 | 12 (10.4%) | 0 (0.0%) |
| $50,000 to $74,999 | 24 (20.9%) | 0 (0.0%) |
| $75,000 to $99,999 | 26 (22.6%) | 104 (19.4%) |
| $100,000 to $149,999 | 0 (0.0%) | 277 (51.7%) |
| $150,000 or more | 0 (0.0%) | 64 (11.9%) |
| Total | 115 (100.0%) | 536 (100.0%) |
Property Value to Household Income Ratio in Julian
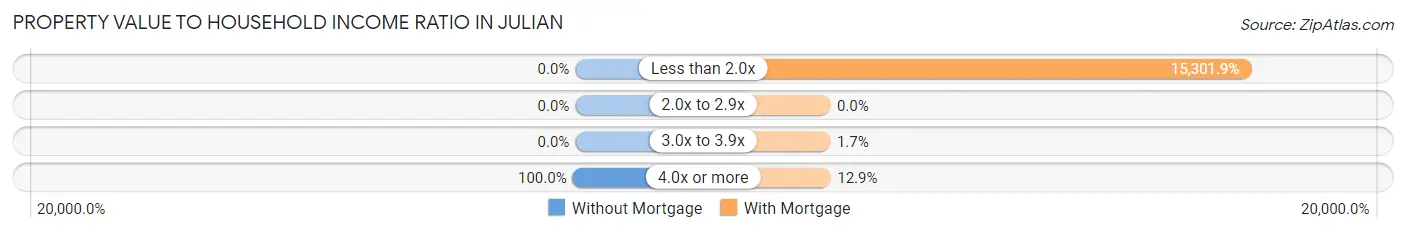
| Value-to-Income Ratio | Without Mortgage | With Mortgage |
| Less than 2.0x | 0 (0.0%) | 82,018 (15,301.9%) |
| 2.0x to 2.9x | 0 (0.0%) | 0 (0.0%) |
| 3.0x to 3.9x | 0 (0.0%) | 9 (1.7%) |
| 4.0x or more | 115 (100.0%) | 69 (12.9%) |
| Total | 115 (100.0%) | 536 (100.0%) |
Real Estate Taxes by Mortgage Status in Julian
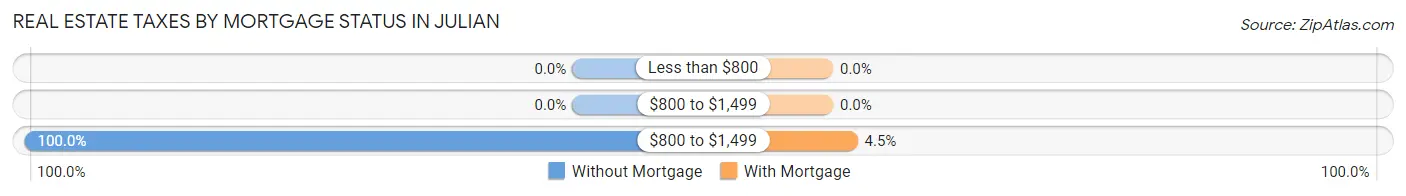
| Property Taxes | Without Mortgage | With Mortgage |
| Less than $800 | 0 (0.0%) | 0 (0.0%) |
| $800 to $1,499 | 0 (0.0%) | 0 (0.0%) |
| $800 to $1,499 | 115 (100.0%) | 24 (4.5%) |
| Total | 115 (100.0%) | 536 (100.0%) |
Health & Disability in Julian
Health Insurance Coverage by Age in Julian
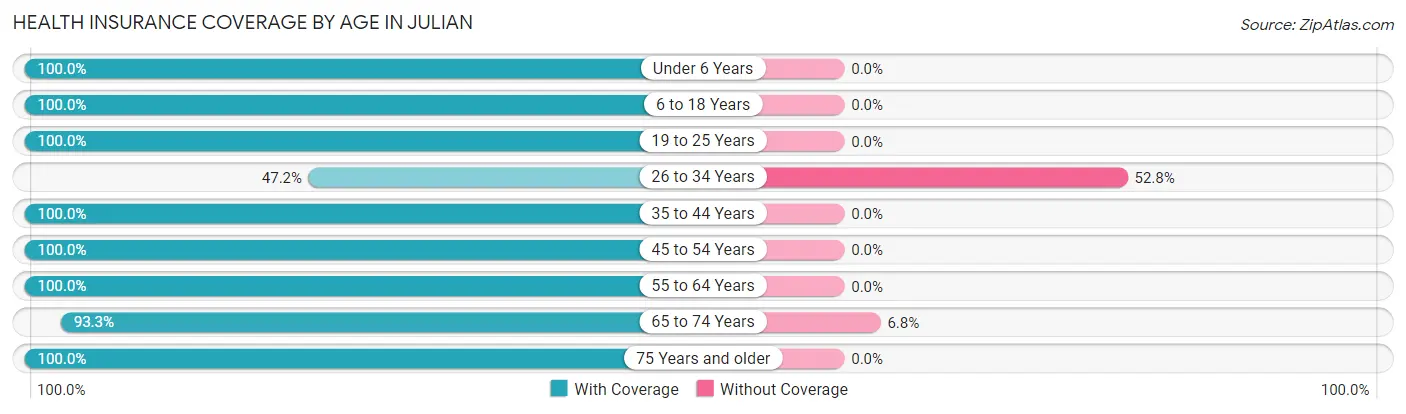
| Age Bracket | With Coverage | Without Coverage |
| Under 6 Years | 68 (100.0%) | 0 (0.0%) |
| 6 to 18 Years | 74 (100.0%) | 0 (0.0%) |
| 19 to 25 Years | 69 (100.0%) | 0 (0.0%) |
| 26 to 34 Years | 67 (47.2%) | 75 (52.8%) |
| 35 to 44 Years | 152 (100.0%) | 0 (0.0%) |
| 45 to 54 Years | 27 (100.0%) | 0 (0.0%) |
| 55 to 64 Years | 235 (100.0%) | 0 (0.0%) |
| 65 to 74 Years | 428 (93.2%) | 31 (6.8%) |
| 75 Years and older | 151 (100.0%) | 0 (0.0%) |
| Total | 1,271 (92.3%) | 106 (7.7%) |
Health Insurance Coverage by Citizenship Status in Julian
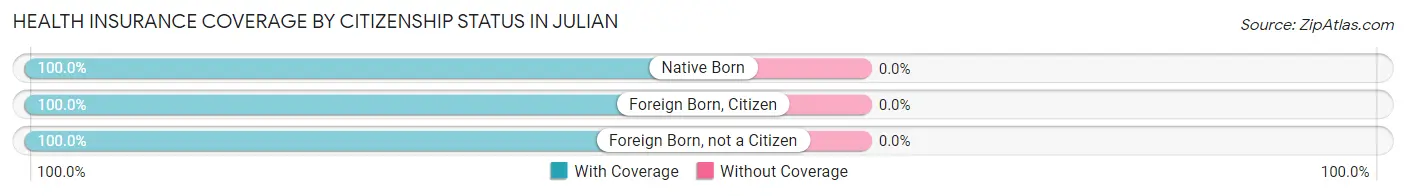
| Citizenship Status | With Coverage | Without Coverage |
| Native Born | 68 (100.0%) | 0 (0.0%) |
| Foreign Born, Citizen | 74 (100.0%) | 0 (0.0%) |
| Foreign Born, not a Citizen | 69 (100.0%) | 0 (0.0%) |
Health Insurance Coverage by Household Income in Julian
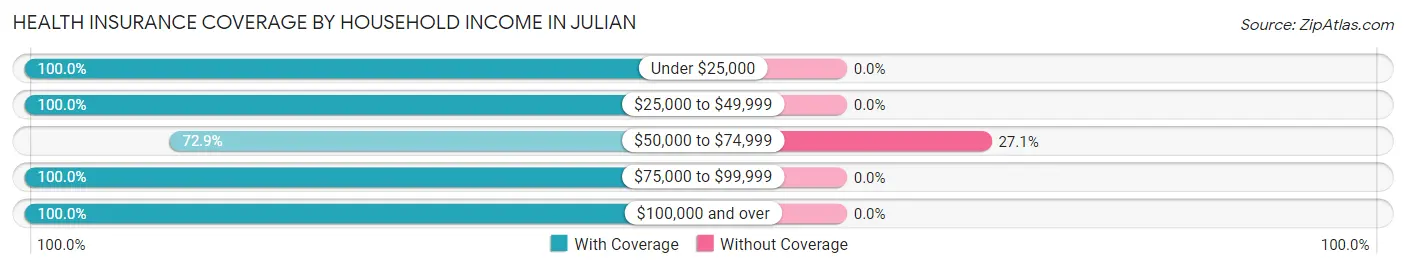
| Household Income | With Coverage | Without Coverage |
| Under $25,000 | 53 (100.0%) | 0 (0.0%) |
| $25,000 to $49,999 | 38 (100.0%) | 0 (0.0%) |
| $50,000 to $74,999 | 285 (72.9%) | 106 (27.1%) |
| $75,000 to $99,999 | 606 (100.0%) | 0 (0.0%) |
| $100,000 and over | 289 (100.0%) | 0 (0.0%) |
Public vs Private Health Insurance Coverage by Age in Julian
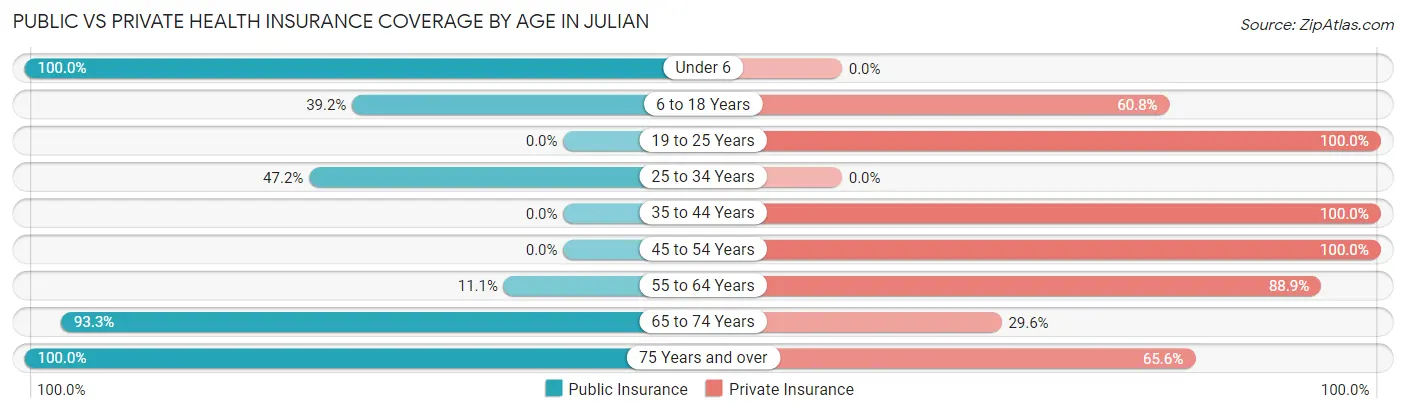
| Age Bracket | Public Insurance | Private Insurance |
| Under 6 | 68 (100.0%) | 0 (0.0%) |
| 6 to 18 Years | 29 (39.2%) | 45 (60.8%) |
| 19 to 25 Years | 0 (0.0%) | 69 (100.0%) |
| 25 to 34 Years | 67 (47.2%) | 0 (0.0%) |
| 35 to 44 Years | 0 (0.0%) | 152 (100.0%) |
| 45 to 54 Years | 0 (0.0%) | 27 (100.0%) |
| 55 to 64 Years | 26 (11.1%) | 209 (88.9%) |
| 65 to 74 Years | 428 (93.2%) | 136 (29.6%) |
| 75 Years and over | 151 (100.0%) | 99 (65.6%) |
| Total | 769 (55.8%) | 737 (53.5%) |
Disability Status by Sex by Age in Julian
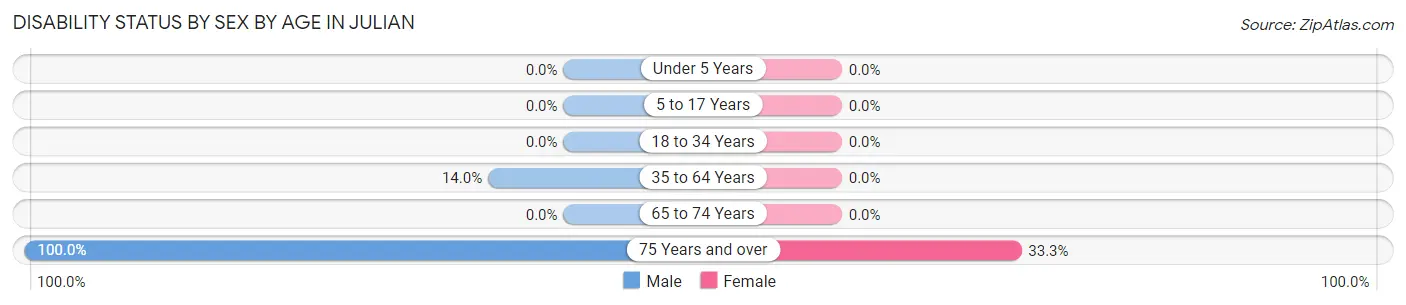
| Age Bracket | Male | Female |
| Under 5 Years | 0 (0.0%) | 0 (0.0%) |
| 5 to 17 Years | 0 (0.0%) | 0 (0.0%) |
| 18 to 34 Years | 0 (0.0%) | 0 (0.0%) |
| 35 to 64 Years | 34 (14.0%) | 0 (0.0%) |
| 65 to 74 Years | 0 (0.0%) | 0 (0.0%) |
| 75 Years and over | 73 (100.0%) | 26 (33.3%) |
Disability Class by Sex by Age in Julian
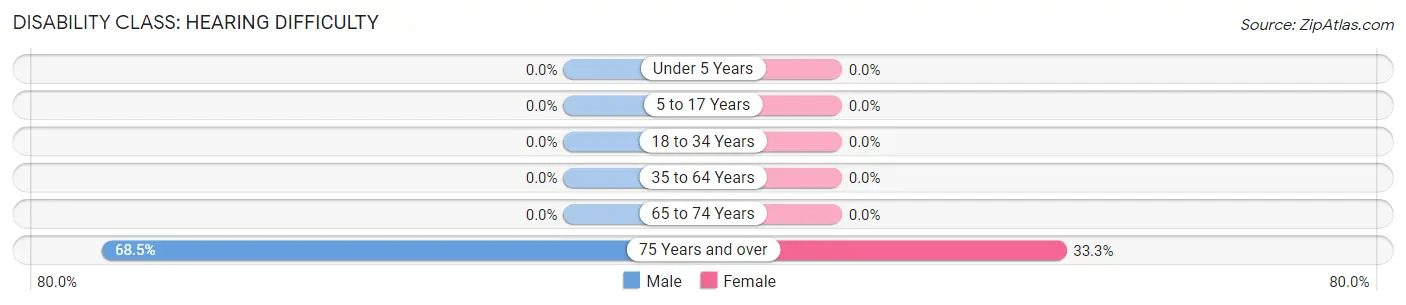
Disability Class: Hearing Difficulty
| Age Bracket | Male | Female |
| Under 5 Years | 0 (0.0%) | 0 (0.0%) |
| 5 to 17 Years | 0 (0.0%) | 0 (0.0%) |
| 18 to 34 Years | 0 (0.0%) | 0 (0.0%) |
| 35 to 64 Years | 0 (0.0%) | 0 (0.0%) |
| 65 to 74 Years | 0 (0.0%) | 0 (0.0%) |
| 75 Years and over | 50 (68.5%) | 26 (33.3%) |
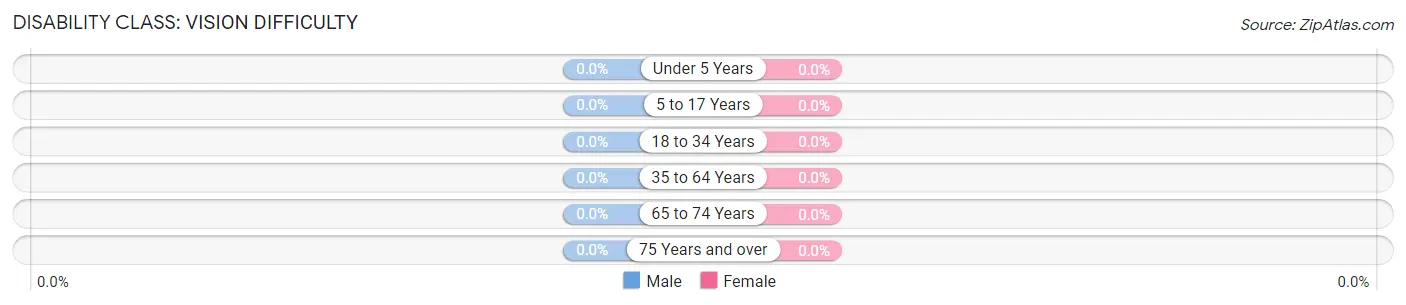
Disability Class: Vision Difficulty
| Age Bracket | Male | Female |
| Under 5 Years | 0 (0.0%) | 0 (0.0%) |
| 5 to 17 Years | 0 (0.0%) | 0 (0.0%) |
| 18 to 34 Years | 0 (0.0%) | 0 (0.0%) |
| 35 to 64 Years | 0 (0.0%) | 0 (0.0%) |
| 65 to 74 Years | 0 (0.0%) | 0 (0.0%) |
| 75 Years and over | 0 (0.0%) | 0 (0.0%) |
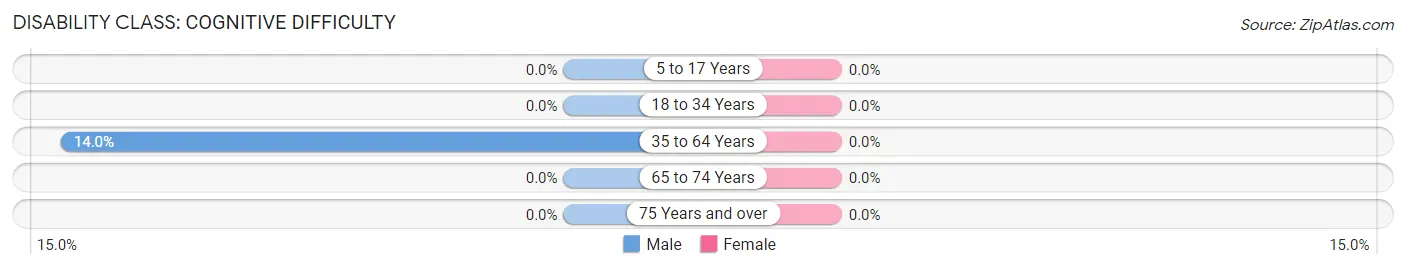
Disability Class: Cognitive Difficulty
| Age Bracket | Male | Female |
| 5 to 17 Years | 0 (0.0%) | 0 (0.0%) |
| 18 to 34 Years | 0 (0.0%) | 0 (0.0%) |
| 35 to 64 Years | 34 (14.0%) | 0 (0.0%) |
| 65 to 74 Years | 0 (0.0%) | 0 (0.0%) |
| 75 Years and over | 0 (0.0%) | 0 (0.0%) |
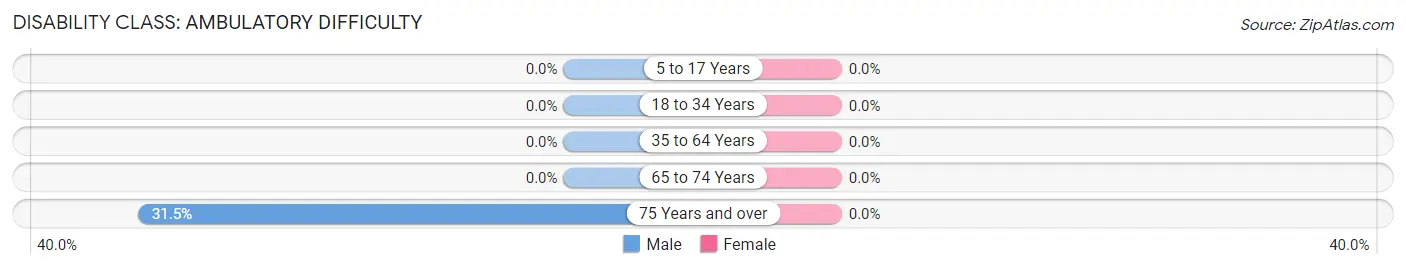
Disability Class: Ambulatory Difficulty
| Age Bracket | Male | Female |
| 5 to 17 Years | 0 (0.0%) | 0 (0.0%) |
| 18 to 34 Years | 0 (0.0%) | 0 (0.0%) |
| 35 to 64 Years | 0 (0.0%) | 0 (0.0%) |
| 65 to 74 Years | 0 (0.0%) | 0 (0.0%) |
| 75 Years and over | 23 (31.5%) | 0 (0.0%) |
Disability Class: Self-Care Difficulty
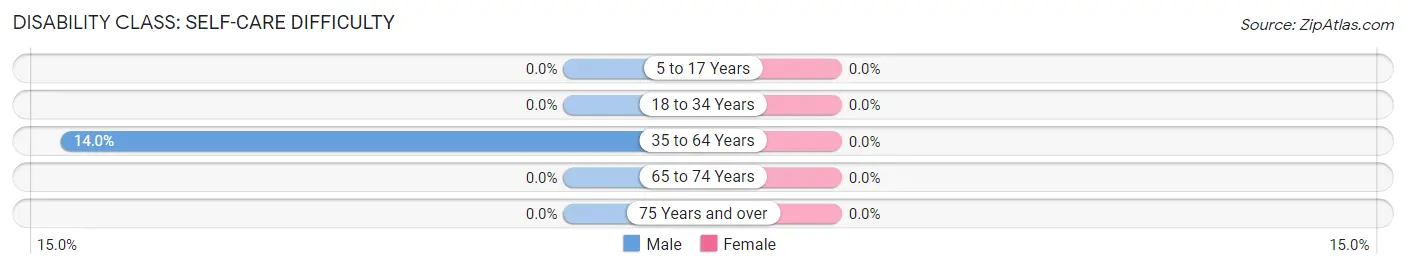
| Age Bracket | Male | Female |
| 5 to 17 Years | 0 (0.0%) | 0 (0.0%) |
| 18 to 34 Years | 0 (0.0%) | 0 (0.0%) |
| 35 to 64 Years | 34 (14.0%) | 0 (0.0%) |
| 65 to 74 Years | 0 (0.0%) | 0 (0.0%) |
| 75 Years and over | 0 (0.0%) | 0 (0.0%) |
Technology Access in Julian
Computing Device Access in Julian
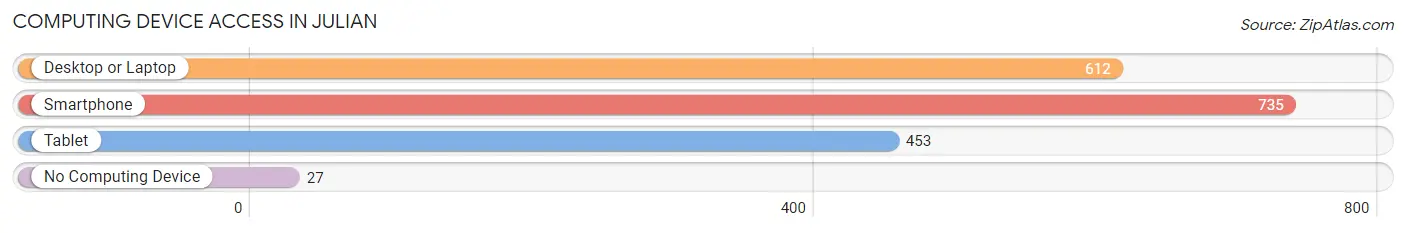
| Device Type | # Households | % Households |
| Desktop or Laptop | 612 | 80.3% |
| Smartphone | 735 | 96.5% |
| Tablet | 453 | 59.5% |
| No Computing Device | 27 | 3.5% |
| Total | 762 | 100.0% |
Internet Access in Julian
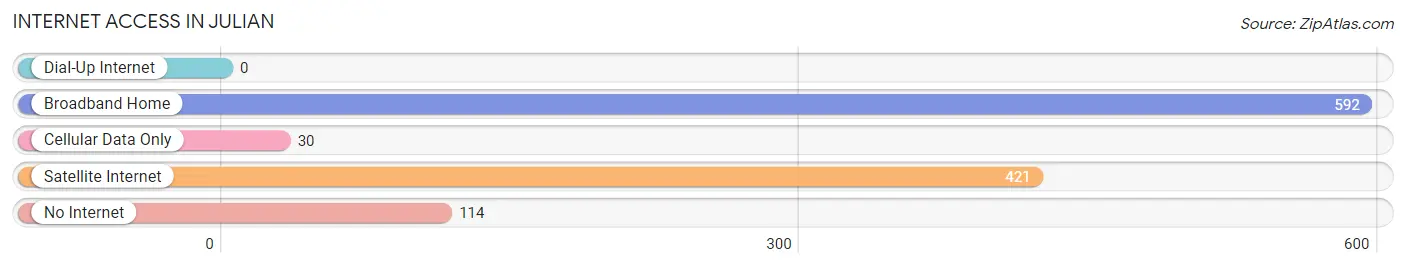
| Internet Type | # Households | % Households |
| Dial-Up Internet | 0 | 0.0% |
| Broadband Home | 592 | 77.7% |
| Cellular Data Only | 30 | 3.9% |
| Satellite Internet | 421 | 55.2% |
| No Internet | 114 | 15.0% |
| Total | 762 | 100.0% |
Julian Summary
Julian, California is a small mountain town located in San Diego County, California. It is situated in the Cuyamaca Mountains, about an hour east of San Diego. Julian is known for its apple orchards, wineries, and historic downtown. The town has a population of about 1,500 people and is a popular tourist destination.
History
Julian was founded in 1870 by Drue Bailey, a Civil War veteran. He named the town after his son, Julian. The town was originally a gold mining camp, and the first gold discovery was made in 1869. The town quickly grew and by 1871, it had a population of over 500 people.
In the late 1800s, Julian was a popular tourist destination. It was known for its apple orchards, wineries, and scenic views. The town was also home to a number of hotels, restaurants, and stores.
In the early 1900s, the town began to decline as the gold mining industry declined. The population dropped to about 200 people by the 1930s.
In the 1950s, the town began to experience a revival. The apple orchards and wineries were revived, and the town became a popular tourist destination once again.
Geography
Julian is located in the Cuyamaca Mountains, about an hour east of San Diego. The town is situated at an elevation of 4,235 feet, making it one of the highest towns in San Diego County.
The town is surrounded by rolling hills and mountains, and is home to a number of apple orchards and wineries. The town is also home to a number of parks, including William Heise County Park and Cuyamaca Rancho State Park.
Economy
Julian’s economy is largely based on tourism. The town is known for its apple orchards, wineries, and historic downtown. The town also has a number of restaurants, shops, and hotels.
The town is also home to a number of small businesses, including a number of antique stores, art galleries, and gift shops.
Demographics
As of the 2010 census, Julian had a population of 1,502 people. The racial makeup of the town was 91.2% White, 0.7% African American, 0.7% Native American, 0.7% Asian, 0.1% Pacific Islander, 4.3% from other races, and 2.1% from two or more races. Hispanic or Latino of any race were 11.3% of the population.
The median household income in Julian was $45,000, and the median family income was $50,000. The per capita income for the town was $20,000. About 10.3% of the population was below the poverty line.
Common Questions
What is Per Capita Income in Julian?
Per Capita income in Julian is $48,108.
What is the Median Family Income in Julian?
Median Family Income in Julian is $98,460.
What is the Median Household income in Julian?
Median Household Income in Julian is $81,126.
What is Income or Wage Gap in Julian?
Income or Wage Gap in Julian is 0.9%.
Women in Julian earn 99.1 cents for every dollar earned by a man.
What is Inequality or Gini Index in Julian?
Inequality or Gini Index in Julian is 0.26.
What is the Total Population of Julian?
Total Population of Julian is 1,377.
What is the Total Male Population of Julian?
Total Male Population of Julian is 705.
What is the Total Female Population of Julian?
Total Female Population of Julian is 672.
What is the Ratio of Males per 100 Females in Julian?
There are 104.91 Males per 100 Females in Julian.
What is the Ratio of Females per 100 Males in Julian?
There are 95.32 Females per 100 Males in Julian.
What is the Median Population Age in Julian?
Median Population Age in Julian is 59.3 Years.
What is the Average Family Size in Julian
Average Family Size in Julian is 2.4 People.
What is the Average Household Size in Julian
Average Household Size in Julian is 1.8 People.
How Large is the Labor Force in Julian?
There are 647 People in the Labor Forcein in Julian.
What is the Percentage of People in the Labor Force in Julian?
51.0% of People are in the Labor Force in Julian.