Cities with the Highest Percentage of Population Employed in Construction & Extraction in Maryland
RELATED REPORTS & OPTIONS
Construction & Extraction
Maryland
Compare Cities
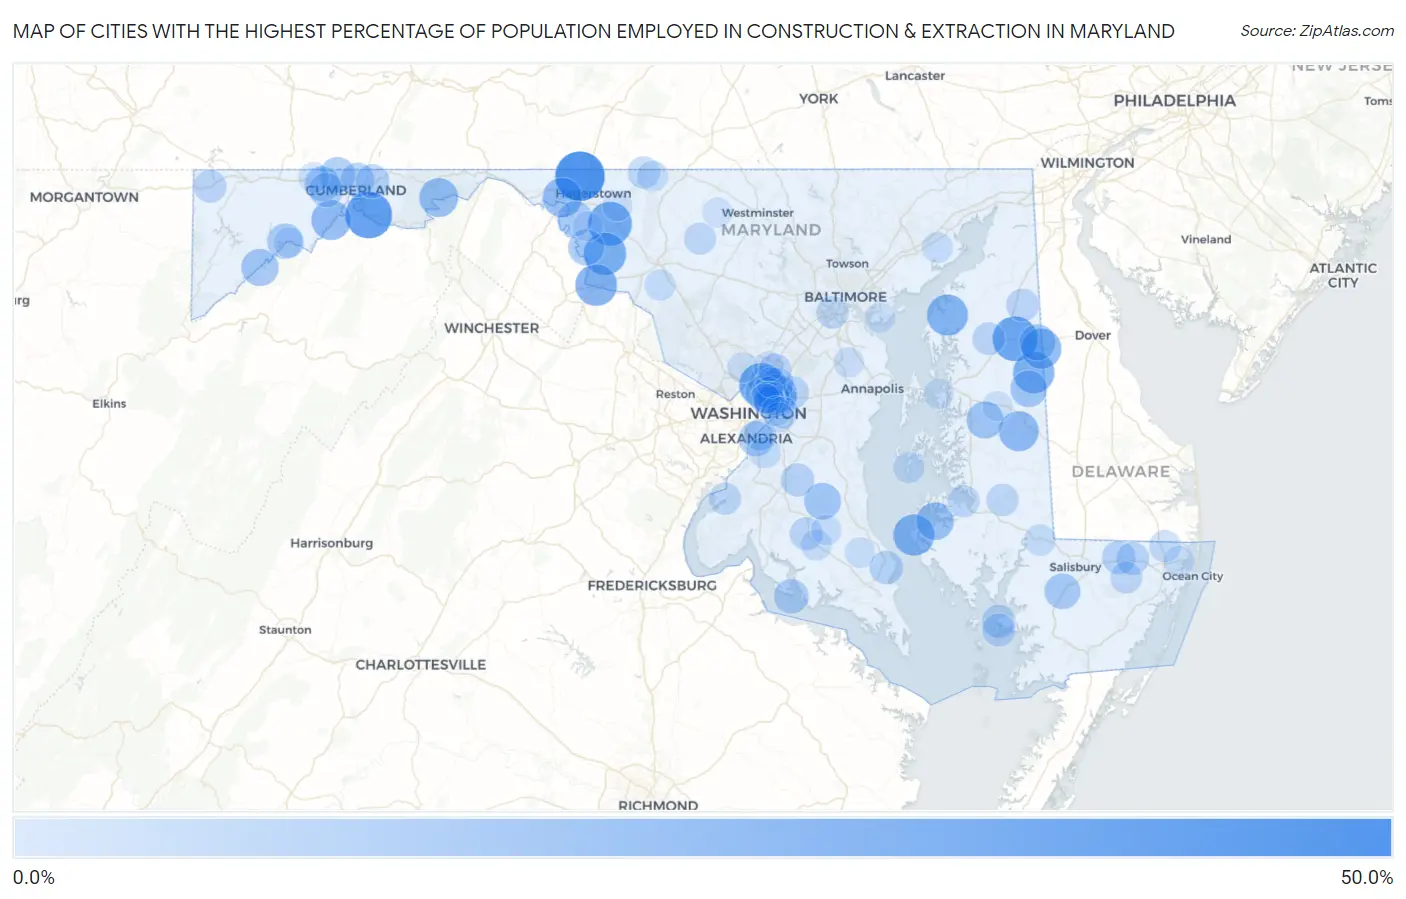
Map of Cities with the Highest Percentage of Population Employed in Construction & Extraction in Maryland
0.0%
50.0%
Cities with the Highest Percentage of Population Employed in Construction & Extraction in Maryland
| City | % Employed | vs State | vs National | |
| 1. | Cearfoss | 48.8% | 4.8%(+44.1)#1 | 5.0%(+43.8)#190 |
| 2. | Spring Gap | 42.9% | 4.8%(+38.1)#2 | 5.0%(+37.9)#244 |
| 3. | Barclay | 38.6% | 4.8%(+33.8)#3 | 5.0%(+33.6)#302 |
| 4. | Mapleville | 36.9% | 4.8%(+32.1)#4 | 5.0%(+31.9)#342 |
| 5. | Langley Park | 36.9% | 4.8%(+32.1)#5 | 5.0%(+31.9)#343 |
| 6. | Rohrersville | 33.8% | 4.8%(+29.1)#6 | 5.0%(+28.9)#405 |
| 7. | Sandy Hook | 32.1% | 4.8%(+27.3)#7 | 5.0%(+27.1)#475 |
| 8. | Goldsboro | 31.7% | 4.8%(+26.9)#8 | 5.0%(+26.7)#482 |
| 9. | Taylors Island | 31.2% | 4.8%(+26.5)#9 | 5.0%(+26.3)#494 |
| 10. | Fairlee | 30.8% | 4.8%(+26.0)#10 | 5.0%(+25.8)#507 |
| 11. | Marydel | 29.2% | 4.8%(+24.4)#11 | 5.0%(+24.2)#579 |
| 12. | Williston | 28.2% | 4.8%(+23.5)#12 | 5.0%(+23.3)#631 |
| 13. | Bier | 28.0% | 4.8%(+23.2)#13 | 5.0%(+23.0)#641 |
| 14. | Pinesburg | 27.5% | 4.8%(+22.7)#14 | 5.0%(+22.5)#674 |
| 15. | Lewistown | 27.2% | 4.8%(+22.4)#15 | 5.0%(+22.2)#695 |
| 16. | Little Orleans | 26.7% | 4.8%(+21.9)#16 | 5.0%(+21.7)#738 |
| 17. | East Riverdale | 25.6% | 4.8%(+20.9)#17 | 5.0%(+20.6)#791 |
| 18. | Madison | 23.7% | 4.8%(+18.9)#18 | 5.0%(+18.7)#951 |
| 19. | Lisbon | 22.9% | 4.8%(+18.1)#19 | 5.0%(+17.9)#1,032 |
| 20. | Kitzmiller | 22.7% | 4.8%(+17.9)#20 | 5.0%(+17.7)#1,043 |
| 21. | Cordova | 22.5% | 4.8%(+17.7)#21 | 5.0%(+17.5)#1,064 |
| 22. | Aquasco | 22.1% | 4.8%(+17.3)#22 | 5.0%(+17.1)#1,121 |
| 23. | Greensboro | 21.6% | 4.8%(+16.9)#23 | 5.0%(+16.6)#1,175 |
| 24. | Templeville | 20.8% | 4.8%(+16.1)#24 | 5.0%(+15.8)#1,264 |
| 25. | Sharpsburg | 20.5% | 4.8%(+15.8)#25 | 5.0%(+15.5)#1,307 |
| 26. | Barrelville | 20.0% | 4.8%(+15.2)#26 | 5.0%(+15.0)#1,372 |
| 27. | Eden | 19.7% | 4.8%(+14.9)#27 | 5.0%(+14.7)#1,418 |
| 28. | Riverdale Park | 19.4% | 4.8%(+14.6)#28 | 5.0%(+14.4)#1,462 |
| 29. | Bloomington | 19.4% | 4.8%(+14.6)#29 | 5.0%(+14.4)#1,479 |
| 30. | Downsville | 18.9% | 4.8%(+14.1)#30 | 5.0%(+13.9)#1,546 |
| 31. | Zihlman | 18.7% | 4.8%(+13.9)#31 | 5.0%(+13.7)#1,595 |
| 32. | Forest Heights | 18.6% | 4.8%(+13.8)#32 | 5.0%(+13.6)#1,605 |
| 33. | Adelphi | 18.4% | 4.8%(+13.6)#33 | 5.0%(+13.4)#1,647 |
| 34. | Still Pond | 18.2% | 4.8%(+13.4)#34 | 5.0%(+13.2)#1,685 |
| 35. | Woodlawn Cdp Prince George S County | 17.9% | 4.8%(+13.1)#35 | 5.0%(+12.9)#1,763 |
| 36. | Chillum | 17.8% | 4.8%(+13.0)#36 | 5.0%(+12.8)#1,777 |
| 37. | Cobb Island | 17.8% | 4.8%(+13.0)#37 | 5.0%(+12.8)#1,798 |
| 38. | Edmonston | 17.4% | 4.8%(+12.6)#38 | 5.0%(+12.4)#1,870 |
| 39. | Bowmans Addition | 16.8% | 4.8%(+12.1)#39 | 5.0%(+11.8)#1,989 |
| 40. | Eckhart Mines | 16.8% | 4.8%(+12.1)#40 | 5.0%(+11.8)#1,993 |
| 41. | Pleasant Grove | 16.2% | 4.8%(+11.4)#41 | 5.0%(+11.2)#2,188 |
| 42. | Lusby | 15.5% | 4.8%(+10.7)#42 | 5.0%(+10.5)#2,387 |
| 43. | Landover Hills | 15.3% | 4.8%(+10.5)#43 | 5.0%(+10.3)#2,441 |
| 44. | Pittsville | 15.2% | 4.8%(+10.5)#44 | 5.0%(+10.2)#2,466 |
| 45. | Cedarville | 15.0% | 4.8%(+10.2)#45 | 5.0%(+9.98)#2,560 |
| 46. | Chance | 14.9% | 4.8%(+10.1)#46 | 5.0%(+9.88)#2,592 |
| 47. | Deal Island | 14.3% | 4.8%(+9.50)#47 | 5.0%(+9.29)#2,803 |
| 48. | Willards | 14.2% | 4.8%(+9.46)#48 | 5.0%(+9.24)#2,839 |
| 49. | Lanham | 14.0% | 4.8%(+9.26)#49 | 5.0%(+9.05)#2,905 |
| 50. | Charlotte Hall | 14.0% | 4.8%(+9.23)#50 | 5.0%(+9.01)#2,919 |
| 51. | Burnt Mills | 13.9% | 4.8%(+9.11)#51 | 5.0%(+8.90)#2,970 |
| 52. | Church Hill | 13.9% | 4.8%(+9.08)#52 | 5.0%(+8.87)#2,988 |
| 53. | Friendsville | 13.8% | 4.8%(+9.07)#53 | 5.0%(+8.85)#2,996 |
| 54. | Beltsville | 13.8% | 4.8%(+9.01)#54 | 5.0%(+8.80)#3,014 |
| 55. | Millington | 13.8% | 4.8%(+9.01)#55 | 5.0%(+8.80)#3,017 |
| 56. | Berwyn Heights | 13.7% | 4.8%(+8.87)#56 | 5.0%(+8.66)#3,073 |
| 57. | Bladensburg | 13.5% | 4.8%(+8.68)#57 | 5.0%(+8.47)#3,159 |
| 58. | North Brentwood | 13.2% | 4.8%(+8.45)#58 | 5.0%(+8.24)#3,262 |
| 59. | East New Market | 13.2% | 4.8%(+8.41)#59 | 5.0%(+8.19)#3,292 |
| 60. | Lansdowne | 13.1% | 4.8%(+8.33)#60 | 5.0%(+8.12)#3,327 |
| 61. | Potomac Heights | 12.8% | 4.8%(+8.01)#61 | 5.0%(+7.80)#3,490 |
| 62. | Highfield Cascade | 12.8% | 4.8%(+8.00)#62 | 5.0%(+7.79)#3,500 |
| 63. | Colmar Manor | 12.5% | 4.8%(+7.69)#63 | 5.0%(+7.48)#3,666 |
| 64. | Libertytown | 12.4% | 4.8%(+7.58)#64 | 5.0%(+7.37)#3,717 |
| 65. | Powellville | 12.2% | 4.8%(+7.38)#65 | 5.0%(+7.17)#3,834 |
| 66. | Algonquin | 12.2% | 4.8%(+7.37)#66 | 5.0%(+7.16)#3,837 |
| 67. | Glassmanor | 12.1% | 4.8%(+7.32)#67 | 5.0%(+7.11)#3,873 |
| 68. | Bishopville | 11.9% | 4.8%(+7.15)#68 | 5.0%(+6.94)#3,969 |
| 69. | Brentwood | 11.7% | 4.8%(+6.93)#69 | 5.0%(+6.71)#4,134 |
| 70. | Peppermill Village | 11.5% | 4.8%(+6.76)#70 | 5.0%(+6.55)#4,233 |
| 71. | Tilghman Island | 11.3% | 4.8%(+6.54)#71 | 5.0%(+6.33)#4,398 |
| 72. | Friendly | 11.3% | 4.8%(+6.47)#72 | 5.0%(+6.26)#4,453 |
| 73. | Callaway | 11.2% | 4.8%(+6.39)#73 | 5.0%(+6.18)#4,514 |
| 74. | Hyattsville | 11.2% | 4.8%(+6.39)#74 | 5.0%(+6.17)#4,520 |
| 75. | Mardela Springs | 11.2% | 4.8%(+6.38)#75 | 5.0%(+6.16)#4,530 |
| 76. | Romancoke | 10.7% | 4.8%(+5.93)#76 | 5.0%(+5.72)#4,885 |
| 77. | Mechanicsville | 10.7% | 4.8%(+5.90)#77 | 5.0%(+5.68)#4,928 |
| 78. | Buckeystown | 10.5% | 4.8%(+5.77)#78 | 5.0%(+5.56)#5,021 |
| 79. | Cottage City | 10.4% | 4.8%(+5.61)#79 | 5.0%(+5.40)#5,156 |
| 80. | Sabillasville | 10.4% | 4.8%(+5.58)#80 | 5.0%(+5.37)#5,197 |
| 81. | Perryman | 10.1% | 4.8%(+5.36)#81 | 5.0%(+5.15)#5,407 |
| 82. | Ocean Pines | 9.9% | 4.8%(+5.15)#82 | 5.0%(+4.94)#5,635 |
| 83. | Wheaton | 9.6% | 4.8%(+4.82)#83 | 5.0%(+4.60)#5,955 |
| 84. | Broomes Island | 9.6% | 4.8%(+4.79)#84 | 5.0%(+4.58)#5,978 |
| 85. | College Park | 9.6% | 4.8%(+4.79)#85 | 5.0%(+4.58)#5,983 |
| 86. | Golden Beach | 9.6% | 4.8%(+4.79)#86 | 5.0%(+4.57)#5,987 |
| 87. | Finzel | 9.5% | 4.8%(+4.76)#87 | 5.0%(+4.55)#6,009 |
| 88. | Luke | 9.5% | 4.8%(+4.74)#88 | 5.0%(+4.53)#6,053 |
| 89. | Arden On The Severn | 9.0% | 4.8%(+4.21)#89 | 5.0%(+3.99)#6,657 |
| 90. | Capitol Heights | 8.9% | 4.8%(+4.10)#90 | 5.0%(+3.88)#6,778 |
| 91. | Mount Rainier | 8.8% | 4.8%(+4.06)#91 | 5.0%(+3.85)#6,821 |
| 92. | Grasonville | 8.8% | 4.8%(+4.05)#92 | 5.0%(+3.83)#6,841 |
| 93. | Mount Aetna | 8.7% | 4.8%(+3.87)#93 | 5.0%(+3.66)#7,093 |
| 94. | Fairmount Heights | 8.6% | 4.8%(+3.85)#94 | 5.0%(+3.64)#7,127 |
| 95. | Edgemere | 8.6% | 4.8%(+3.82)#95 | 5.0%(+3.61)#7,156 |
| 96. | Hillsboro | 8.6% | 4.8%(+3.82)#96 | 5.0%(+3.61)#7,162 |
| 97. | Tilghmanton | 8.6% | 4.8%(+3.79)#97 | 5.0%(+3.58)#7,209 |
| 98. | Calverton | 8.6% | 4.8%(+3.78)#98 | 5.0%(+3.56)#7,239 |
| 99. | Union Bridge | 8.6% | 4.8%(+3.77)#99 | 5.0%(+3.56)#7,244 |
| 100. | Maryland Park | 8.3% | 4.8%(+3.55)#100 | 5.0%(+3.34)#7,542 |
Common Questions
What are the Top 10 Cities with the Highest Percentage of Population Employed in Construction & Extraction in Maryland?
Top 10 Cities with the Highest Percentage of Population Employed in Construction & Extraction in Maryland are:
#1
48.8%
#2
42.9%
#3
38.6%
#4
36.9%
#5
36.9%
#6
33.8%
#7
32.1%
#8
31.7%
#9
31.2%
#10
30.8%
What city has the Highest Percentage of Population Employed in Construction & Extraction in Maryland?
Cearfoss has the Highest Percentage of Population Employed in Construction & Extraction in Maryland with 48.8%.
What is the Percentage of Population Employed in Construction & Extraction in the State of Maryland?
Percentage of Population Employed in Construction & Extraction in Maryland is 4.8%.
What is the Percentage of Population Employed in Construction & Extraction in the United States?
Percentage of Population Employed in Construction & Extraction in the United States is 5.0%.