Good Hope, CA Map & Demographics
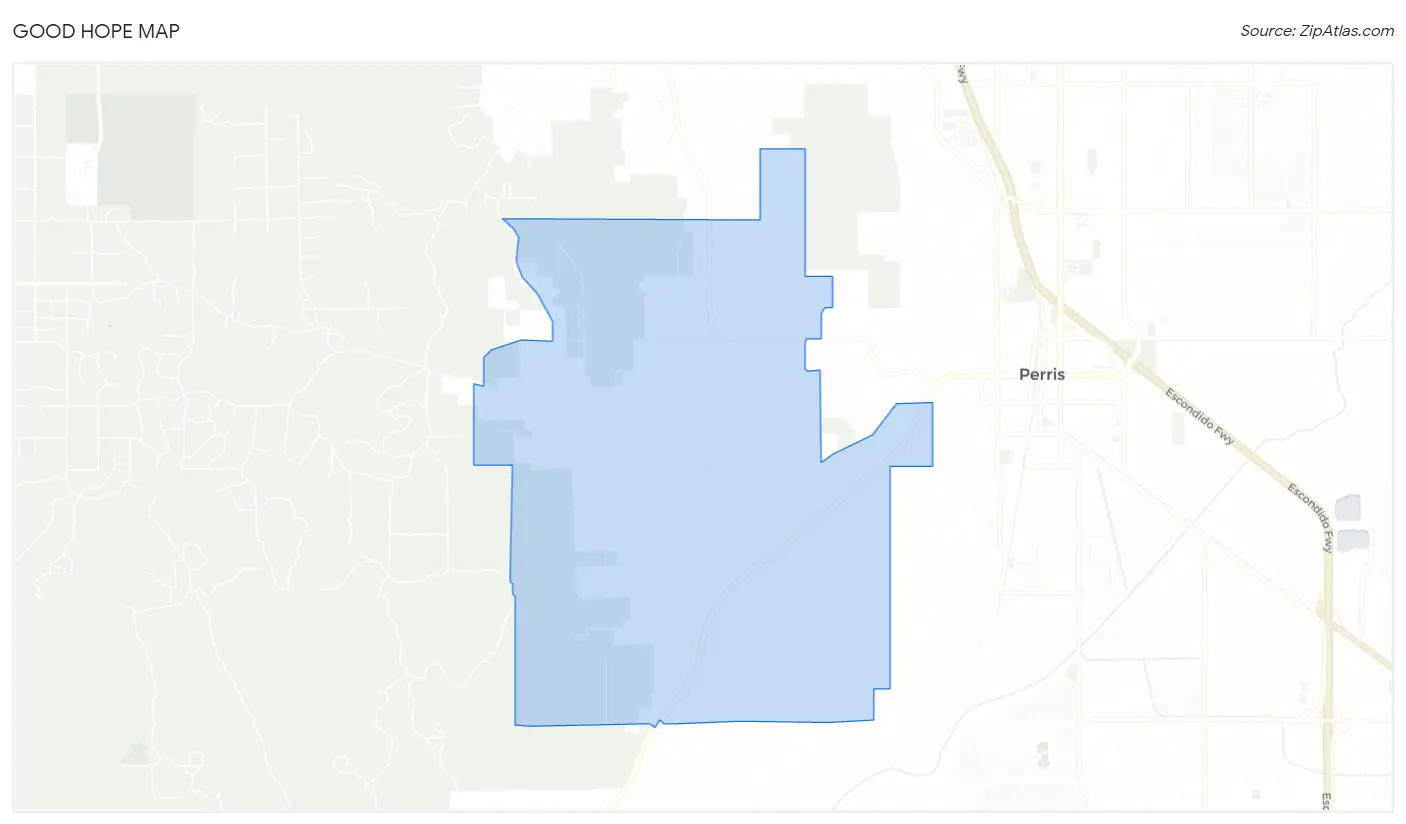
Good Hope Map
Good Hope Overview
$17,661
PER CAPITA INCOME
$59,250
AVG FAMILY INCOME
$53,934
AVG HOUSEHOLD INCOME
9.9%
WAGE / INCOME GAP [ % ]
90.1¢/ $1
WAGE / INCOME GAP [ $ ]
$11,936
FAMILY INCOME DEFICIT
0.38
INEQUALITY / GINI INDEX
8,291
TOTAL POPULATION
4,165
MALE POPULATION
4,126
FEMALE POPULATION
100.95
MALES / 100 FEMALES
99.06
FEMALES / 100 MALES
31.3
MEDIAN AGE
4.4
AVG FAMILY SIZE
4.1
AVG HOUSEHOLD SIZE
3,717
LABOR FORCE [ PEOPLE ]
57.9%
PERCENT IN LABOR FORCE
12.4%
UNEMPLOYMENT RATE
Income in Good Hope
Income Overview in Good Hope
Per Capita Income in Good Hope is $17,661, while median incomes of families and households are $59,250 and $53,934 respectively.
| Characteristic | Number | Measure |
| Per Capita Income | 8,291 | $17,661 |
| Median Family Income | 1,708 | $59,250 |
| Mean Family Income | 1,708 | $66,817 |
| Median Household Income | 2,002 | $53,934 |
| Mean Household Income | 2,002 | $65,367 |
| Income Deficit | 1,708 | $11,936 |
| Wage / Income Gap (%) | 8,291 | 9.94% |
| Wage / Income Gap ($) | 8,291 | 90.06¢ per $1 |
| Gini / Inequality Index | 8,291 | 0.38 |
Earnings by Sex in Good Hope
Average Earnings in Good Hope are $28,460, $30,660 for men and $27,611 for women, a difference of 9.9%.
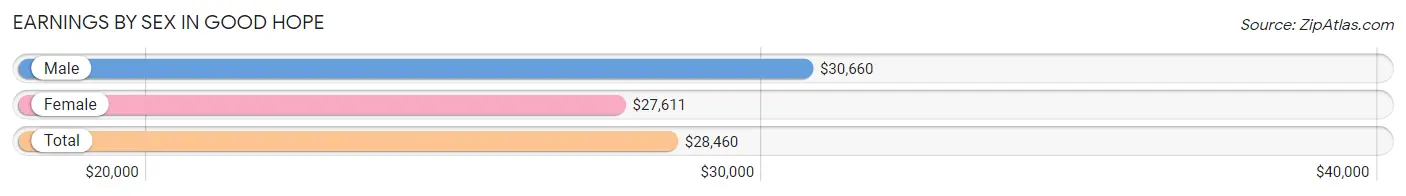
| Sex | Number | Average Earnings |
| Male | 2,207 (60.3%) | $30,660 |
| Female | 1,455 (39.7%) | $27,611 |
| Total | 3,662 (100.0%) | $28,460 |
Earnings by Sex by Income Bracket in Good Hope
The most common earnings brackets in Good Hope are $45,000 to $49,999 for men (188 | 8.5%) and $25,000 to $29,999 for women (174 | 12.0%).
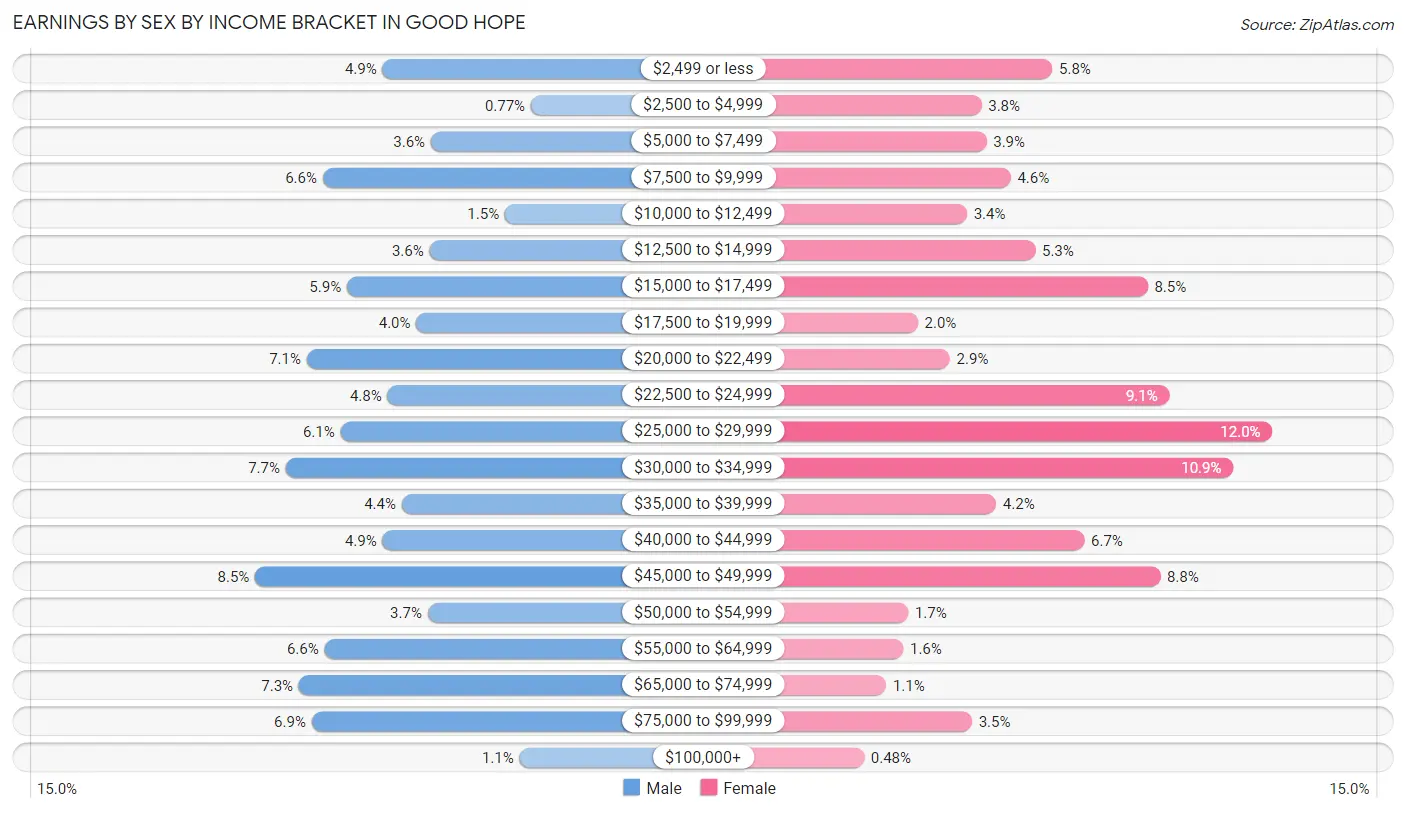
| Income | Male | Female |
| $2,499 or less | 109 (4.9%) | 84 (5.8%) |
| $2,500 to $4,999 | 17 (0.8%) | 55 (3.8%) |
| $5,000 to $7,499 | 79 (3.6%) | 57 (3.9%) |
| $7,500 to $9,999 | 146 (6.6%) | 67 (4.6%) |
| $10,000 to $12,499 | 33 (1.5%) | 49 (3.4%) |
| $12,500 to $14,999 | 80 (3.6%) | 77 (5.3%) |
| $15,000 to $17,499 | 131 (5.9%) | 123 (8.5%) |
| $17,500 to $19,999 | 88 (4.0%) | 29 (2.0%) |
| $20,000 to $22,499 | 156 (7.1%) | 42 (2.9%) |
| $22,500 to $24,999 | 106 (4.8%) | 132 (9.1%) |
| $25,000 to $29,999 | 135 (6.1%) | 174 (12.0%) |
| $30,000 to $34,999 | 169 (7.7%) | 158 (10.9%) |
| $35,000 to $39,999 | 97 (4.4%) | 61 (4.2%) |
| $40,000 to $44,999 | 109 (4.9%) | 97 (6.7%) |
| $45,000 to $49,999 | 188 (8.5%) | 128 (8.8%) |
| $50,000 to $54,999 | 81 (3.7%) | 25 (1.7%) |
| $55,000 to $64,999 | 145 (6.6%) | 23 (1.6%) |
| $65,000 to $74,999 | 161 (7.3%) | 16 (1.1%) |
| $75,000 to $99,999 | 153 (6.9%) | 51 (3.5%) |
| $100,000+ | 24 (1.1%) | 7 (0.5%) |
| Total | 2,207 (100.0%) | 1,455 (100.0%) |
Earnings by Sex by Educational Attainment in Good Hope
Average earnings in Good Hope are $35,000 for men and $28,421 for women, a difference of 18.8%. Men with an educational attainment of high school diploma enjoy the highest average annual earnings of $41,589, while those with less than high school education earn the least with $27,325. Women with an educational attainment of high school diploma earn the most with the average annual earnings of $31,047, while those with bachelor's degree education have the smallest earnings of $13,125.
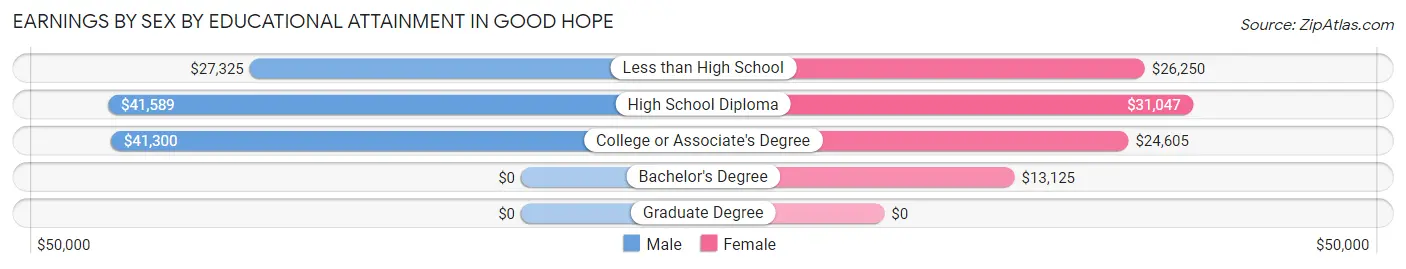
| Educational Attainment | Male Income | Female Income |
| Less than High School | $27,325 | $26,250 |
| High School Diploma | $41,589 | $31,047 |
| College or Associate's Degree | $41,300 | $24,605 |
| Bachelor's Degree | - | - |
| Graduate Degree | - | - |
| Total | $35,000 | $28,421 |
Family Income in Good Hope
Family Income Brackets in Good Hope
According to the Good Hope family income data, there are 420 families falling into the $50,000 to $74,999 income range, which is the most common income bracket and makes up 24.6% of all families.
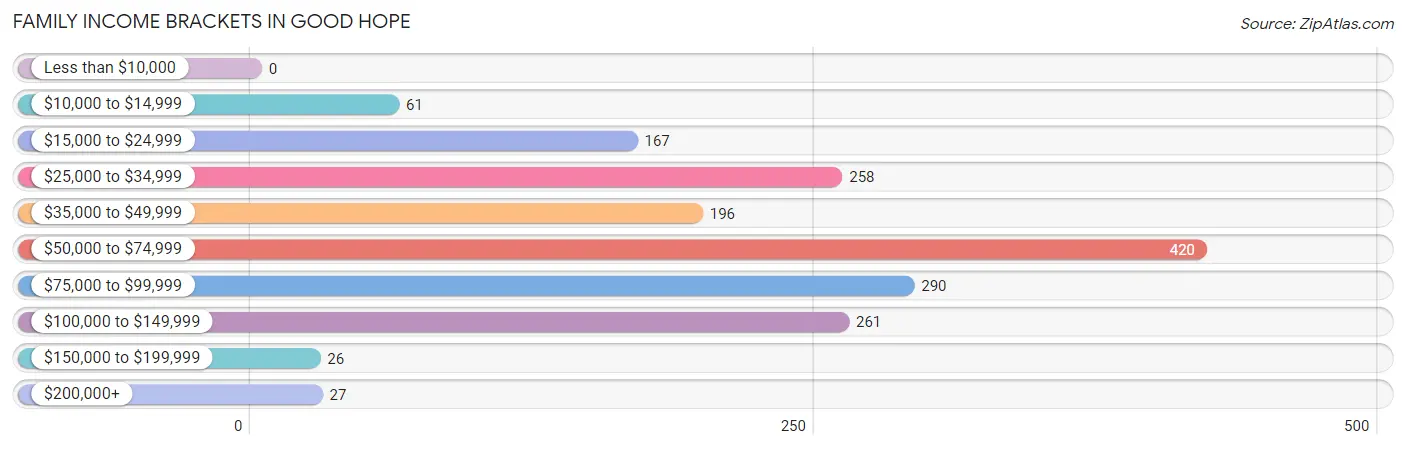
| Income Bracket | # Families | % Families |
| Less than $10,000 | 0 | 0.0% |
| $10,000 to $14,999 | 61 | 3.6% |
| $15,000 to $24,999 | 167 | 9.8% |
| $25,000 to $34,999 | 258 | 15.1% |
| $35,000 to $49,999 | 196 | 11.5% |
| $50,000 to $74,999 | 420 | 24.6% |
| $75,000 to $99,999 | 290 | 17.0% |
| $100,000 to $149,999 | 261 | 15.3% |
| $150,000 to $199,999 | 26 | 1.5% |
| $200,000+ | 27 | 1.6% |
Family Income by Famaliy Size in Good Hope
6-person families (211 | 12.3%) account for the highest median family income in Good Hope with $100,886 per family, while 2-person families (397 | 23.2%) have the highest median income of $23,765 per family member.
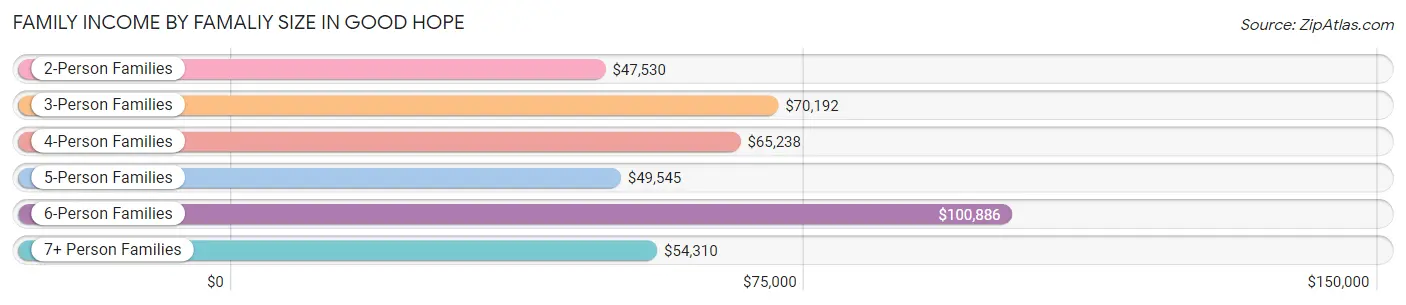
| Income Bracket | # Families | Median Income |
| 2-Person Families | 397 (23.2%) | $47,530 |
| 3-Person Families | 374 (21.9%) | $70,192 |
| 4-Person Families | 348 (20.4%) | $65,238 |
| 5-Person Families | 262 (15.3%) | $49,545 |
| 6-Person Families | 211 (12.3%) | $100,886 |
| 7+ Person Families | 116 (6.8%) | $54,310 |
| Total | 1,708 (100.0%) | $59,250 |
Family Income by Number of Earners in Good Hope
The median family income in Good Hope is $59,250, with families comprising 3+ earners (283) having the highest median family income of $96,406, while families with no earners (208) have the lowest median family income of $33,632, accounting for 16.6% and 12.2% of families, respectively.
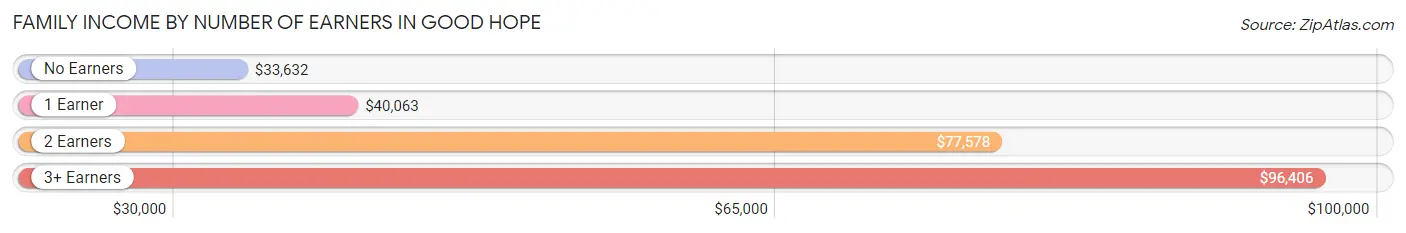
| Number of Earners | # Families | Median Income |
| No Earners | 208 (12.2%) | $33,632 |
| 1 Earner | 525 (30.7%) | $40,063 |
| 2 Earners | 692 (40.5%) | $77,578 |
| 3+ Earners | 283 (16.6%) | $96,406 |
| Total | 1,708 (100.0%) | $59,250 |
Household Income in Good Hope
Household Income Brackets in Good Hope
With 382 households falling in the category, the $50,000 to $74,999 income range is the most frequent in Good Hope, accounting for 19.1% of all households. In contrast, only 24 households (1.2%) fall into the $150,000 to $199,999 income bracket, making it the least populous group.
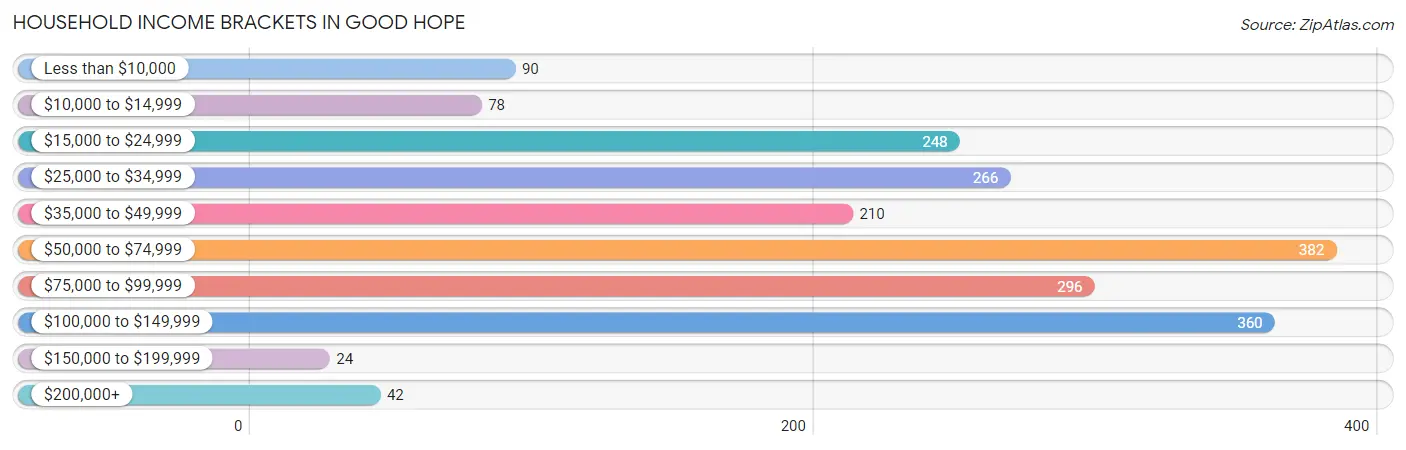
| Income Bracket | # Households | % Households |
| Less than $10,000 | 90 | 4.5% |
| $10,000 to $14,999 | 78 | 3.9% |
| $15,000 to $24,999 | 248 | 12.4% |
| $25,000 to $34,999 | 266 | 13.3% |
| $35,000 to $49,999 | 210 | 10.5% |
| $50,000 to $74,999 | 382 | 19.1% |
| $75,000 to $99,999 | 296 | 14.8% |
| $100,000 to $149,999 | 360 | 18.0% |
| $150,000 to $199,999 | 24 | 1.2% |
| $200,000+ | 42 | 2.1% |
Household Income by Householder Age in Good Hope
The median household income in Good Hope is $53,934, with the highest median household income of $64,444 found in the 45 to 64 years age bracket for the primary householder. A total of 1,092 households (54.5%) fall into this category. Meanwhile, the 15 to 24 years age bracket for the primary householder has the lowest median household income of $28,125, with 87 households (4.3%) in this group.
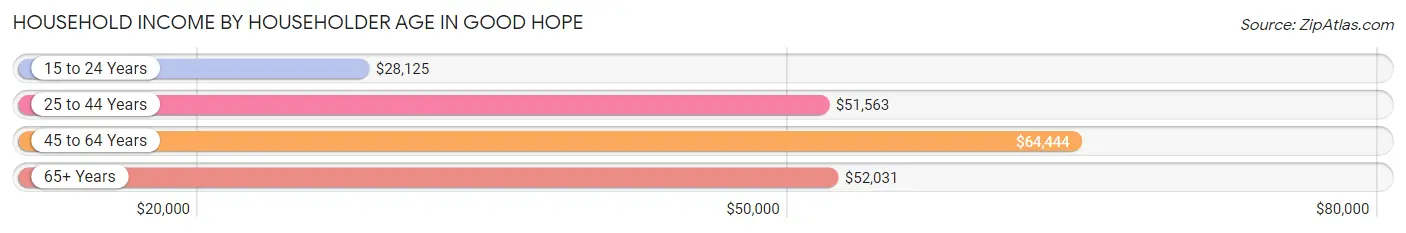
| Income Bracket | # Households | Median Income |
| 15 to 24 Years | 87 (4.3%) | $28,125 |
| 25 to 44 Years | 544 (27.2%) | $51,563 |
| 45 to 64 Years | 1,092 (54.5%) | $64,444 |
| 65+ Years | 279 (13.9%) | $52,031 |
| Total | 2,002 (100.0%) | $53,934 |
Poverty in Good Hope
Income Below Poverty by Sex and Age in Good Hope
With 15.7% poverty level for males and 24.7% for females among the residents of Good Hope, 75 year old and over males and 5 year old females are the most vulnerable to poverty, with 48 males (31.0%) and 31 females (100.0%) in their respective age groups living below the poverty level.
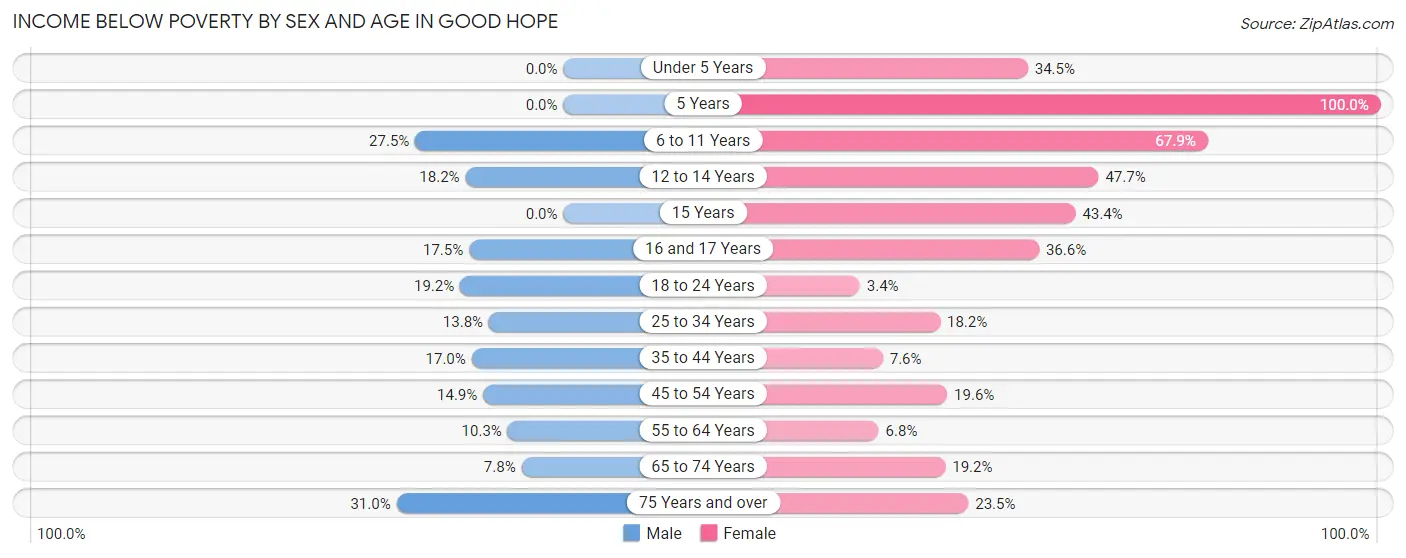
| Age Bracket | Male | Female |
| Under 5 Years | 0 (0.0%) | 116 (34.5%) |
| 5 Years | 0 (0.0%) | 31 (100.0%) |
| 6 to 11 Years | 96 (27.5%) | 313 (67.9%) |
| 12 to 14 Years | 36 (18.2%) | 71 (47.6%) |
| 15 Years | 0 (0.0%) | 36 (43.4%) |
| 16 and 17 Years | 21 (17.5%) | 56 (36.6%) |
| 18 to 24 Years | 111 (19.2%) | 15 (3.4%) |
| 25 to 34 Years | 98 (13.8%) | 124 (18.2%) |
| 35 to 44 Years | 85 (17.0%) | 29 (7.6%) |
| 45 to 54 Years | 95 (14.9%) | 132 (19.6%) |
| 55 to 64 Years | 49 (10.3%) | 27 (6.8%) |
| 65 to 74 Years | 15 (7.8%) | 39 (19.2%) |
| 75 Years and over | 48 (31.0%) | 27 (23.5%) |
| Total | 654 (15.7%) | 1,016 (24.7%) |
Income Above Poverty by Sex and Age in Good Hope
According to the poverty statistics in Good Hope, males aged under 5 years and females aged 18 to 24 years are the age groups that are most secure financially, with 100.0% of males and 96.7% of females in these age groups living above the poverty line.
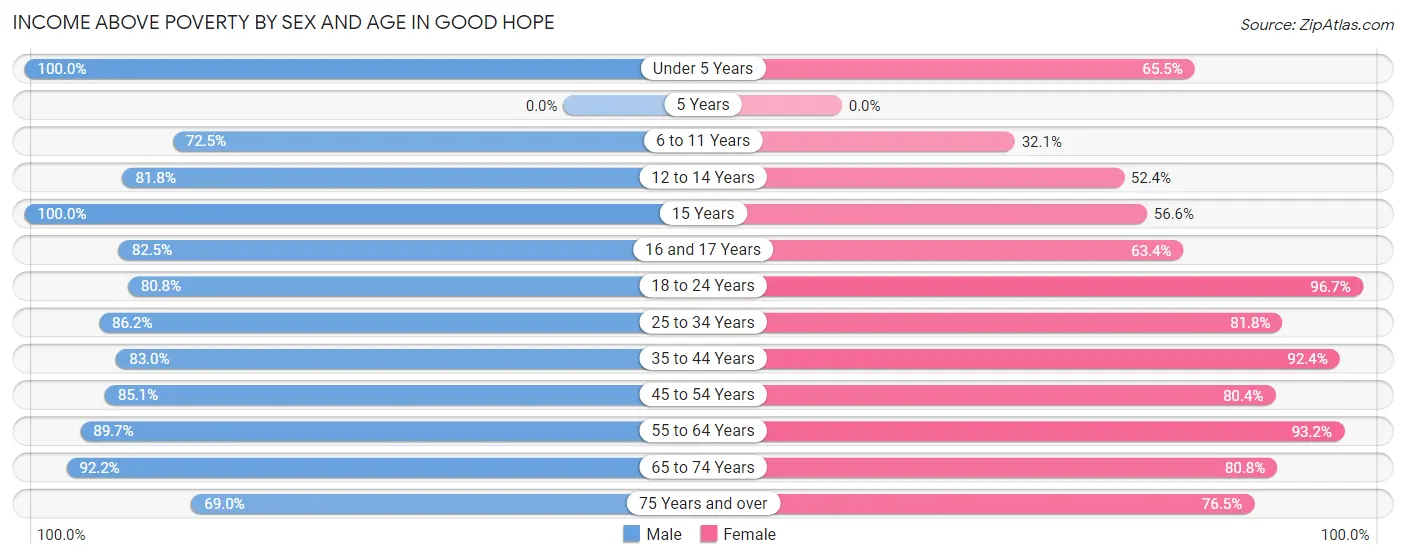
| Age Bracket | Male | Female |
| Under 5 Years | 193 (100.0%) | 220 (65.5%) |
| 5 Years | 0 (0.0%) | 0 (0.0%) |
| 6 to 11 Years | 253 (72.5%) | 148 (32.1%) |
| 12 to 14 Years | 162 (81.8%) | 78 (52.3%) |
| 15 Years | 55 (100.0%) | 47 (56.6%) |
| 16 and 17 Years | 99 (82.5%) | 97 (63.4%) |
| 18 to 24 Years | 468 (80.8%) | 433 (96.7%) |
| 25 to 34 Years | 611 (86.2%) | 556 (81.8%) |
| 35 to 44 Years | 414 (83.0%) | 352 (92.4%) |
| 45 to 54 Years | 543 (85.1%) | 543 (80.4%) |
| 55 to 64 Years | 425 (89.7%) | 368 (93.2%) |
| 65 to 74 Years | 178 (92.2%) | 164 (80.8%) |
| 75 Years and over | 107 (69.0%) | 88 (76.5%) |
| Total | 3,508 (84.3%) | 3,094 (75.3%) |
Income Below Poverty Among Married-Couple Families in Good Hope
The poverty statistics for married-couple families in Good Hope show that 9.8% or 114 of the total 1,160 families live below the poverty line. Families with 5 or more children have the highest poverty rate of 78.4%, comprising of 29 families. On the other hand, families with 1 or 2 children have the lowest poverty rate of 3.2%, which includes 14 families.
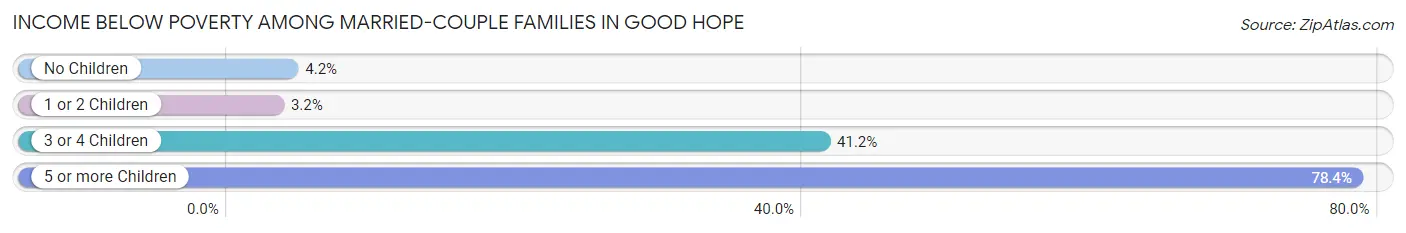
| Children | Above Poverty | Below Poverty |
| No Children | 547 (95.8%) | 24 (4.2%) |
| 1 or 2 Children | 424 (96.8%) | 14 (3.2%) |
| 3 or 4 Children | 67 (58.8%) | 47 (41.2%) |
| 5 or more Children | 8 (21.6%) | 29 (78.4%) |
| Total | 1,046 (90.2%) | 114 (9.8%) |
Income Below Poverty Among Single-Parent Households in Good Hope
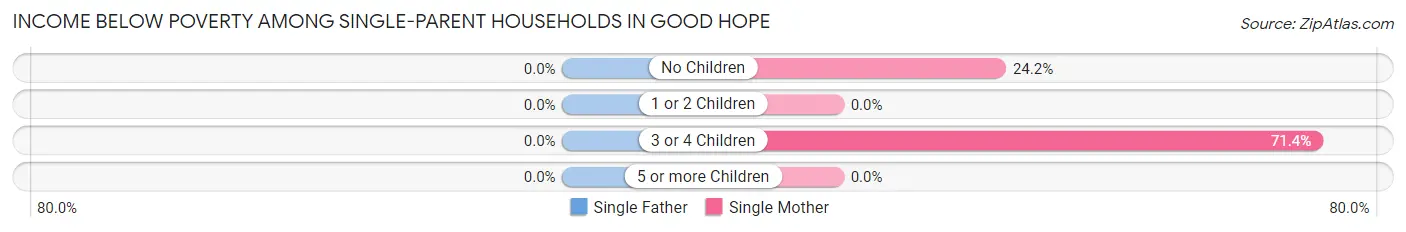
| Children | Single Father | Single Mother |
| No Children | 0 (0.0%) | 30 (24.2%) |
| 1 or 2 Children | 0 (0.0%) | 0 (0.0%) |
| 3 or 4 Children | 0 (0.0%) | 105 (71.4%) |
| 5 or more Children | 0 (0.0%) | 0 (0.0%) |
| Total | 0 (0.0%) | 135 (34.0%) |
Income Below Poverty Among Married-Couple vs Single-Parent Households in Good Hope
The poverty data for Good Hope shows that 114 of the married-couple family households (9.8%) and 135 of the single-parent households (24.6%) are living below the poverty level. Within the married-couple family households, those with 5 or more children have the highest poverty rate, with 29 households (78.4%) falling below the poverty line. Among the single-parent households, those with 3 or 4 children have the highest poverty rate, with 105 household (71.4%) living below poverty.
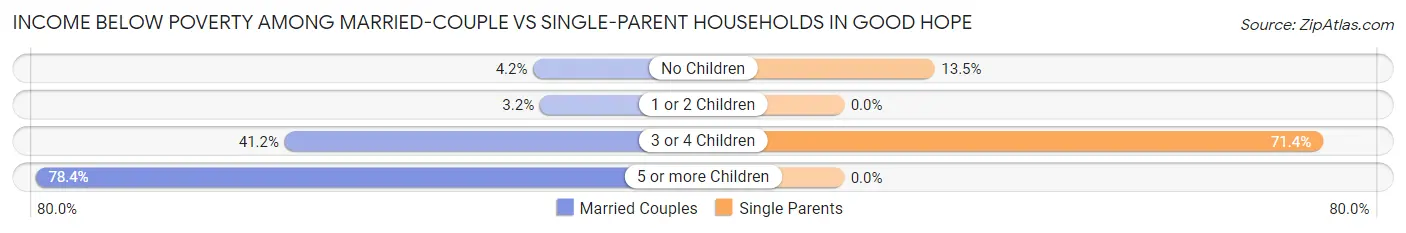
| Children | Married-Couple Families | Single-Parent Households |
| No Children | 24 (4.2%) | 30 (13.5%) |
| 1 or 2 Children | 14 (3.2%) | 0 (0.0%) |
| 3 or 4 Children | 47 (41.2%) | 105 (71.4%) |
| 5 or more Children | 29 (78.4%) | 0 (0.0%) |
| Total | 114 (9.8%) | 135 (24.6%) |
Race in Good Hope
The most populous races in Good Hope are Hispanic or Latino (7,428 | 89.6%), Some other Race (4,781 | 57.7%), and White / Caucasian (2,193 | 26.5%).
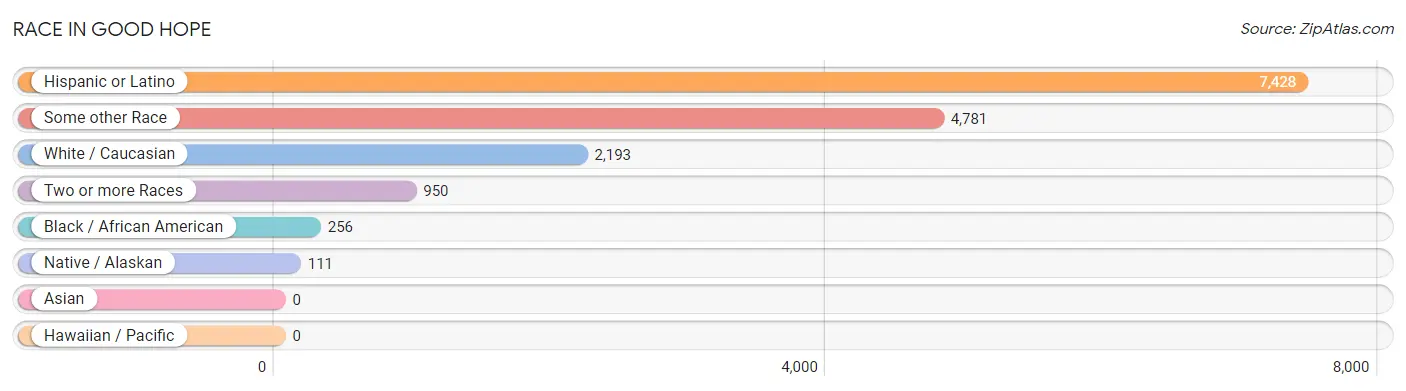
| Race | # Population | % Population |
| Asian | 0 | 0.0% |
| Black / African American | 256 | 3.1% |
| Hawaiian / Pacific | 0 | 0.0% |
| Hispanic or Latino | 7,428 | 89.6% |
| Native / Alaskan | 111 | 1.3% |
| White / Caucasian | 2,193 | 26.5% |
| Two or more Races | 950 | 11.5% |
| Some other Race | 4,781 | 57.7% |
| Total | 8,291 | 100.0% |
Ancestry in Good Hope
The most populous ancestries reported in Good Hope are Mexican (6,906 | 83.3%), Central American (187 | 2.3%), Irish (169 | 2.0%), Guatemalan (152 | 1.8%), and Italian (129 | 1.6%), together accounting for 91.0% of all Good Hope residents.
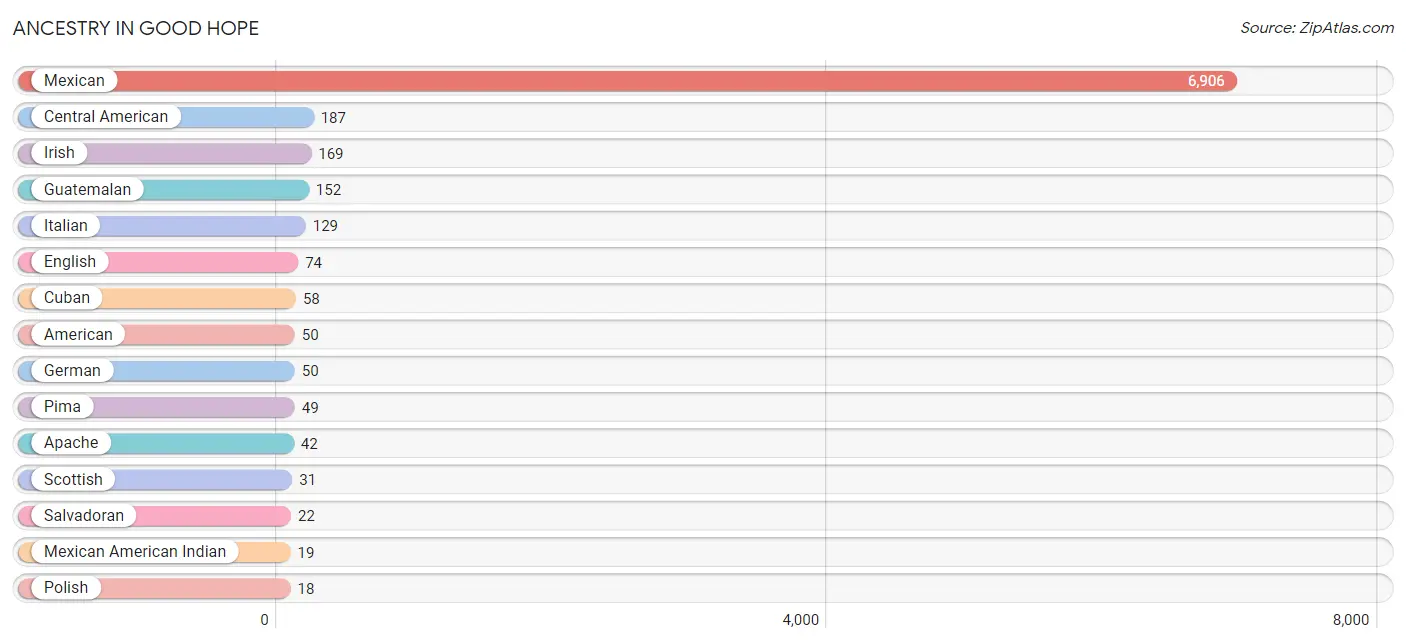
| Ancestry | # Population | % Population |
| African | 8 | 0.1% |
| American | 50 | 0.6% |
| Apache | 42 | 0.5% |
| Central American | 187 | 2.3% |
| Cuban | 58 | 0.7% |
| Czechoslovakian | 11 | 0.1% |
| English | 74 | 0.9% |
| Finnish | 8 | 0.1% |
| French | 4 | 0.1% |
| German | 50 | 0.6% |
| Guatemalan | 152 | 1.8% |
| Honduran | 13 | 0.2% |
| Hungarian | 8 | 0.1% |
| Irish | 169 | 2.0% |
| Italian | 129 | 1.6% |
| Lithuanian | 8 | 0.1% |
| Mexican | 6,906 | 83.3% |
| Mexican American Indian | 19 | 0.2% |
| Pima | 49 | 0.6% |
| Polish | 18 | 0.2% |
| Puerto Rican | 18 | 0.2% |
| Salvadoran | 22 | 0.3% |
| Scottish | 31 | 0.4% |
| Subsaharan African | 8 | 0.1% |
| Yaqui | 11 | 0.1% | View All 25 Rows |
Immigrants in Good Hope
The most numerous immigrant groups reported in Good Hope came from Central America (2,698 | 32.5%), Latin America (2,698 | 32.5%), Mexico (2,534 | 30.6%), and Guatemala (164 | 2.0%), together accounting for 97.6% of all Good Hope residents.
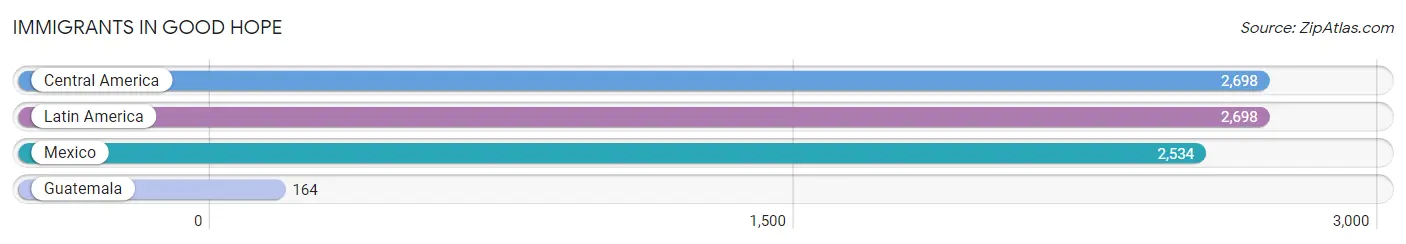
| Immigration Origin | # Population | % Population |
| Central America | 2,698 | 32.5% |
| Guatemala | 164 | 2.0% |
| Latin America | 2,698 | 32.5% |
| Mexico | 2,534 | 30.6% | View All 4 Rows |
Sex and Age in Good Hope
Sex and Age in Good Hope
The most populous age groups in Good Hope are 20 to 24 Years (494 | 11.9%) for men and 50 to 54 Years (424 | 10.3%) for women.
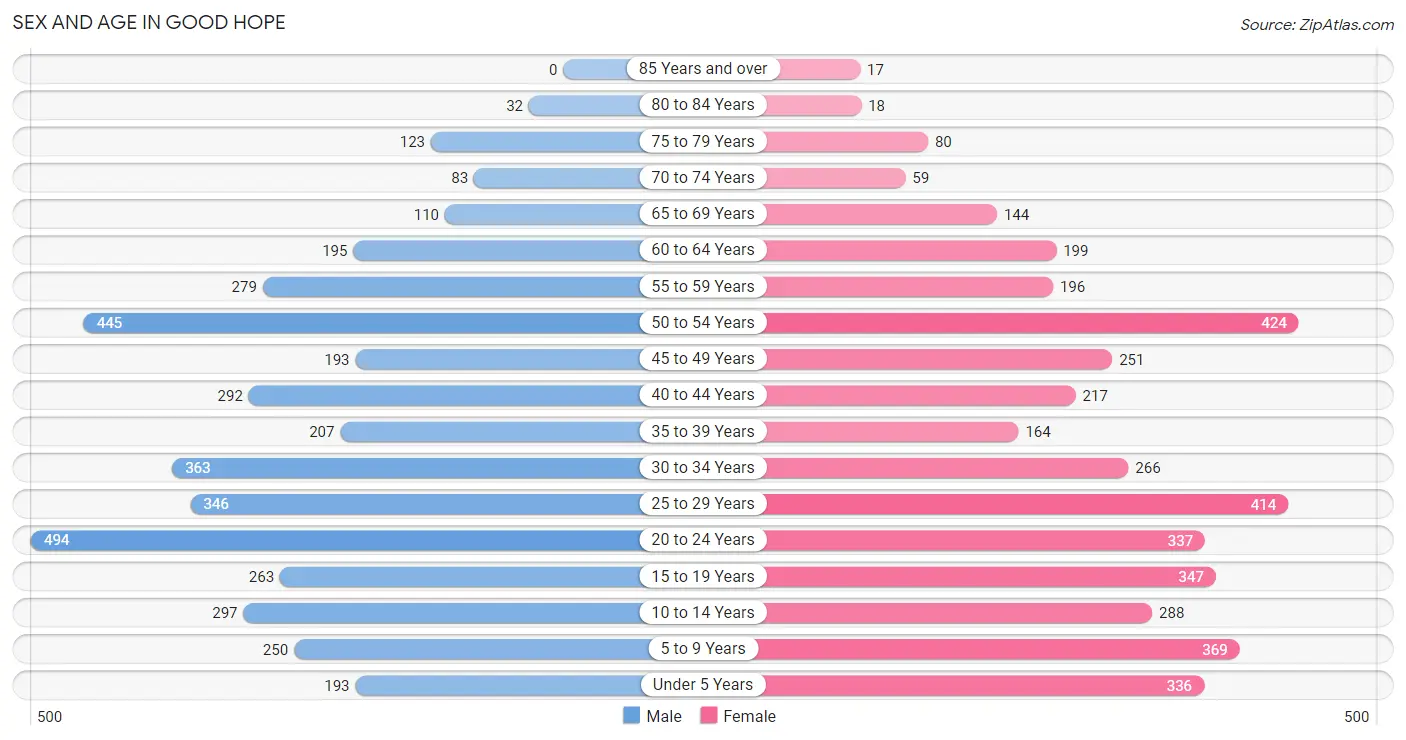
| Age Bracket | Male | Female |
| Under 5 Years | 193 (4.6%) | 336 (8.1%) |
| 5 to 9 Years | 250 (6.0%) | 369 (8.9%) |
| 10 to 14 Years | 297 (7.1%) | 288 (7.0%) |
| 15 to 19 Years | 263 (6.3%) | 347 (8.4%) |
| 20 to 24 Years | 494 (11.9%) | 337 (8.2%) |
| 25 to 29 Years | 346 (8.3%) | 414 (10.0%) |
| 30 to 34 Years | 363 (8.7%) | 266 (6.5%) |
| 35 to 39 Years | 207 (5.0%) | 164 (4.0%) |
| 40 to 44 Years | 292 (7.0%) | 217 (5.3%) |
| 45 to 49 Years | 193 (4.6%) | 251 (6.1%) |
| 50 to 54 Years | 445 (10.7%) | 424 (10.3%) |
| 55 to 59 Years | 279 (6.7%) | 196 (4.8%) |
| 60 to 64 Years | 195 (4.7%) | 199 (4.8%) |
| 65 to 69 Years | 110 (2.6%) | 144 (3.5%) |
| 70 to 74 Years | 83 (2.0%) | 59 (1.4%) |
| 75 to 79 Years | 123 (2.9%) | 80 (1.9%) |
| 80 to 84 Years | 32 (0.8%) | 18 (0.4%) |
| 85 Years and over | 0 (0.0%) | 17 (0.4%) |
| Total | 4,165 (100.0%) | 4,126 (100.0%) |
Families and Households in Good Hope
Median Family Size in Good Hope
The median family size in Good Hope is 4.38 persons per family, with single female/mother families (397 | 23.2%) accounting for the largest median family size of 4.86 persons per family. On the other hand, single male/father families (151 | 8.8%) represent the smallest median family size with 3.30 persons per family.
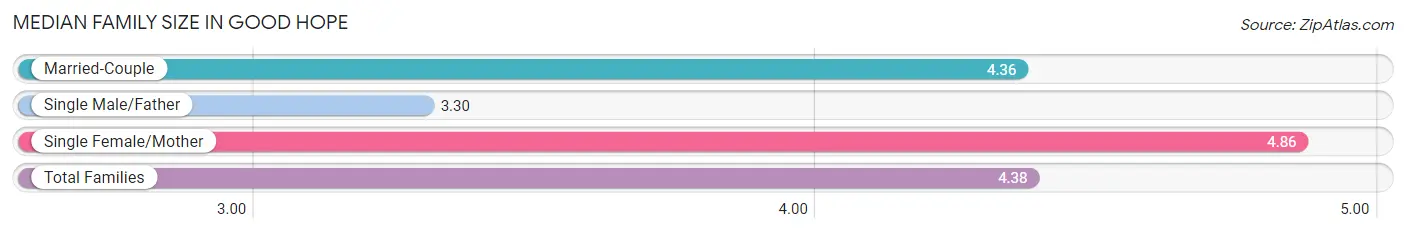
| Family Type | # Families | Family Size |
| Married-Couple | 1,160 (67.9%) | 4.36 |
| Single Male/Father | 151 (8.8%) | 3.30 |
| Single Female/Mother | 397 (23.2%) | 4.86 |
| Total Families | 1,708 (100.0%) | 4.38 |
Median Household Size in Good Hope
The median household size in Good Hope is 4.13 persons per household, with single female/mother households (397 | 19.8%) accounting for the largest median household size of 4.88 persons per household. non-family households (294 | 14.7%) represent the smallest median household size with 1.74 persons per household.
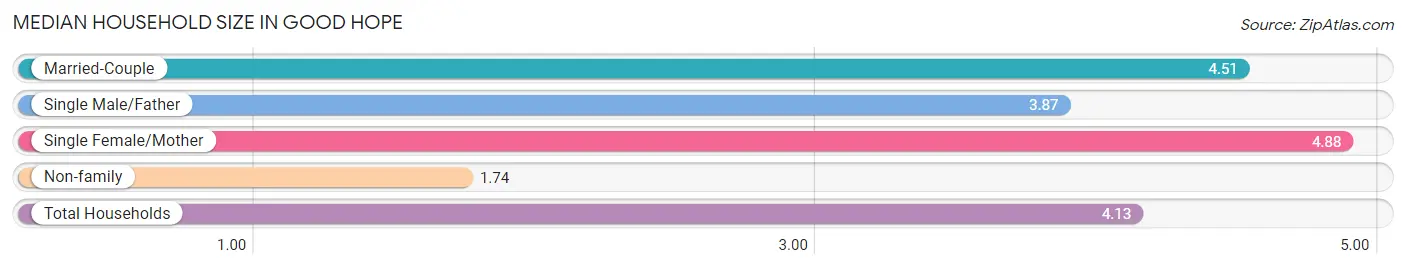
| Household Type | # Households | Household Size |
| Married-Couple | 1,160 (57.9%) | 4.51 |
| Single Male/Father | 151 (7.5%) | 3.87 |
| Single Female/Mother | 397 (19.8%) | 4.88 |
| Non-family | 294 (14.7%) | 1.74 |
| Total Households | 2,002 (100.0%) | 4.13 |
Household Size by Marriage Status in Good Hope
Out of a total of 2,002 households in Good Hope, 1,708 (85.3%) are family households, while 294 (14.7%) are nonfamily households. The most numerous type of family households are 4-person households, comprising 391, and the most common type of nonfamily households are 1-person households, comprising 189.
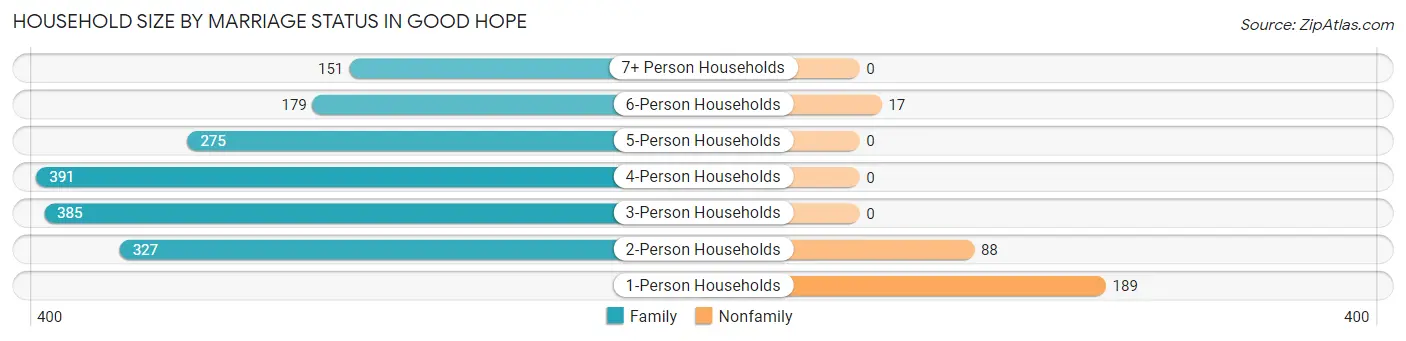
| Household Size | Family Households | Nonfamily Households |
| 1-Person Households | - | 189 (9.4%) |
| 2-Person Households | 327 (16.3%) | 88 (4.4%) |
| 3-Person Households | 385 (19.2%) | 0 (0.0%) |
| 4-Person Households | 391 (19.5%) | 0 (0.0%) |
| 5-Person Households | 275 (13.7%) | 0 (0.0%) |
| 6-Person Households | 179 (8.9%) | 17 (0.9%) |
| 7+ Person Households | 151 (7.5%) | 0 (0.0%) |
| Total | 1,708 (85.3%) | 294 (14.7%) |
Female Fertility in Good Hope
Fertility by Age in Good Hope
Average fertility rate in Good Hope is 99.0 births per 1,000 women. Women in the age bracket of 20 to 34 years have the highest fertility rate with 200.0 births per 1,000 women. Women in the age bracket of 20 to 34 years acount for 100.0% of all women with births.
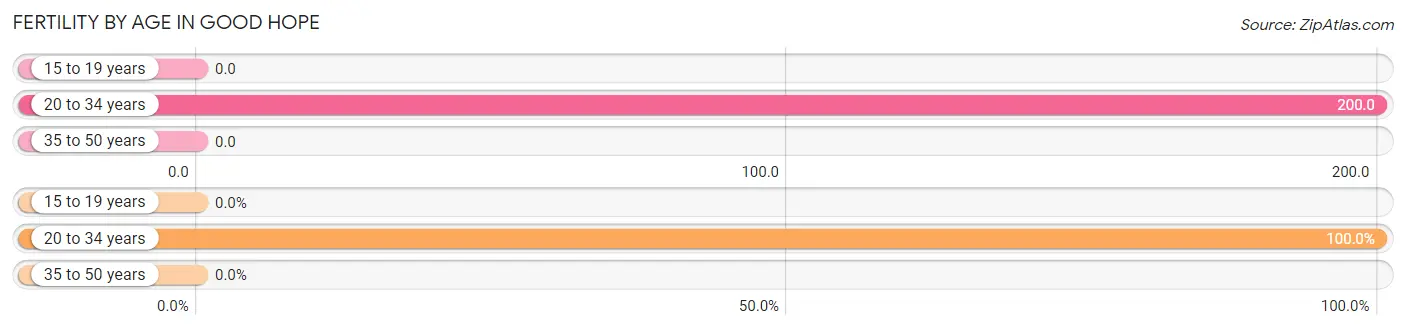
| Age Bracket | Women with Births | Births / 1,000 Women |
| 15 to 19 years | 0 (0.0%) | 0.0 |
| 20 to 34 years | 203 (100.0%) | 200.0 |
| 35 to 50 years | 0 (0.0%) | 0.0 |
| Total | 203 (100.0%) | 99.0 |
Fertility by Age by Marriage Status in Good Hope
58.1% of women with births (203) in Good Hope are married. The highest percentage of unmarried women with births falls into 20 to 34 years age bracket with 41.9% of them unmarried at the time of birth, while the lowest percentage of unmarried women with births belong to 20 to 34 years age bracket with 41.9% of them unmarried.
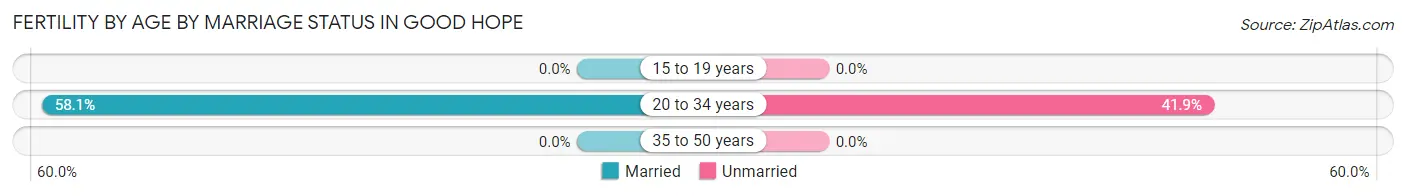
| Age Bracket | Married | Unmarried |
| 15 to 19 years | 0 (0.0%) | 0 (0.0%) |
| 20 to 34 years | 118 (58.1%) | 85 (41.9%) |
| 35 to 50 years | 0 (0.0%) | 0 (0.0%) |
| Total | 118 (58.1%) | 85 (41.9%) |
Fertility by Education in Good Hope
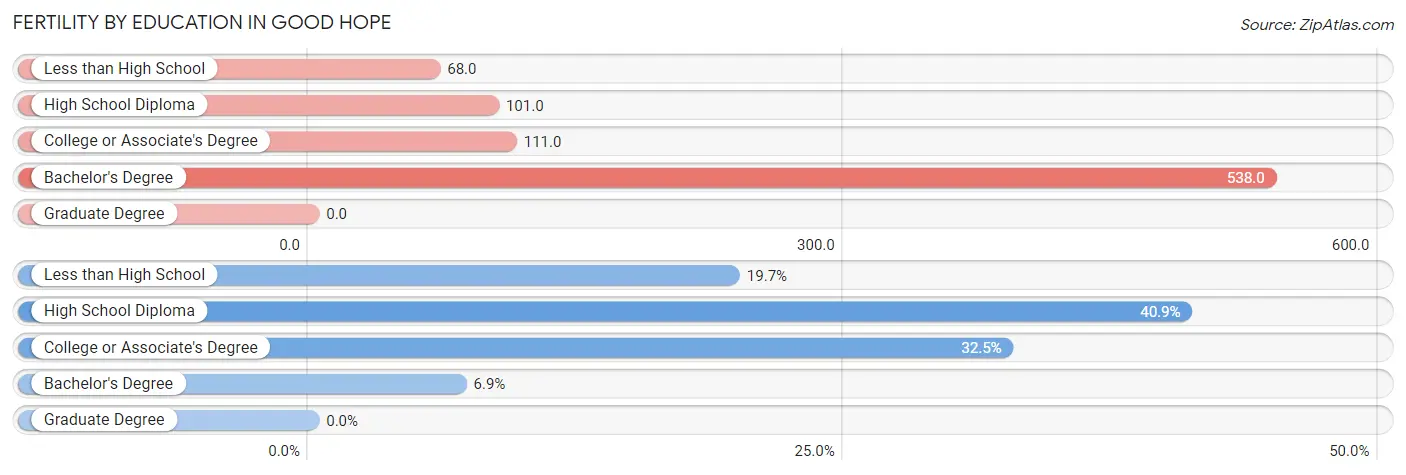
| Educational Attainment | Women with Births | Births / 1,000 Women |
| Less than High School | 40 (19.7%) | 68.0 |
| High School Diploma | 83 (40.9%) | 101.0 |
| College or Associate's Degree | 66 (32.5%) | 111.0 |
| Bachelor's Degree | 14 (6.9%) | 538.0 |
| Graduate Degree | 0 (0.0%) | 0.0 |
| Total | 203 (100.0%) | 99.0 |
Fertility by Education by Marriage Status in Good Hope
41.9% of women with births in Good Hope are unmarried. Women with the educational attainment of high school diploma are most likely to be married with 100.0% of them married at childbirth, while women with the educational attainment of less than high school are least likely to be married with 100.0% of them unmarried at childbirth.
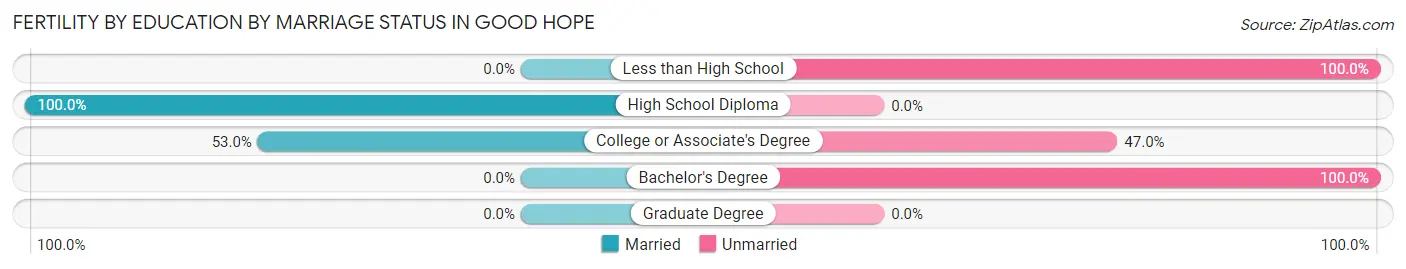
| Educational Attainment | Married | Unmarried |
| Less than High School | 0 (0.0%) | 40 (100.0%) |
| High School Diploma | 83 (100.0%) | 0 (0.0%) |
| College or Associate's Degree | 35 (53.0%) | 31 (47.0%) |
| Bachelor's Degree | 0 (0.0%) | 14 (100.0%) |
| Graduate Degree | 0 (0.0%) | 0 (0.0%) |
| Total | 118 (58.1%) | 85 (41.9%) |
Employment Characteristics in Good Hope
Employment by Class of Employer in Good Hope
Among the 3,160 employed individuals in Good Hope, private company employees (2,667 | 84.4%), local government employees (220 | 7.0%), and self-employed (not incorporated) (132 | 4.2%) make up the most common classes of employment.
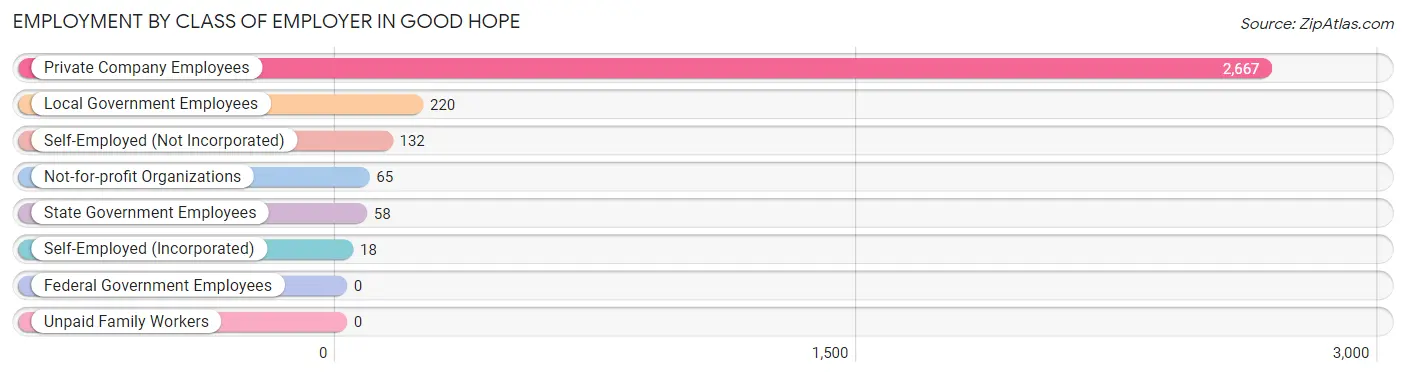
| Employer Class | # Employees | % Employees |
| Private Company Employees | 2,667 | 84.4% |
| Self-Employed (Incorporated) | 18 | 0.6% |
| Self-Employed (Not Incorporated) | 132 | 4.2% |
| Not-for-profit Organizations | 65 | 2.1% |
| Local Government Employees | 220 | 7.0% |
| State Government Employees | 58 | 1.8% |
| Federal Government Employees | 0 | 0.0% |
| Unpaid Family Workers | 0 | 0.0% |
| Total | 3,160 | 100.0% |
Employment Status by Age in Good Hope
According to the labor force statistics for Good Hope, out of the total population over 16 years of age (6,420), 57.9% or 3,717 individuals are in the labor force, with 12.4% or 461 of them unemployed. The age group with the highest labor force participation rate is 25 to 29 years, with 77.1% or 586 individuals in the labor force. Within the labor force, the 75 years and over age range has the highest percentage of unemployed individuals, with 100.0% or 9 of them being unemployed.
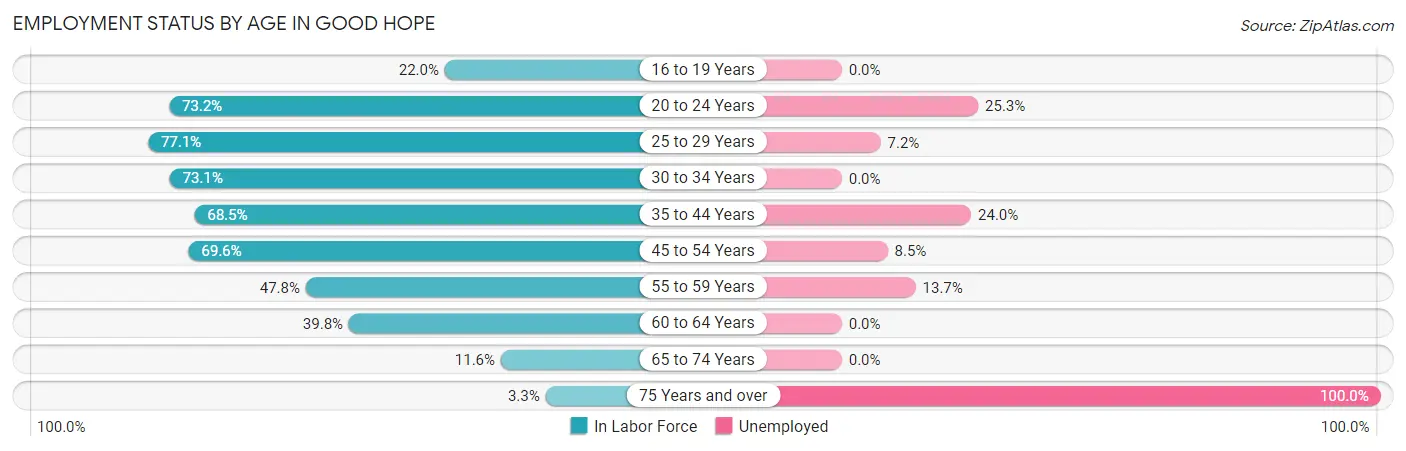
| Age Bracket | In Labor Force | Unemployed |
| 16 to 19 Years | 104 (22.0%) | 0 (0.0%) |
| 20 to 24 Years | 608 (73.2%) | 154 (25.3%) |
| 25 to 29 Years | 586 (77.1%) | 42 (7.2%) |
| 30 to 34 Years | 460 (73.1%) | 0 (0.0%) |
| 35 to 44 Years | 603 (68.5%) | 145 (24.0%) |
| 45 to 54 Years | 914 (69.6%) | 78 (8.5%) |
| 55 to 59 Years | 227 (47.8%) | 31 (13.7%) |
| 60 to 64 Years | 157 (39.8%) | 0 (0.0%) |
| 65 to 74 Years | 46 (11.6%) | 0 (0.0%) |
| 75 Years and over | 9 (3.3%) | 9 (100.0%) |
| Total | 3,717 (57.9%) | 461 (12.4%) |
Employment Status by Educational Attainment in Good Hope
According to labor force statistics for Good Hope, 66.2% of individuals (2,947) out of the total population between 25 and 64 years of age (4,451) are in the labor force, with 10.0% or 295 of them being unemployed. The group with the highest labor force participation rate are those with the educational attainment of college / associate degree, with 78.3% or 817 individuals in the labor force. Within the labor force, individuals with less than high school education have the highest percentage of unemployment, with 20.1% or 205 of them being unemployed.
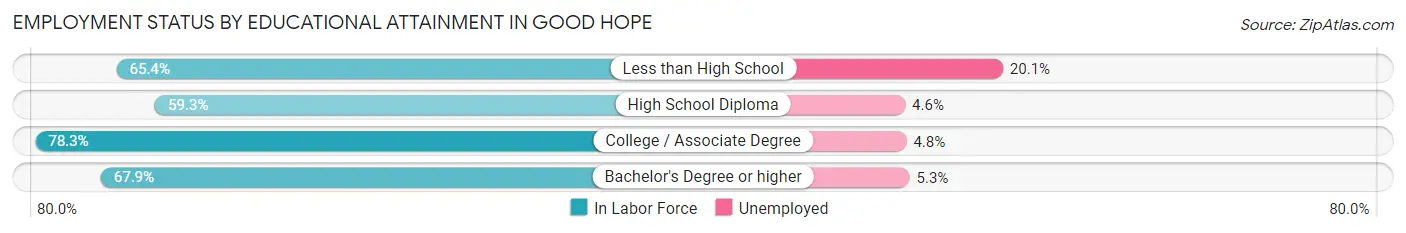
| Educational Attainment | In Labor Force | Unemployed |
| Less than High School | 1,019 (65.4%) | 313 (20.1%) |
| High School Diploma | 997 (59.3%) | 77 (4.6%) |
| College / Associate Degree | 817 (78.3%) | 50 (4.8%) |
| Bachelor's Degree or higher | 114 (67.9%) | 9 (5.3%) |
| Total | 2,947 (66.2%) | 445 (10.0%) |
Employment Occupations by Sex in Good Hope
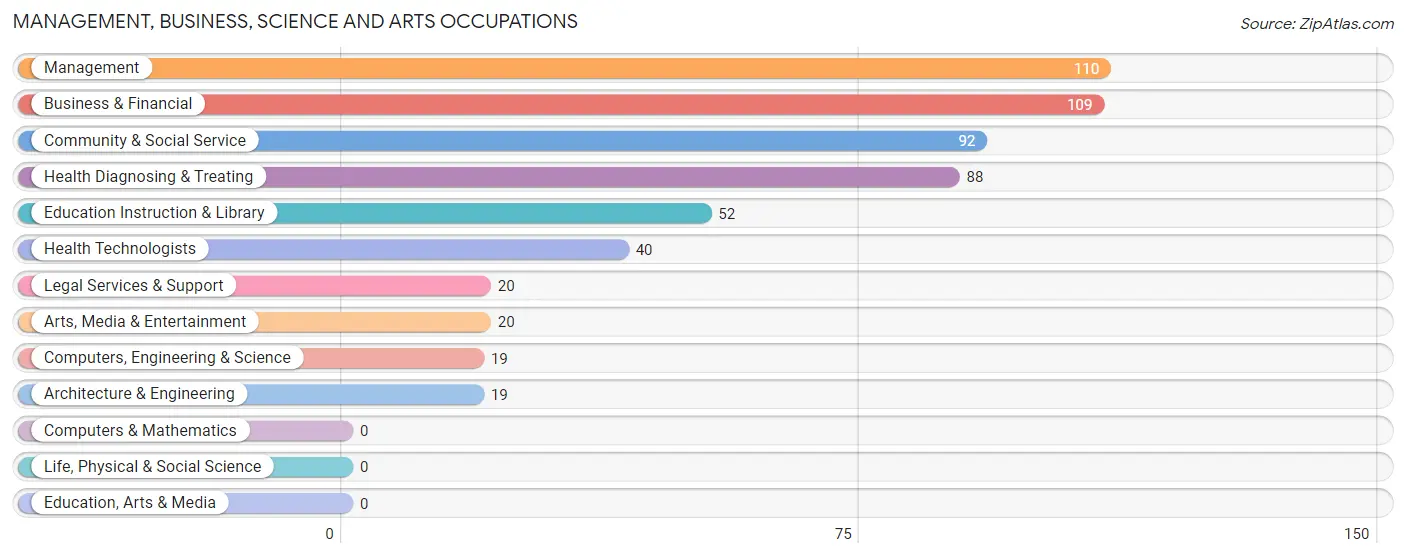
Management, Business, Science and Arts Occupations
The most common Management, Business, Science and Arts occupations in Good Hope are Management (110 | 3.4%), Business & Financial (109 | 3.4%), Community & Social Service (92 | 2.8%), Health Diagnosing & Treating (88 | 2.7%), and Education Instruction & Library (52 | 1.6%).
Management, Business, Science and Arts Occupations by Sex
Within the Management, Business, Science and Arts occupations in Good Hope, the most male-oriented occupations are Computers, Engineering & Science (100.0%), Architecture & Engineering (100.0%), and Arts, Media & Entertainment (85.0%), while the most female-oriented occupations are Legal Services & Support (100.0%), Health Diagnosing & Treating (100.0%), and Health Technologists (100.0%).
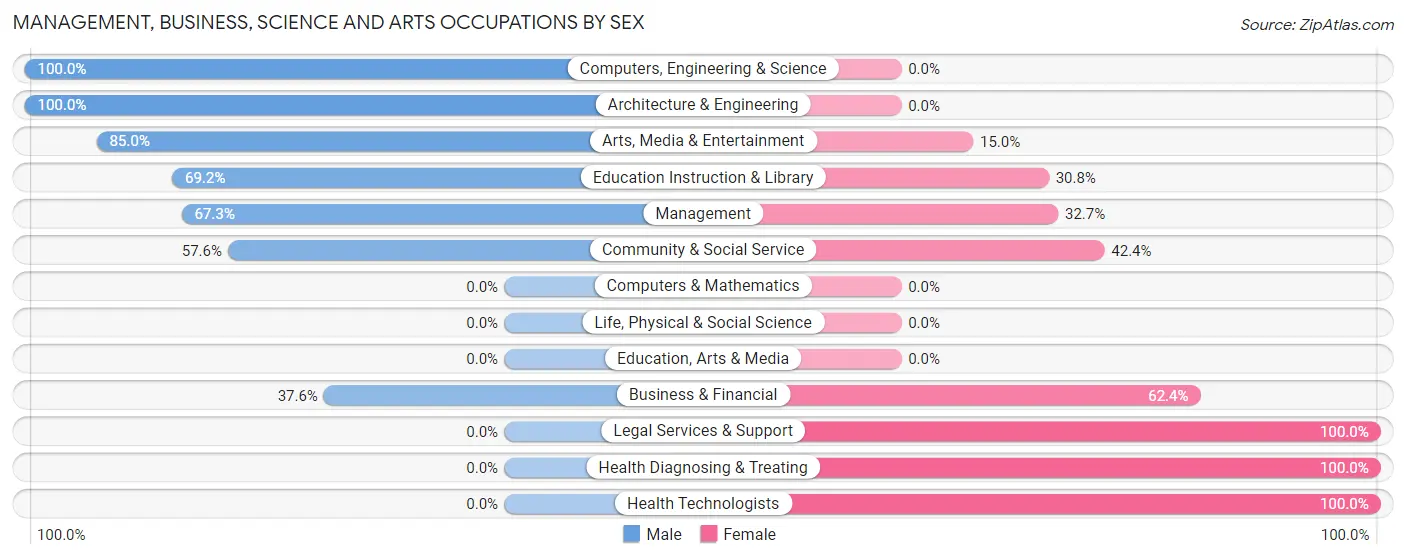
| Occupation | Male | Female |
| Management | 74 (67.3%) | 36 (32.7%) |
| Business & Financial | 41 (37.6%) | 68 (62.4%) |
| Computers, Engineering & Science | 19 (100.0%) | 0 (0.0%) |
| Computers & Mathematics | 0 (0.0%) | 0 (0.0%) |
| Architecture & Engineering | 19 (100.0%) | 0 (0.0%) |
| Life, Physical & Social Science | 0 (0.0%) | 0 (0.0%) |
| Community & Social Service | 53 (57.6%) | 39 (42.4%) |
| Education, Arts & Media | 0 (0.0%) | 0 (0.0%) |
| Legal Services & Support | 0 (0.0%) | 20 (100.0%) |
| Education Instruction & Library | 36 (69.2%) | 16 (30.8%) |
| Arts, Media & Entertainment | 17 (85.0%) | 3 (15.0%) |
| Health Diagnosing & Treating | 0 (0.0%) | 88 (100.0%) |
| Health Technologists | 0 (0.0%) | 40 (100.0%) |
| Total (Category) | 187 (44.7%) | 231 (55.3%) |
| Total (Overall) | 2,067 (63.5%) | 1,188 (36.5%) |
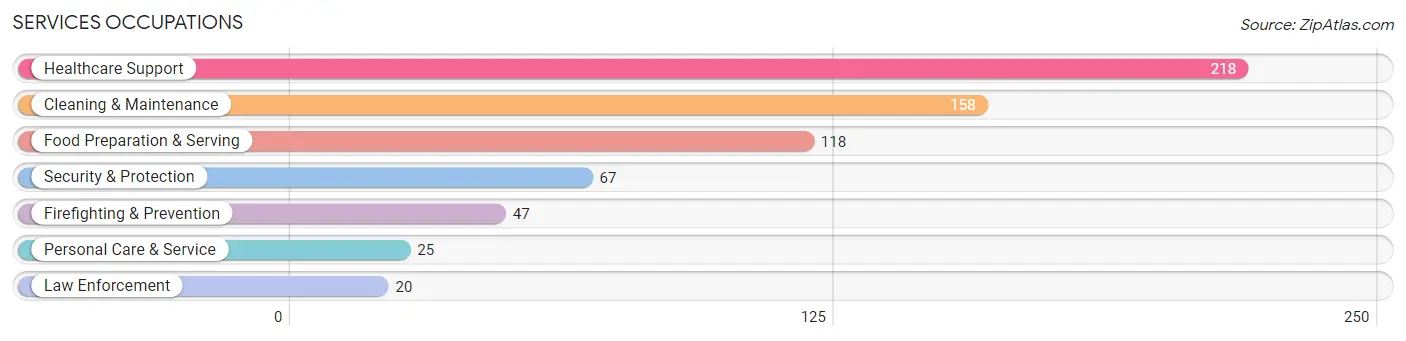
Services Occupations
The most common Services occupations in Good Hope are Healthcare Support (218 | 6.7%), Cleaning & Maintenance (158 | 4.9%), Food Preparation & Serving (118 | 3.6%), Security & Protection (67 | 2.1%), and Firefighting & Prevention (47 | 1.4%).
Services Occupations by Sex
Within the Services occupations in Good Hope, the most male-oriented occupations are Personal Care & Service (100.0%), Cleaning & Maintenance (93.7%), and Food Preparation & Serving (52.5%), while the most female-oriented occupations are Law Enforcement (100.0%), Healthcare Support (96.8%), and Security & Protection (89.5%).
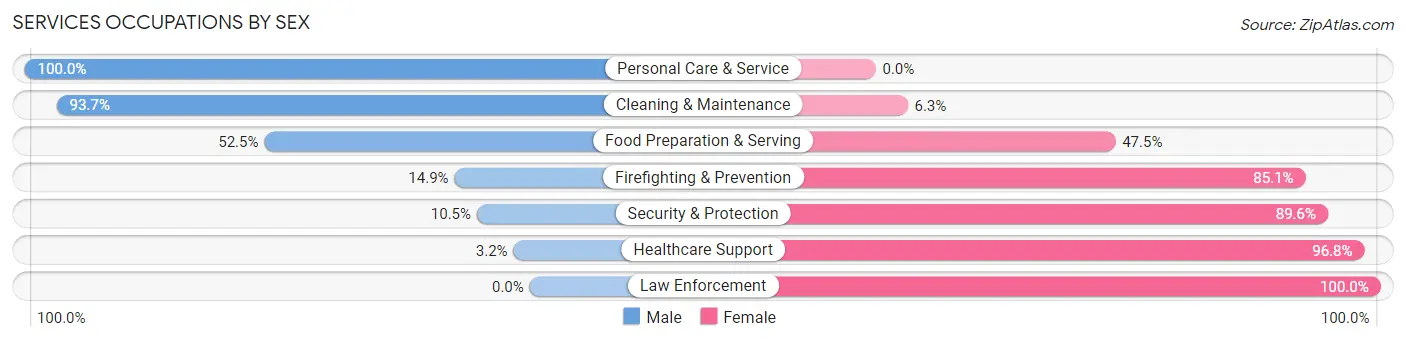
| Occupation | Male | Female |
| Healthcare Support | 7 (3.2%) | 211 (96.8%) |
| Security & Protection | 7 (10.4%) | 60 (89.5%) |
| Firefighting & Prevention | 7 (14.9%) | 40 (85.1%) |
| Law Enforcement | 0 (0.0%) | 20 (100.0%) |
| Food Preparation & Serving | 62 (52.5%) | 56 (47.5%) |
| Cleaning & Maintenance | 148 (93.7%) | 10 (6.3%) |
| Personal Care & Service | 25 (100.0%) | 0 (0.0%) |
| Total (Category) | 249 (42.5%) | 337 (57.5%) |
| Total (Overall) | 2,067 (63.5%) | 1,188 (36.5%) |
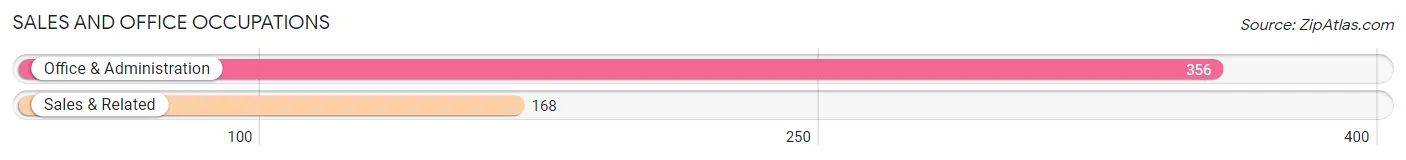
Sales and Office Occupations
The most common Sales and Office occupations in Good Hope are Office & Administration (356 | 10.9%), and Sales & Related (168 | 5.2%).
Sales and Office Occupations by Sex
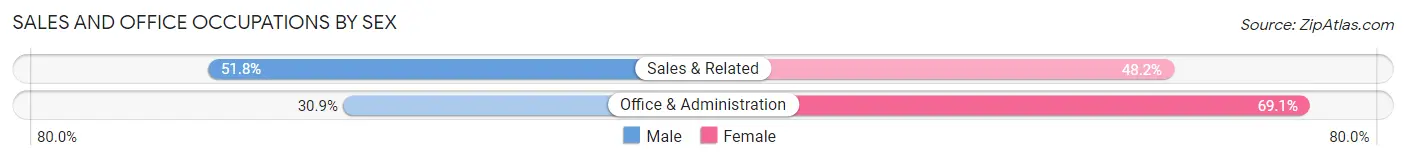
| Occupation | Male | Female |
| Sales & Related | 87 (51.8%) | 81 (48.2%) |
| Office & Administration | 110 (30.9%) | 246 (69.1%) |
| Total (Category) | 197 (37.6%) | 327 (62.4%) |
| Total (Overall) | 2,067 (63.5%) | 1,188 (36.5%) |
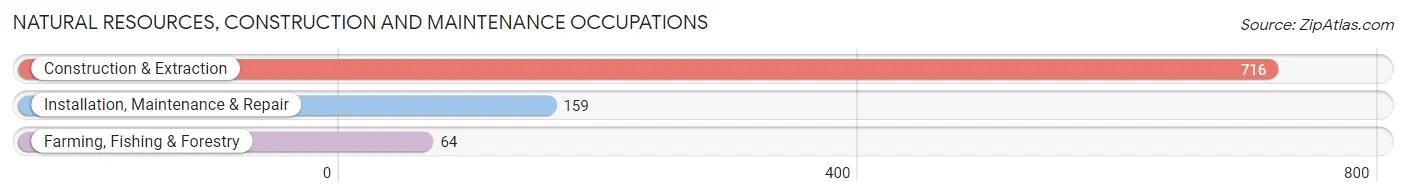
Natural Resources, Construction and Maintenance Occupations
The most common Natural Resources, Construction and Maintenance occupations in Good Hope are Construction & Extraction (716 | 22.0%), Installation, Maintenance & Repair (159 | 4.9%), and Farming, Fishing & Forestry (64 | 2.0%).
Natural Resources, Construction and Maintenance Occupations by Sex
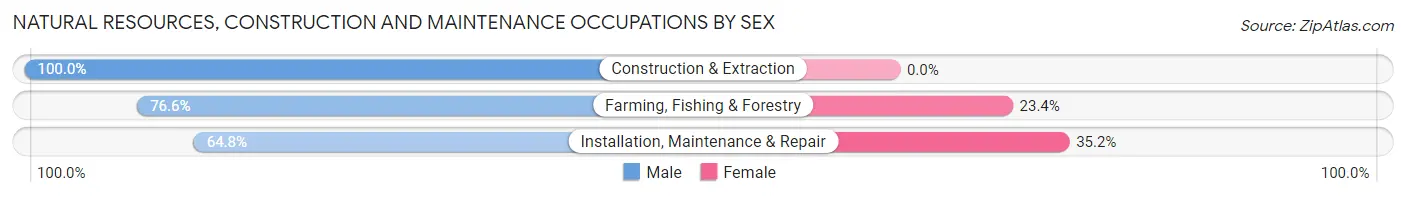
| Occupation | Male | Female |
| Farming, Fishing & Forestry | 49 (76.6%) | 15 (23.4%) |
| Construction & Extraction | 716 (100.0%) | 0 (0.0%) |
| Installation, Maintenance & Repair | 103 (64.8%) | 56 (35.2%) |
| Total (Category) | 868 (92.4%) | 71 (7.6%) |
| Total (Overall) | 2,067 (63.5%) | 1,188 (36.5%) |
Production, Transportation and Moving Occupations
The most common Production, Transportation and Moving occupations in Good Hope are Material Moving (290 | 8.9%), Transportation (257 | 7.9%), and Production (241 | 7.4%).
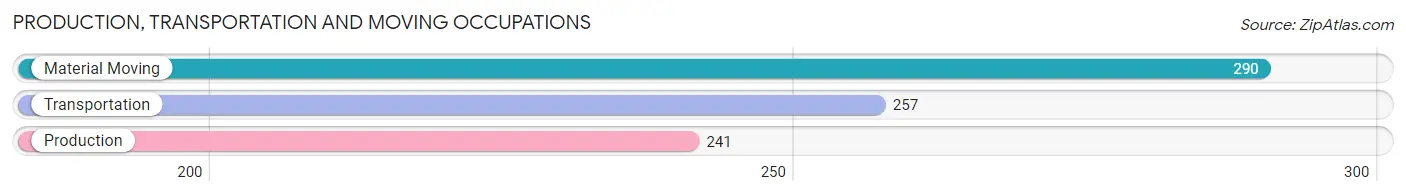
Production, Transportation and Moving Occupations by Sex
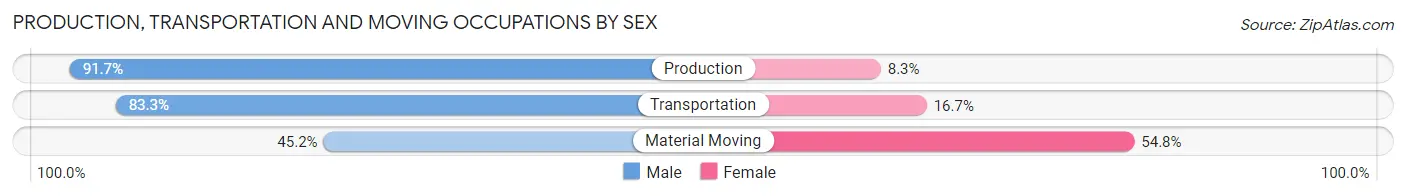
| Occupation | Male | Female |
| Production | 221 (91.7%) | 20 (8.3%) |
| Transportation | 214 (83.3%) | 43 (16.7%) |
| Material Moving | 131 (45.2%) | 159 (54.8%) |
| Total (Category) | 566 (71.8%) | 222 (28.2%) |
| Total (Overall) | 2,067 (63.5%) | 1,188 (36.5%) |
Employment Industries by Sex in Good Hope
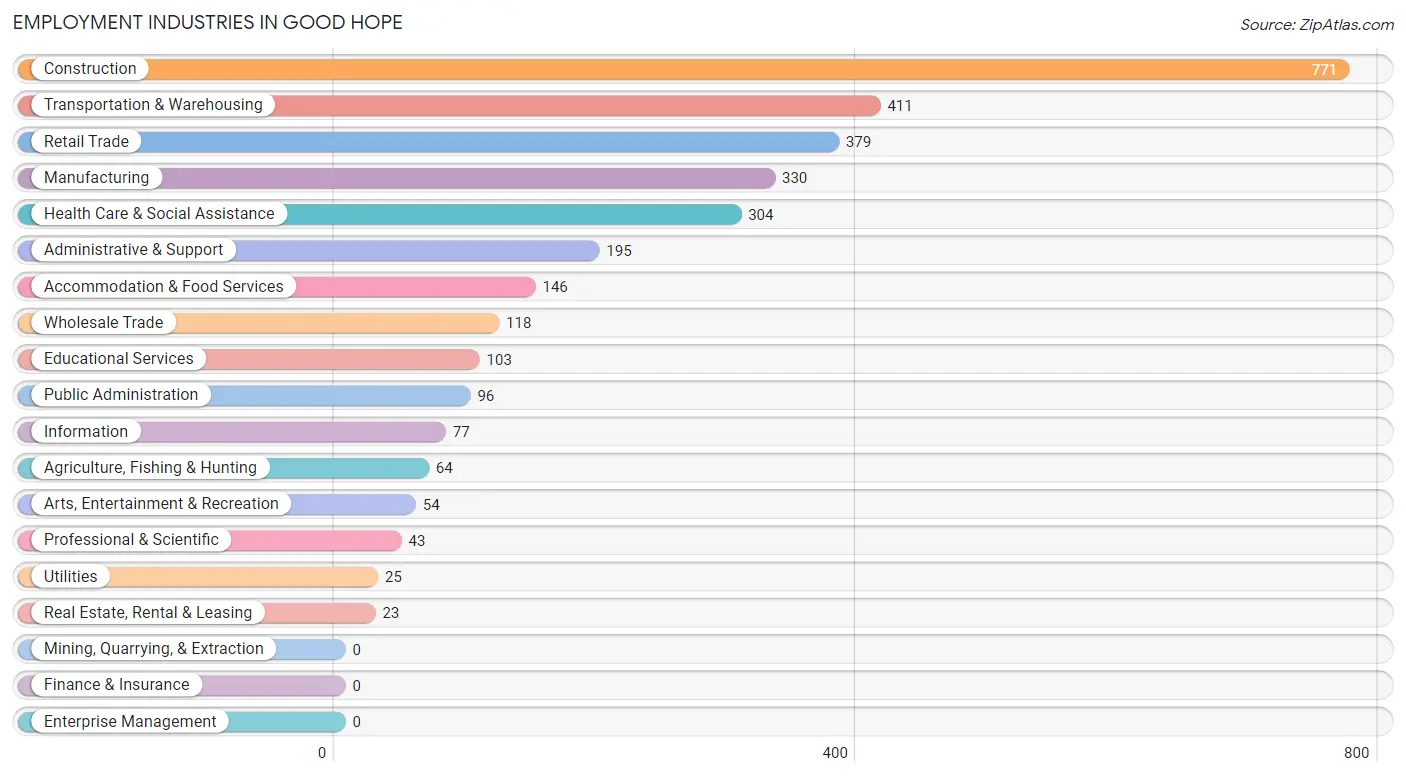
Employment Industries in Good Hope
The major employment industries in Good Hope include Construction (771 | 23.7%), Transportation & Warehousing (411 | 12.6%), Retail Trade (379 | 11.6%), Manufacturing (330 | 10.1%), and Health Care & Social Assistance (304 | 9.3%).
Employment Industries by Sex in Good Hope
The Good Hope industries that see more men than women are Utilities (100.0%), Real Estate, Rental & Leasing (100.0%), and Arts, Entertainment & Recreation (100.0%), whereas the industries that tend to have a higher number of women are Health Care & Social Assistance (97.7%), Public Administration (86.5%), and Information (68.8%).
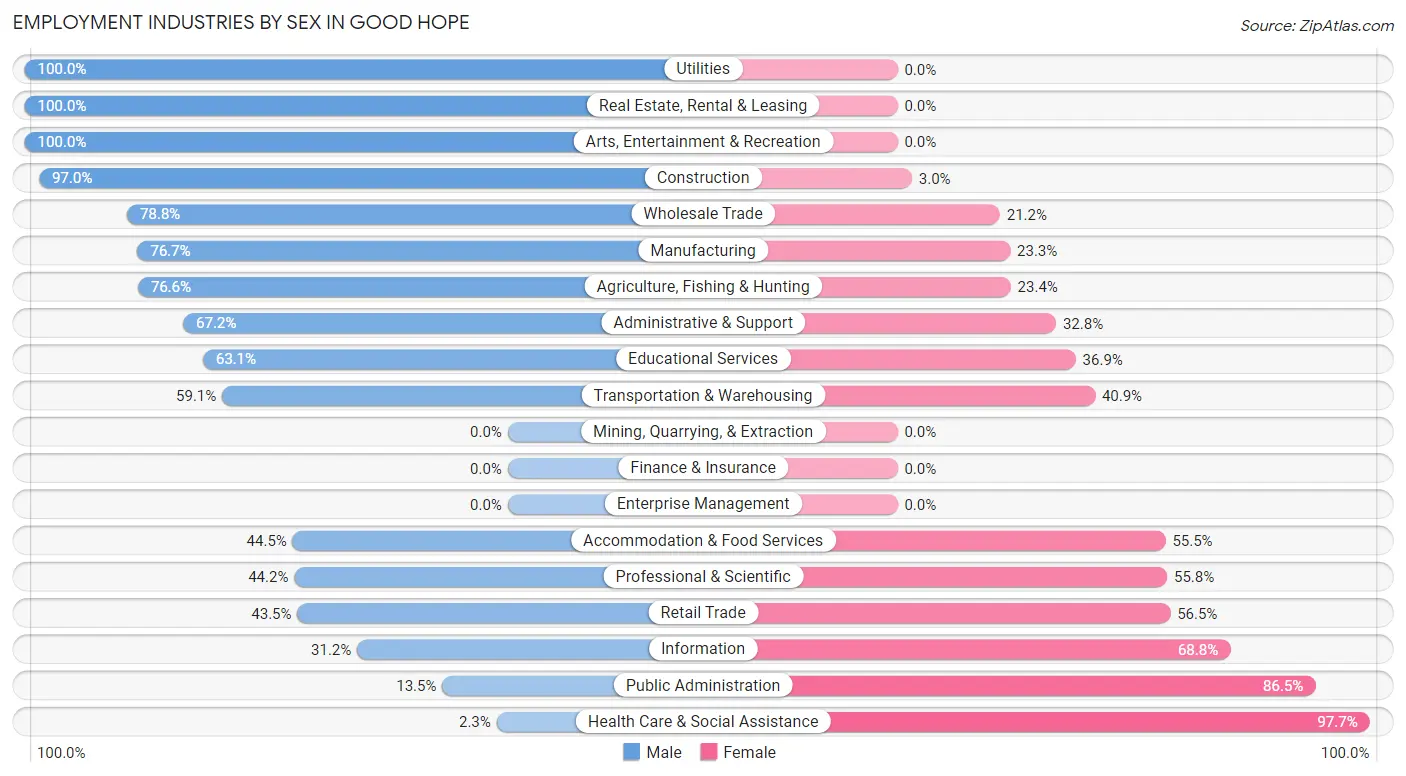
| Industry | Male | Female |
| Agriculture, Fishing & Hunting | 49 (76.6%) | 15 (23.4%) |
| Mining, Quarrying, & Extraction | 0 (0.0%) | 0 (0.0%) |
| Construction | 748 (97.0%) | 23 (3.0%) |
| Manufacturing | 253 (76.7%) | 77 (23.3%) |
| Wholesale Trade | 93 (78.8%) | 25 (21.2%) |
| Retail Trade | 165 (43.5%) | 214 (56.5%) |
| Transportation & Warehousing | 243 (59.1%) | 168 (40.9%) |
| Utilities | 25 (100.0%) | 0 (0.0%) |
| Information | 24 (31.2%) | 53 (68.8%) |
| Finance & Insurance | 0 (0.0%) | 0 (0.0%) |
| Real Estate, Rental & Leasing | 23 (100.0%) | 0 (0.0%) |
| Professional & Scientific | 19 (44.2%) | 24 (55.8%) |
| Enterprise Management | 0 (0.0%) | 0 (0.0%) |
| Administrative & Support | 131 (67.2%) | 64 (32.8%) |
| Educational Services | 65 (63.1%) | 38 (36.9%) |
| Health Care & Social Assistance | 7 (2.3%) | 297 (97.7%) |
| Arts, Entertainment & Recreation | 54 (100.0%) | 0 (0.0%) |
| Accommodation & Food Services | 65 (44.5%) | 81 (55.5%) |
| Public Administration | 13 (13.5%) | 83 (86.5%) |
| Total | 2,067 (63.5%) | 1,188 (36.5%) |
Education in Good Hope
School Enrollment in Good Hope
The most common levels of schooling among the 2,099 students in Good Hope are high school (519 | 24.7%), middle school (512 | 24.4%), and elementary school (485 | 23.1%).
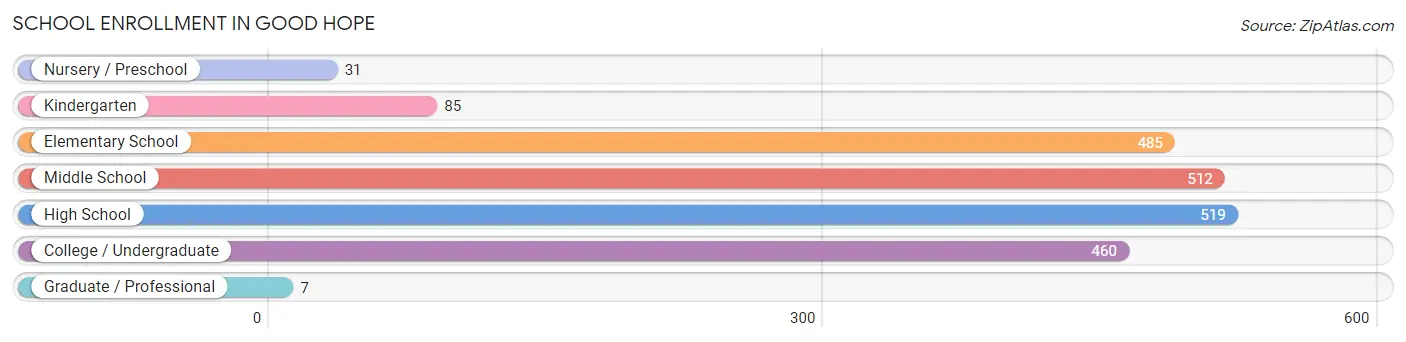
| School Level | # Students | % Students |
| Nursery / Preschool | 31 | 1.5% |
| Kindergarten | 85 | 4.1% |
| Elementary School | 485 | 23.1% |
| Middle School | 512 | 24.4% |
| High School | 519 | 24.7% |
| College / Undergraduate | 460 | 21.9% |
| Graduate / Professional | 7 | 0.3% |
| Total | 2,099 | 100.0% |
School Enrollment by Age by Funding Source in Good Hope
Out of a total of 2,099 students who are enrolled in schools in Good Hope, 128 (6.1%) attend a private institution, while the remaining 1,971 (93.9%) are enrolled in public schools. The age group of 25 to 34 year olds has the highest likelihood of being enrolled in private schools, with 43 (24.9% in the age bracket) enrolled. Conversely, the age group of 3 to 4 year olds has the lowest likelihood of being enrolled in a private school, with 52 (100.0% in the age bracket) attending a public institution.
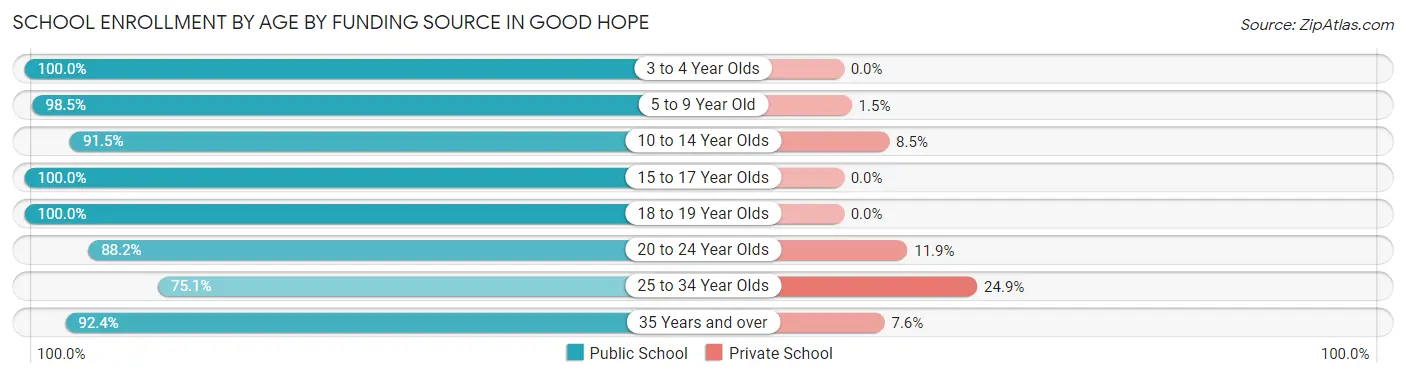
| Age Bracket | Public School | Private School |
| 3 to 4 Year Olds | 52 (100.0%) | 0 (0.0%) |
| 5 to 9 Year Old | 529 (98.5%) | 8 (1.5%) |
| 10 to 14 Year Olds | 486 (91.5%) | 45 (8.5%) |
| 15 to 17 Year Olds | 353 (100.0%) | 0 (0.0%) |
| 18 to 19 Year Olds | 150 (100.0%) | 0 (0.0%) |
| 20 to 24 Year Olds | 186 (88.1%) | 25 (11.8%) |
| 25 to 34 Year Olds | 130 (75.1%) | 43 (24.9%) |
| 35 Years and over | 85 (92.4%) | 7 (7.6%) |
| Total | 1,971 (93.9%) | 128 (6.1%) |
Educational Attainment by Field of Study in Good Hope
Business (57 | 25.0%), liberal arts & history (36 | 15.8%), education (26 | 11.4%), visual & performing arts (24 | 10.5%), and multidisciplinary studies (17 | 7.5%) are the most common fields of study among 228 individuals in Good Hope who have obtained a bachelor's degree or higher.
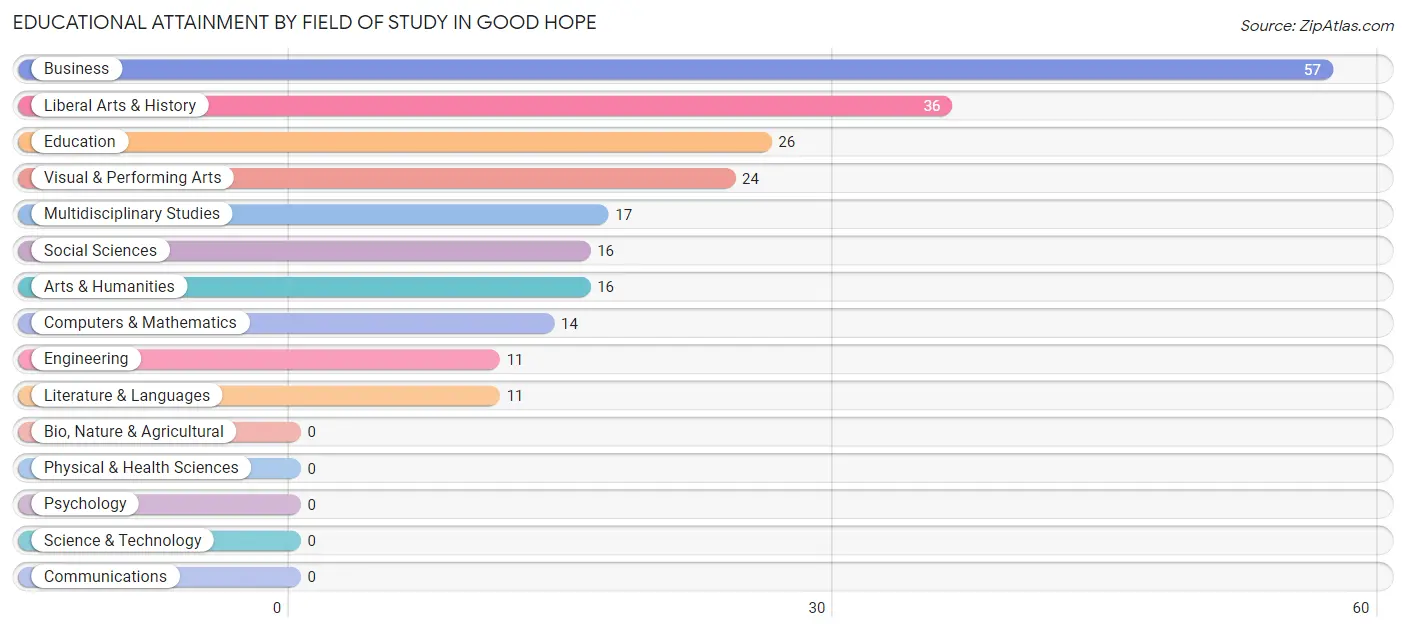
| Field of Study | # Graduates | % Graduates |
| Computers & Mathematics | 14 | 6.1% |
| Bio, Nature & Agricultural | 0 | 0.0% |
| Physical & Health Sciences | 0 | 0.0% |
| Psychology | 0 | 0.0% |
| Social Sciences | 16 | 7.0% |
| Engineering | 11 | 4.8% |
| Multidisciplinary Studies | 17 | 7.5% |
| Science & Technology | 0 | 0.0% |
| Business | 57 | 25.0% |
| Education | 26 | 11.4% |
| Literature & Languages | 11 | 4.8% |
| Liberal Arts & History | 36 | 15.8% |
| Visual & Performing Arts | 24 | 10.5% |
| Communications | 0 | 0.0% |
| Arts & Humanities | 16 | 7.0% |
| Total | 228 | 100.0% |
Transportation & Commute in Good Hope
Vehicle Availability by Sex in Good Hope
The most prevalent vehicle ownership categories in Good Hope are males with 3 vehicles (830, accounting for 41.3%) and females with 3 vehicles (322, making up 72.6%).
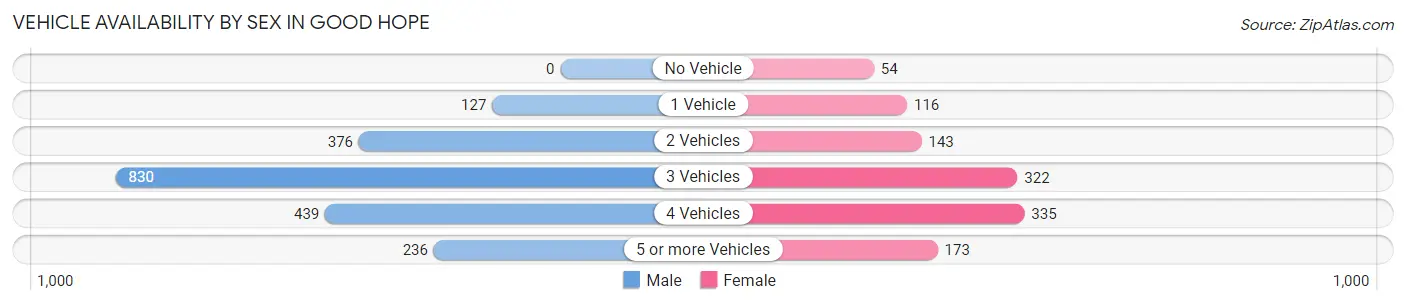
| Vehicles Available | Male | Female |
| No Vehicle | 0 (0.0%) | 54 (4.7%) |
| 1 Vehicle | 127 (6.3%) | 116 (10.2%) |
| 2 Vehicles | 376 (18.7%) | 143 (12.5%) |
| 3 Vehicles | 830 (41.3%) | 322 (28.2%) |
| 4 Vehicles | 439 (21.9%) | 335 (29.3%) |
| 5 or more Vehicles | 236 (11.7%) | 173 (15.1%) |
| Total | 2,008 (100.0%) | 1,143 (100.0%) |
Commute Time in Good Hope
The most frequently occuring commute durations in Good Hope are 30 to 34 minutes (754 commuters, 25.7%), 20 to 24 minutes (631 commuters, 21.5%), and 15 to 19 minutes (484 commuters, 16.5%).
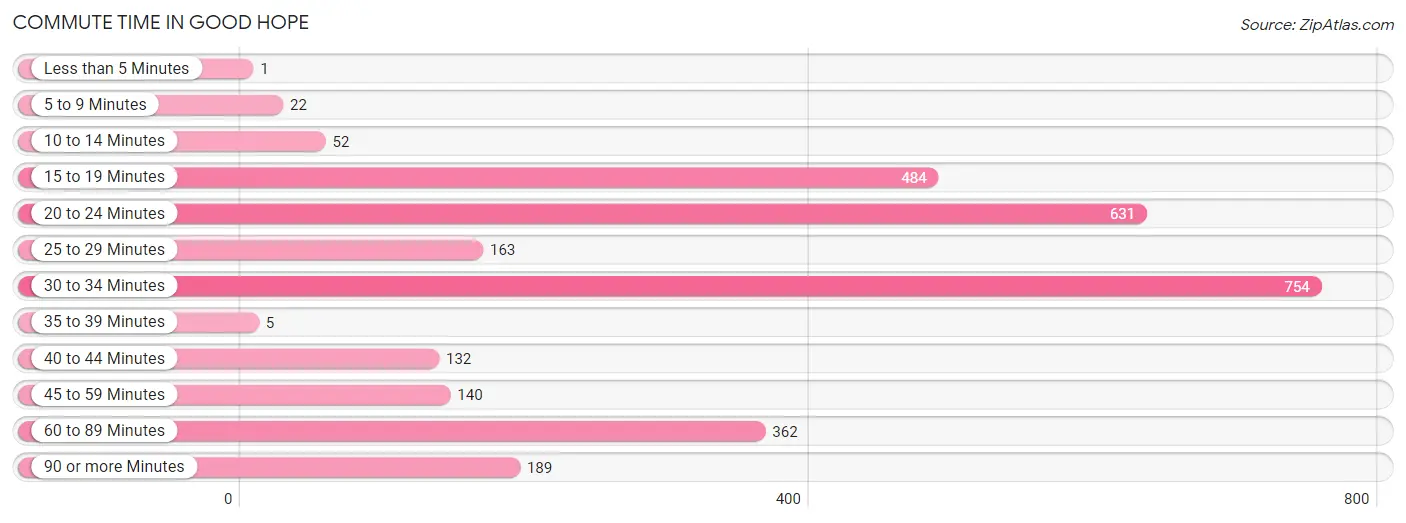
| Commute Time | # Commuters | % Commuters |
| Less than 5 Minutes | 1 | 0.0% |
| 5 to 9 Minutes | 22 | 0.7% |
| 10 to 14 Minutes | 52 | 1.8% |
| 15 to 19 Minutes | 484 | 16.5% |
| 20 to 24 Minutes | 631 | 21.5% |
| 25 to 29 Minutes | 163 | 5.6% |
| 30 to 34 Minutes | 754 | 25.7% |
| 35 to 39 Minutes | 5 | 0.2% |
| 40 to 44 Minutes | 132 | 4.5% |
| 45 to 59 Minutes | 140 | 4.8% |
| 60 to 89 Minutes | 362 | 12.3% |
| 90 or more Minutes | 189 | 6.4% |
Commute Time by Sex in Good Hope
The most common commute times in Good Hope are 30 to 34 minutes (461 commuters, 24.8%) for males and 30 to 34 minutes (293 commuters, 27.3%) for females.
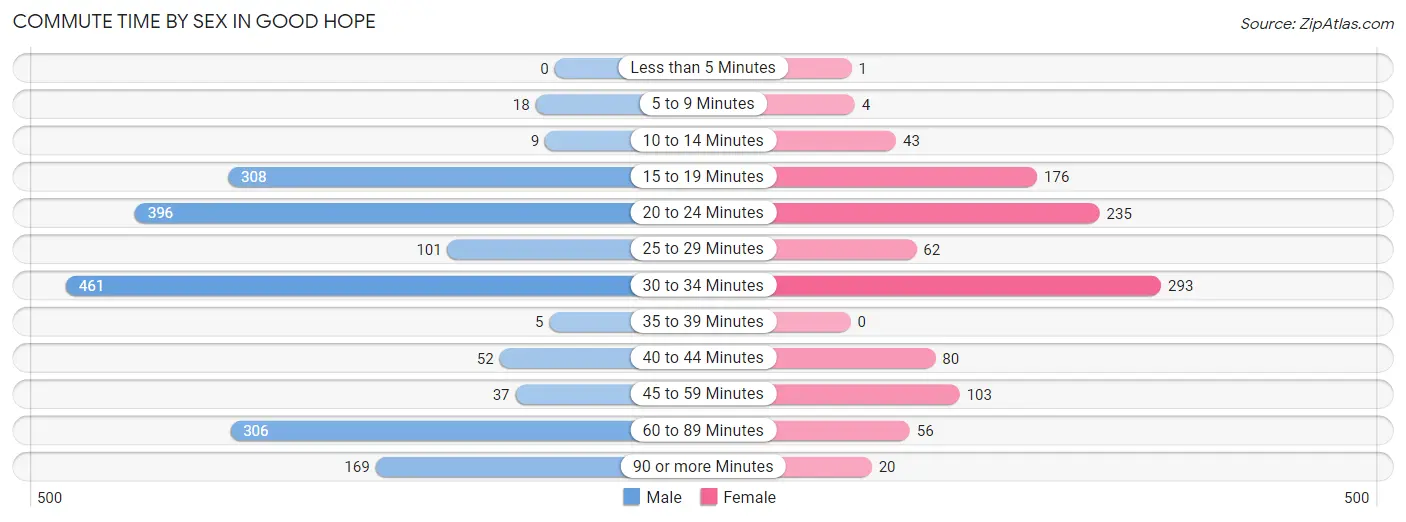
| Commute Time | Male | Female |
| Less than 5 Minutes | 0 (0.0%) | 1 (0.1%) |
| 5 to 9 Minutes | 18 (1.0%) | 4 (0.4%) |
| 10 to 14 Minutes | 9 (0.5%) | 43 (4.0%) |
| 15 to 19 Minutes | 308 (16.5%) | 176 (16.4%) |
| 20 to 24 Minutes | 396 (21.3%) | 235 (21.9%) |
| 25 to 29 Minutes | 101 (5.4%) | 62 (5.8%) |
| 30 to 34 Minutes | 461 (24.8%) | 293 (27.3%) |
| 35 to 39 Minutes | 5 (0.3%) | 0 (0.0%) |
| 40 to 44 Minutes | 52 (2.8%) | 80 (7.5%) |
| 45 to 59 Minutes | 37 (2.0%) | 103 (9.6%) |
| 60 to 89 Minutes | 306 (16.4%) | 56 (5.2%) |
| 90 or more Minutes | 169 (9.1%) | 20 (1.9%) |
Time of Departure to Work by Sex in Good Hope
The most frequent times of departure to work in Good Hope are 7:00 AM to 7:29 AM (610, 32.8%) for males and 7:00 AM to 7:29 AM (210, 19.6%) for females.
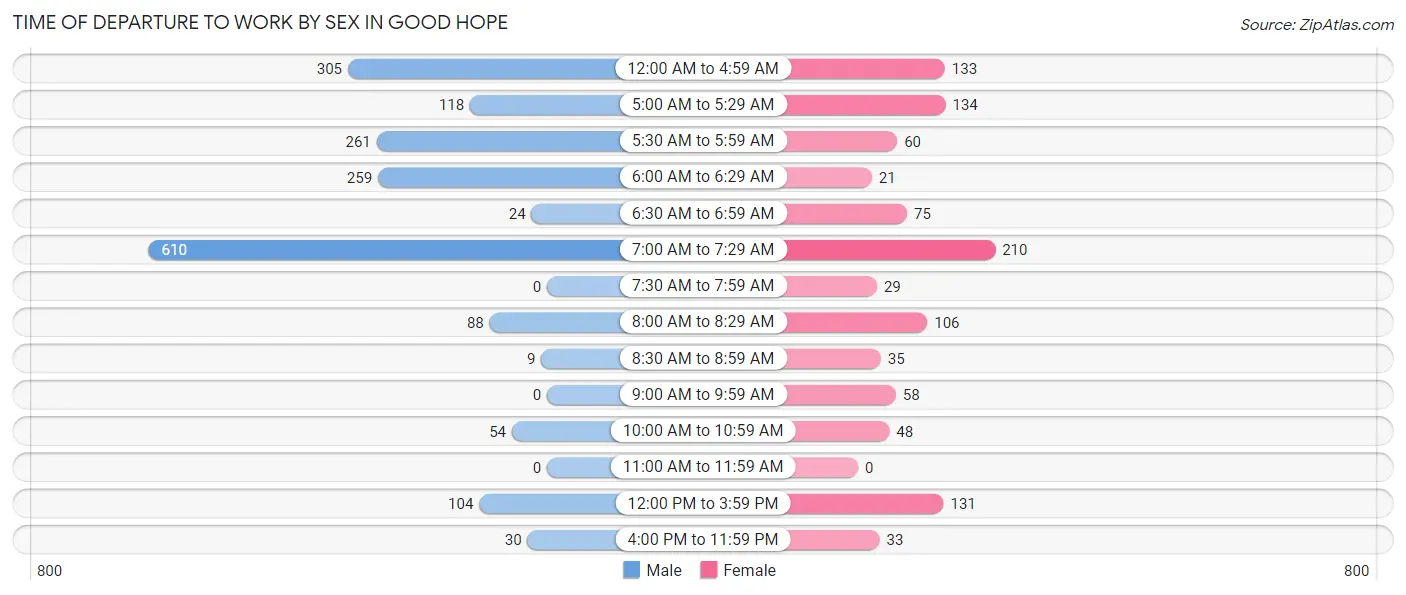
| Time of Departure | Male | Female |
| 12:00 AM to 4:59 AM | 305 (16.4%) | 133 (12.4%) |
| 5:00 AM to 5:29 AM | 118 (6.3%) | 134 (12.5%) |
| 5:30 AM to 5:59 AM | 261 (14.0%) | 60 (5.6%) |
| 6:00 AM to 6:29 AM | 259 (13.9%) | 21 (2.0%) |
| 6:30 AM to 6:59 AM | 24 (1.3%) | 75 (7.0%) |
| 7:00 AM to 7:29 AM | 610 (32.8%) | 210 (19.6%) |
| 7:30 AM to 7:59 AM | 0 (0.0%) | 29 (2.7%) |
| 8:00 AM to 8:29 AM | 88 (4.7%) | 106 (9.9%) |
| 8:30 AM to 8:59 AM | 9 (0.5%) | 35 (3.3%) |
| 9:00 AM to 9:59 AM | 0 (0.0%) | 58 (5.4%) |
| 10:00 AM to 10:59 AM | 54 (2.9%) | 48 (4.5%) |
| 11:00 AM to 11:59 AM | 0 (0.0%) | 0 (0.0%) |
| 12:00 PM to 3:59 PM | 104 (5.6%) | 131 (12.2%) |
| 4:00 PM to 11:59 PM | 30 (1.6%) | 33 (3.1%) |
| Total | 1,862 (100.0%) | 1,073 (100.0%) |
Housing Occupancy in Good Hope
Occupancy by Ownership in Good Hope
Of the total 2,002 dwellings in Good Hope, owner-occupied units account for 1,080 (53.9%), while renter-occupied units make up 922 (46.1%).
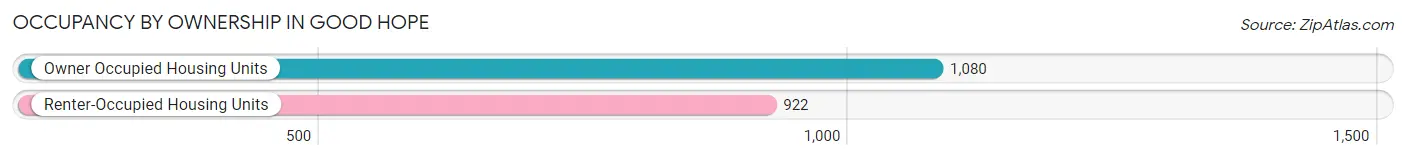
| Occupancy | # Housing Units | % Housing Units |
| Owner Occupied Housing Units | 1,080 | 53.9% |
| Renter-Occupied Housing Units | 922 | 46.1% |
| Total Occupied Housing Units | 2,002 | 100.0% |
Occupancy by Household Size in Good Hope
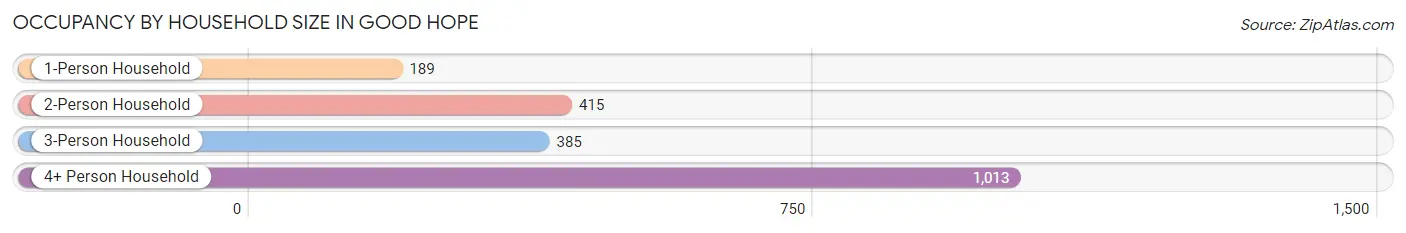
| Household Size | # Housing Units | % Housing Units |
| 1-Person Household | 189 | 9.4% |
| 2-Person Household | 415 | 20.7% |
| 3-Person Household | 385 | 19.2% |
| 4+ Person Household | 1,013 | 50.6% |
| Total Housing Units | 2,002 | 100.0% |
Occupancy by Ownership by Household Size in Good Hope
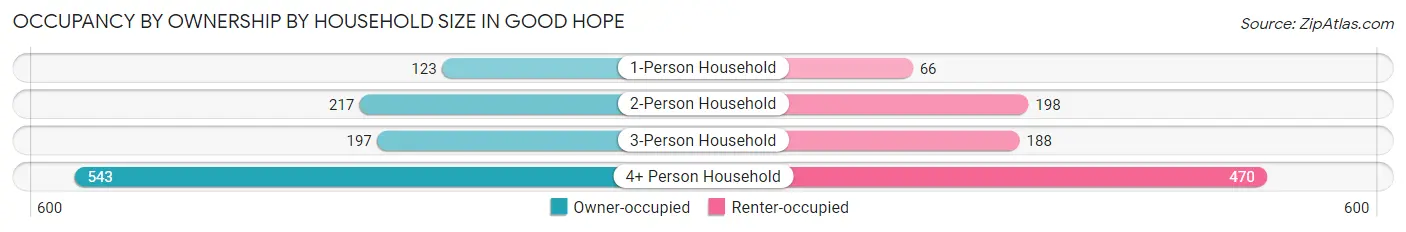
| Household Size | Owner-occupied | Renter-occupied |
| 1-Person Household | 123 (65.1%) | 66 (34.9%) |
| 2-Person Household | 217 (52.3%) | 198 (47.7%) |
| 3-Person Household | 197 (51.2%) | 188 (48.8%) |
| 4+ Person Household | 543 (53.6%) | 470 (46.4%) |
| Total Housing Units | 1,080 (53.9%) | 922 (46.1%) |
Occupancy by Educational Attainment in Good Hope
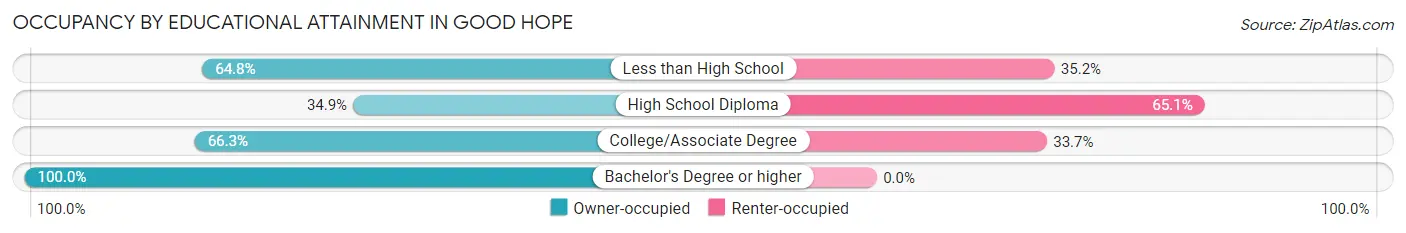
| Household Size | Owner-occupied | Renter-occupied |
| Less than High School | 419 (64.8%) | 228 (35.2%) |
| High School Diploma | 297 (34.9%) | 554 (65.1%) |
| College/Associate Degree | 275 (66.3%) | 140 (33.7%) |
| Bachelor's Degree or higher | 89 (100.0%) | 0 (0.0%) |
Occupancy by Age of Householder in Good Hope
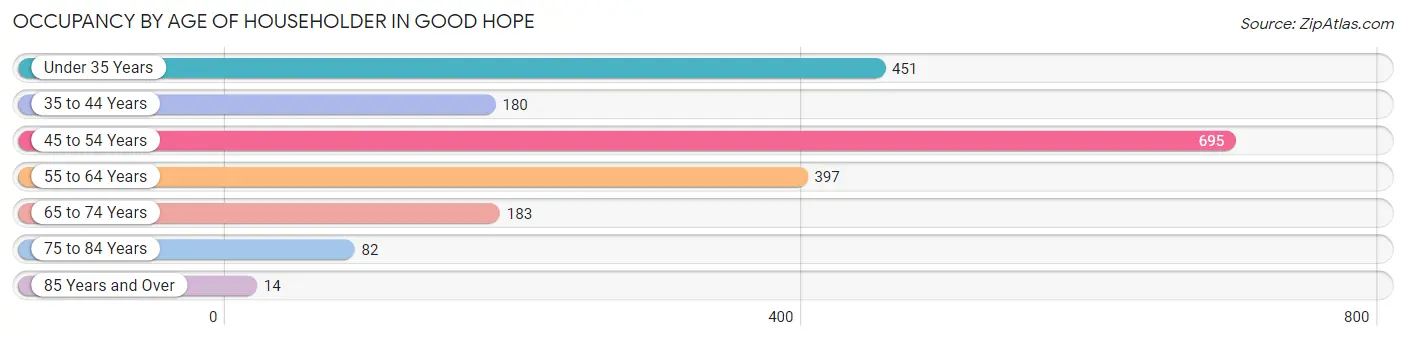
| Age Bracket | # Households | % Households |
| Under 35 Years | 451 | 22.5% |
| 35 to 44 Years | 180 | 9.0% |
| 45 to 54 Years | 695 | 34.7% |
| 55 to 64 Years | 397 | 19.8% |
| 65 to 74 Years | 183 | 9.1% |
| 75 to 84 Years | 82 | 4.1% |
| 85 Years and Over | 14 | 0.7% |
| Total | 2,002 | 100.0% |
Housing Finances in Good Hope
Median Income by Occupancy in Good Hope
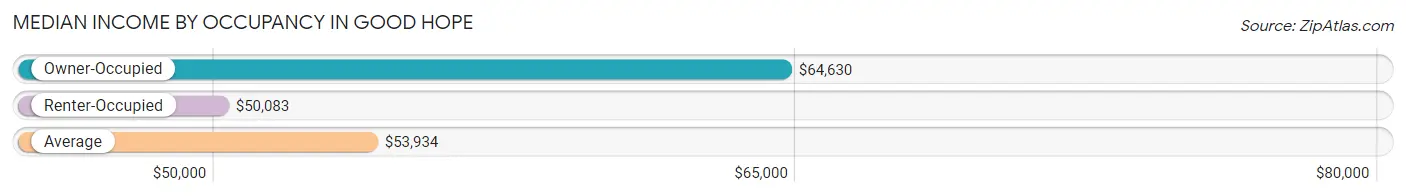
| Occupancy Type | # Households | Median Income |
| Owner-Occupied | 1,080 (53.9%) | $64,630 |
| Renter-Occupied | 922 (46.1%) | $50,083 |
| Average | 2,002 (100.0%) | $53,934 |
Occupancy by Householder Income Bracket in Good Hope
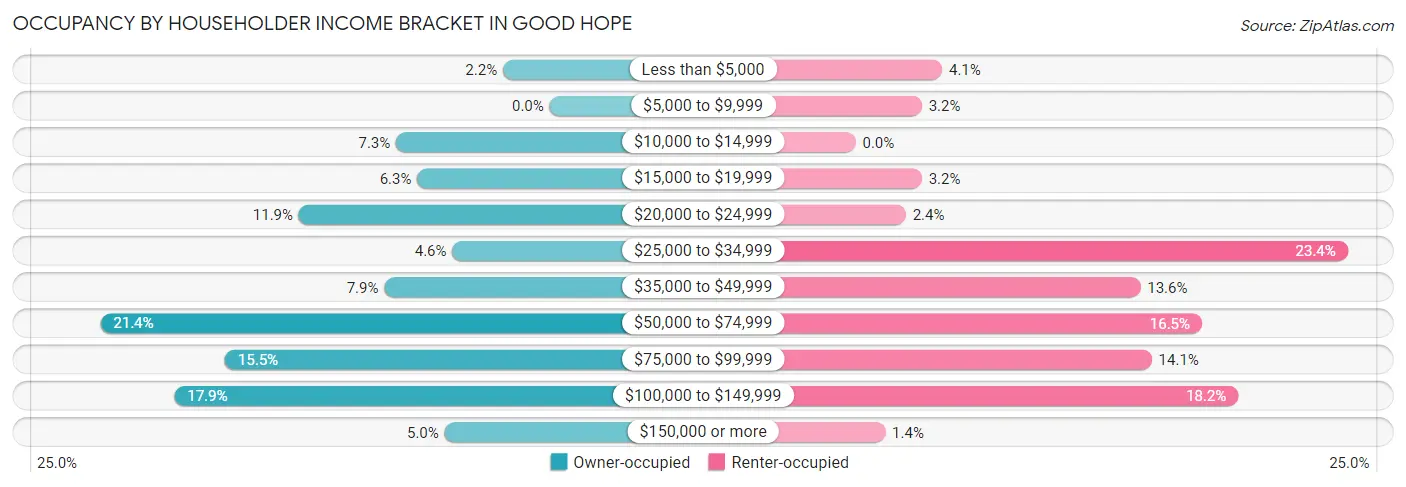
| Income Bracket | Owner-occupied | Renter-occupied |
| Less than $5,000 | 24 (2.2%) | 38 (4.1%) |
| $5,000 to $9,999 | 0 (0.0%) | 29 (3.2%) |
| $10,000 to $14,999 | 79 (7.3%) | 0 (0.0%) |
| $15,000 to $19,999 | 68 (6.3%) | 29 (3.2%) |
| $20,000 to $24,999 | 129 (11.9%) | 22 (2.4%) |
| $25,000 to $34,999 | 50 (4.6%) | 216 (23.4%) |
| $35,000 to $49,999 | 85 (7.9%) | 125 (13.6%) |
| $50,000 to $74,999 | 231 (21.4%) | 152 (16.5%) |
| $75,000 to $99,999 | 167 (15.5%) | 130 (14.1%) |
| $100,000 to $149,999 | 193 (17.9%) | 168 (18.2%) |
| $150,000 or more | 54 (5.0%) | 13 (1.4%) |
| Total | 1,080 (100.0%) | 922 (100.0%) |
Monthly Housing Cost Tiers in Good Hope
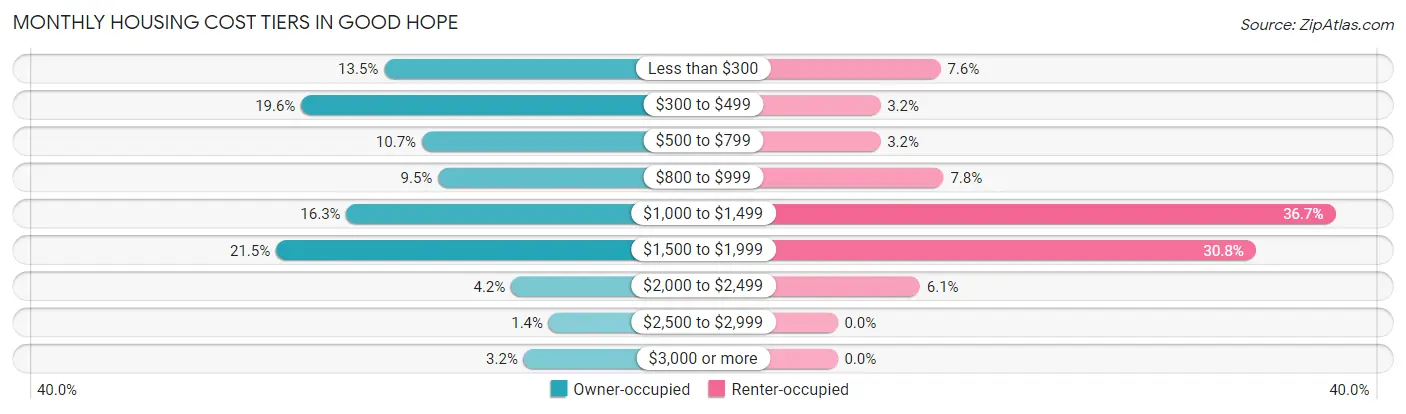
| Monthly Cost | Owner-occupied | Renter-occupied |
| Less than $300 | 146 (13.5%) | 70 (7.6%) |
| $300 to $499 | 212 (19.6%) | 29 (3.2%) |
| $500 to $799 | 116 (10.7%) | 29 (3.2%) |
| $800 to $999 | 103 (9.5%) | 72 (7.8%) |
| $1,000 to $1,499 | 176 (16.3%) | 338 (36.7%) |
| $1,500 to $1,999 | 232 (21.5%) | 284 (30.8%) |
| $2,000 to $2,499 | 45 (4.2%) | 56 (6.1%) |
| $2,500 to $2,999 | 15 (1.4%) | 0 (0.0%) |
| $3,000 or more | 35 (3.2%) | 0 (0.0%) |
| Total | 1,080 (100.0%) | 922 (100.0%) |
Physical Housing Characteristics in Good Hope
Housing Structures in Good Hope
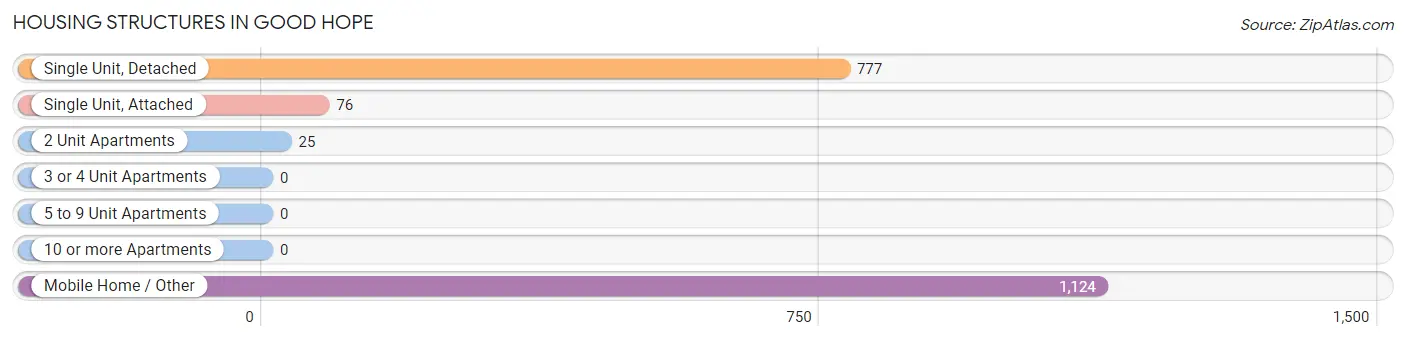
| Structure Type | # Housing Units | % Housing Units |
| Single Unit, Detached | 777 | 38.8% |
| Single Unit, Attached | 76 | 3.8% |
| 2 Unit Apartments | 25 | 1.3% |
| 3 or 4 Unit Apartments | 0 | 0.0% |
| 5 to 9 Unit Apartments | 0 | 0.0% |
| 10 or more Apartments | 0 | 0.0% |
| Mobile Home / Other | 1,124 | 56.1% |
| Total | 2,002 | 100.0% |
Housing Structures by Occupancy in Good Hope
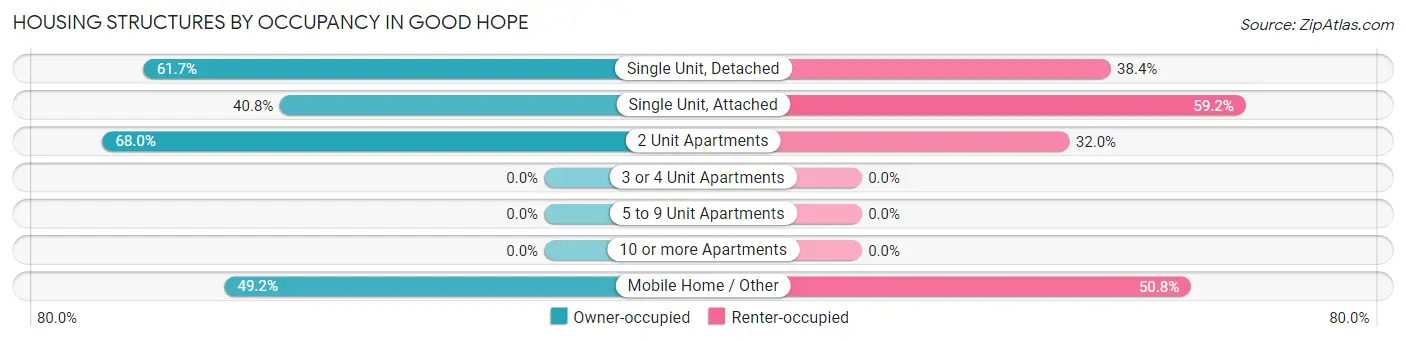
| Structure Type | Owner-occupied | Renter-occupied |
| Single Unit, Detached | 479 (61.7%) | 298 (38.4%) |
| Single Unit, Attached | 31 (40.8%) | 45 (59.2%) |
| 2 Unit Apartments | 17 (68.0%) | 8 (32.0%) |
| 3 or 4 Unit Apartments | 0 (0.0%) | 0 (0.0%) |
| 5 to 9 Unit Apartments | 0 (0.0%) | 0 (0.0%) |
| 10 or more Apartments | 0 (0.0%) | 0 (0.0%) |
| Mobile Home / Other | 553 (49.2%) | 571 (50.8%) |
| Total | 1,080 (53.9%) | 922 (46.1%) |
Housing Structures by Number of Rooms in Good Hope
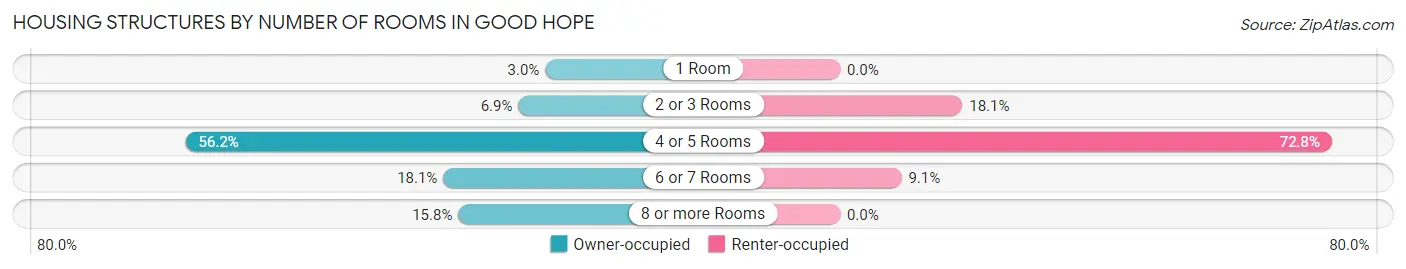
| Number of Rooms | Owner-occupied | Renter-occupied |
| 1 Room | 32 (3.0%) | 0 (0.0%) |
| 2 or 3 Rooms | 75 (6.9%) | 167 (18.1%) |
| 4 or 5 Rooms | 607 (56.2%) | 671 (72.8%) |
| 6 or 7 Rooms | 195 (18.1%) | 84 (9.1%) |
| 8 or more Rooms | 171 (15.8%) | 0 (0.0%) |
| Total | 1,080 (100.0%) | 922 (100.0%) |
Housing Structure by Heating Type in Good Hope
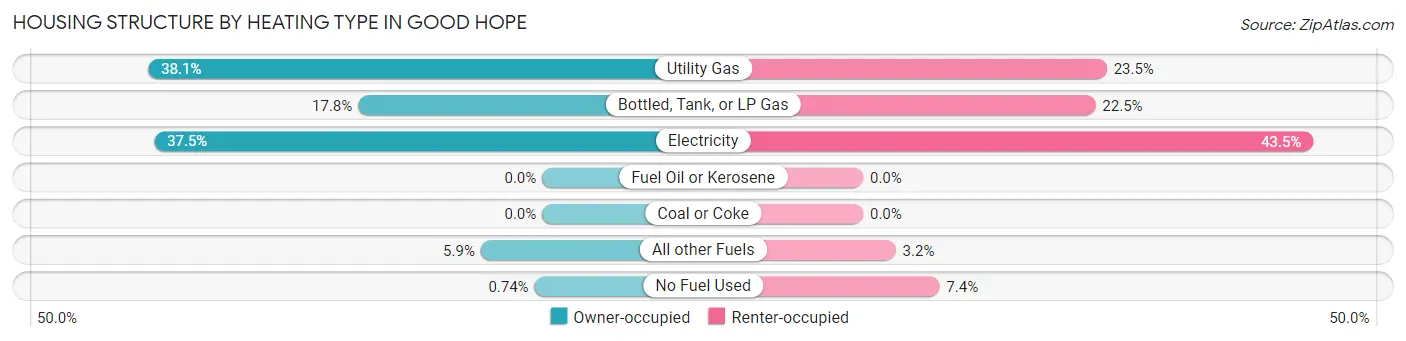
| Heating Type | Owner-occupied | Renter-occupied |
| Utility Gas | 411 (38.1%) | 217 (23.5%) |
| Bottled, Tank, or LP Gas | 192 (17.8%) | 207 (22.5%) |
| Electricity | 405 (37.5%) | 401 (43.5%) |
| Fuel Oil or Kerosene | 0 (0.0%) | 0 (0.0%) |
| Coal or Coke | 0 (0.0%) | 0 (0.0%) |
| All other Fuels | 64 (5.9%) | 29 (3.2%) |
| No Fuel Used | 8 (0.7%) | 68 (7.4%) |
| Total | 1,080 (100.0%) | 922 (100.0%) |
Household Vehicle Usage in Good Hope
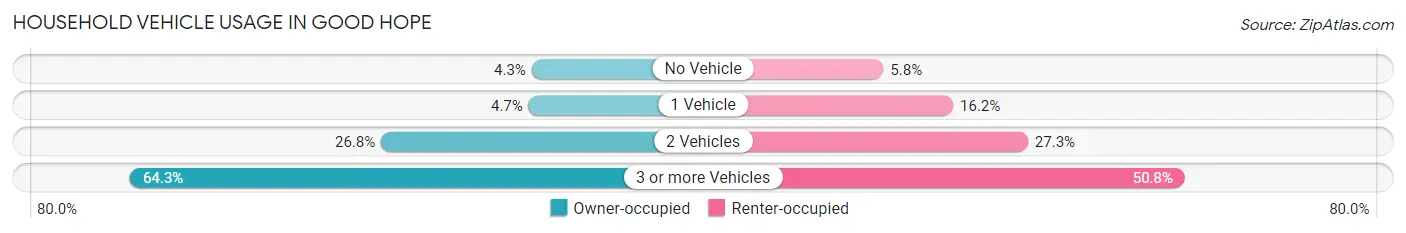
| Vehicles per Household | Owner-occupied | Renter-occupied |
| No Vehicle | 46 (4.3%) | 53 (5.8%) |
| 1 Vehicle | 51 (4.7%) | 149 (16.2%) |
| 2 Vehicles | 289 (26.8%) | 252 (27.3%) |
| 3 or more Vehicles | 694 (64.3%) | 468 (50.8%) |
| Total | 1,080 (100.0%) | 922 (100.0%) |
Real Estate & Mortgages in Good Hope
Real Estate and Mortgage Overview in Good Hope
| Characteristic | Without Mortgage | With Mortgage |
| Housing Units | 646 | 434 |
| Median Property Value | $275,900 | $302,700 |
| Median Household Income | $49,706 | $26 |
| Monthly Housing Costs | $465 | $35 |
| Real Estate Taxes | $1,288 | $0 |
Property Value by Mortgage Status in Good Hope
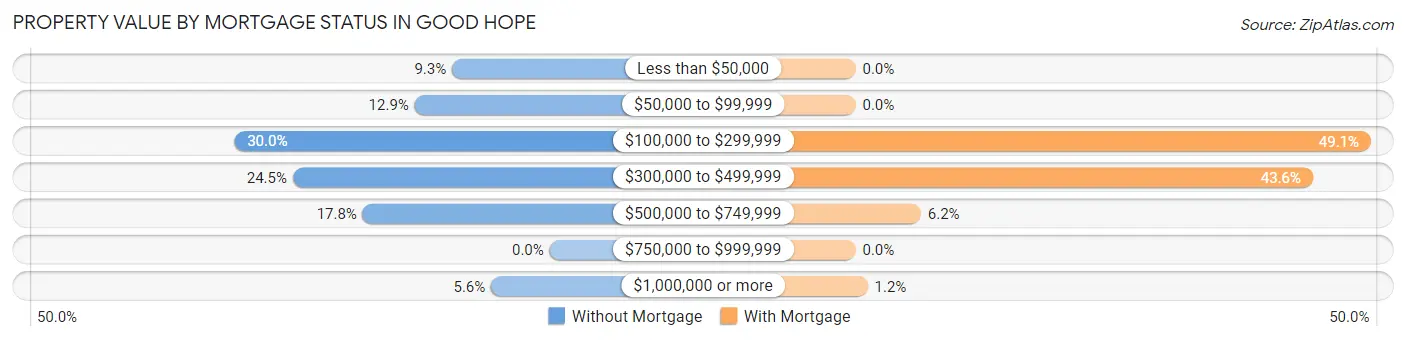
| Property Value | Without Mortgage | With Mortgage |
| Less than $50,000 | 60 (9.3%) | 0 (0.0%) |
| $50,000 to $99,999 | 83 (12.9%) | 0 (0.0%) |
| $100,000 to $299,999 | 194 (30.0%) | 213 (49.1%) |
| $300,000 to $499,999 | 158 (24.5%) | 189 (43.5%) |
| $500,000 to $749,999 | 115 (17.8%) | 27 (6.2%) |
| $750,000 to $999,999 | 0 (0.0%) | 0 (0.0%) |
| $1,000,000 or more | 36 (5.6%) | 5 (1.1%) |
| Total | 646 (100.0%) | 434 (100.0%) |
Household Income by Mortgage Status in Good Hope
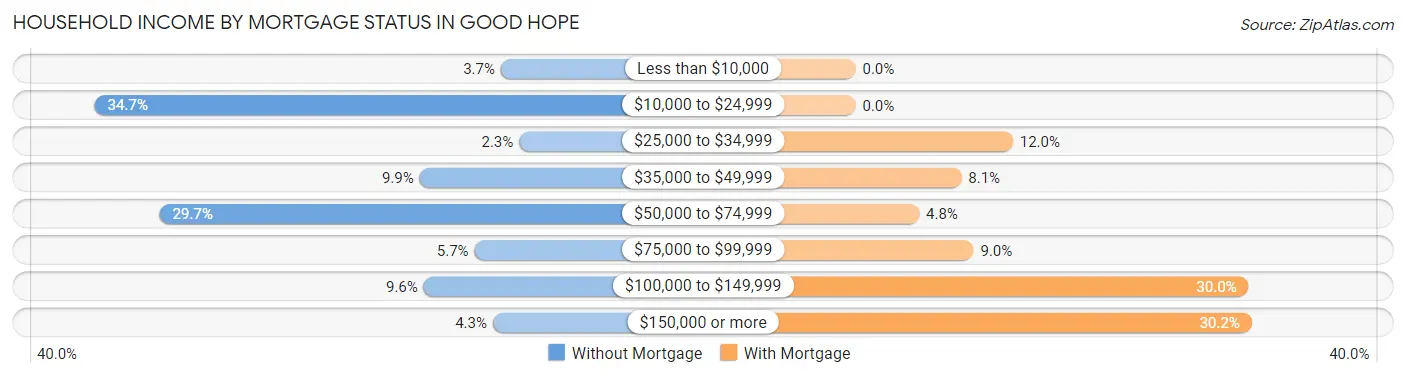
| Household Income | Without Mortgage | With Mortgage |
| Less than $10,000 | 24 (3.7%) | 0 (0.0%) |
| $10,000 to $24,999 | 224 (34.7%) | 0 (0.0%) |
| $25,000 to $34,999 | 15 (2.3%) | 52 (12.0%) |
| $35,000 to $49,999 | 64 (9.9%) | 35 (8.1%) |
| $50,000 to $74,999 | 192 (29.7%) | 21 (4.8%) |
| $75,000 to $99,999 | 37 (5.7%) | 39 (9.0%) |
| $100,000 to $149,999 | 62 (9.6%) | 130 (29.9%) |
| $150,000 or more | 28 (4.3%) | 131 (30.2%) |
| Total | 646 (100.0%) | 434 (100.0%) |
Property Value to Household Income Ratio in Good Hope
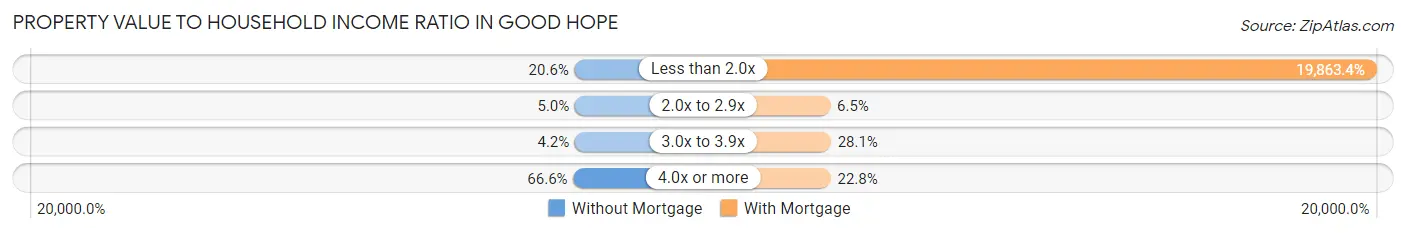
| Value-to-Income Ratio | Without Mortgage | With Mortgage |
| Less than 2.0x | 133 (20.6%) | 86,207 (19,863.4%) |
| 2.0x to 2.9x | 32 (5.0%) | 28 (6.5%) |
| 3.0x to 3.9x | 27 (4.2%) | 122 (28.1%) |
| 4.0x or more | 430 (66.6%) | 99 (22.8%) |
| Total | 646 (100.0%) | 434 (100.0%) |
Real Estate Taxes by Mortgage Status in Good Hope
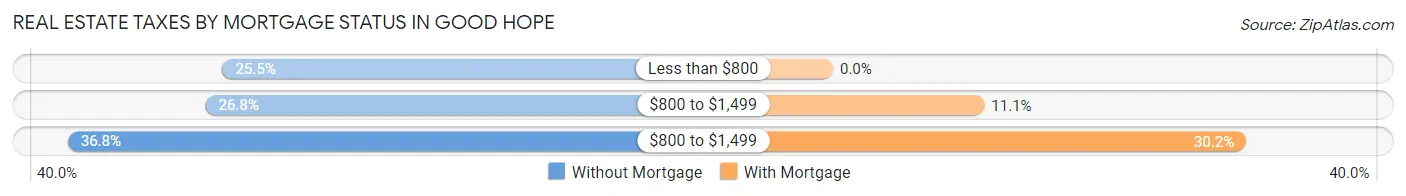
| Property Taxes | Without Mortgage | With Mortgage |
| Less than $800 | 165 (25.5%) | 0 (0.0%) |
| $800 to $1,499 | 173 (26.8%) | 48 (11.1%) |
| $800 to $1,499 | 238 (36.8%) | 131 (30.2%) |
| Total | 646 (100.0%) | 434 (100.0%) |
Health & Disability in Good Hope
Health Insurance Coverage by Age in Good Hope
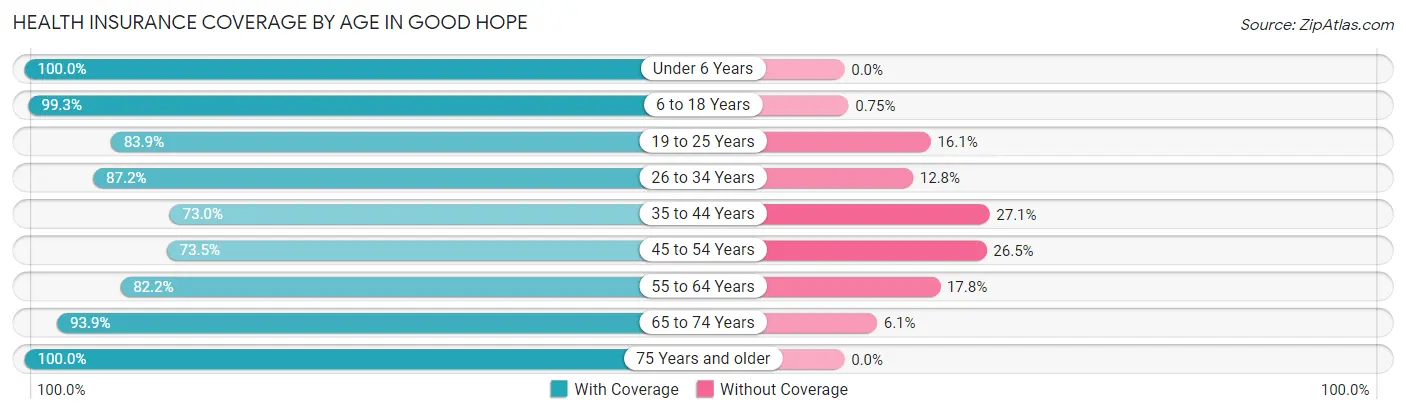
| Age Bracket | With Coverage | Without Coverage |
| Under 6 Years | 560 (100.0%) | 0 (0.0%) |
| 6 to 18 Years | 1,711 (99.3%) | 13 (0.7%) |
| 19 to 25 Years | 841 (83.9%) | 161 (16.1%) |
| 26 to 34 Years | 1,111 (87.2%) | 163 (12.8%) |
| 35 to 44 Years | 642 (73.0%) | 238 (27.1%) |
| 45 to 54 Years | 965 (73.5%) | 348 (26.5%) |
| 55 to 64 Years | 714 (82.2%) | 155 (17.8%) |
| 65 to 74 Years | 372 (93.9%) | 24 (6.1%) |
| 75 Years and older | 270 (100.0%) | 0 (0.0%) |
| Total | 7,186 (86.7%) | 1,102 (13.3%) |
Health Insurance Coverage by Citizenship Status in Good Hope
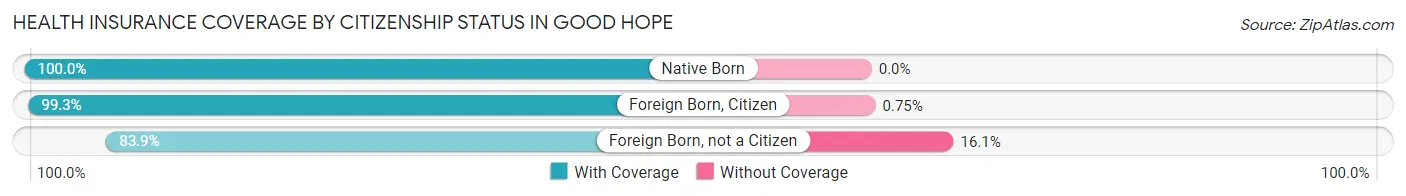
| Citizenship Status | With Coverage | Without Coverage |
| Native Born | 560 (100.0%) | 0 (0.0%) |
| Foreign Born, Citizen | 1,711 (99.3%) | 13 (0.7%) |
| Foreign Born, not a Citizen | 841 (83.9%) | 161 (16.1%) |
Health Insurance Coverage by Household Income in Good Hope
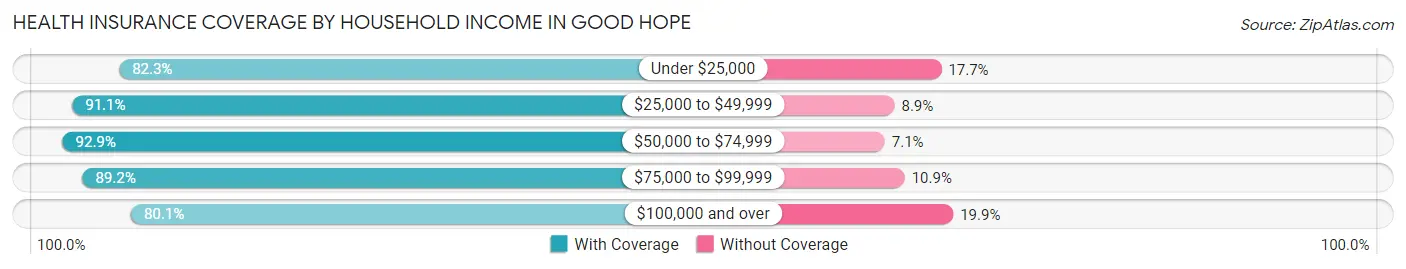
| Household Income | With Coverage | Without Coverage |
| Under $25,000 | 1,021 (82.3%) | 220 (17.7%) |
| $25,000 to $49,999 | 1,661 (91.1%) | 163 (8.9%) |
| $50,000 to $74,999 | 1,537 (92.9%) | 118 (7.1%) |
| $75,000 to $99,999 | 1,052 (89.1%) | 128 (10.8%) |
| $100,000 and over | 1,895 (80.1%) | 472 (19.9%) |
Public vs Private Health Insurance Coverage by Age in Good Hope
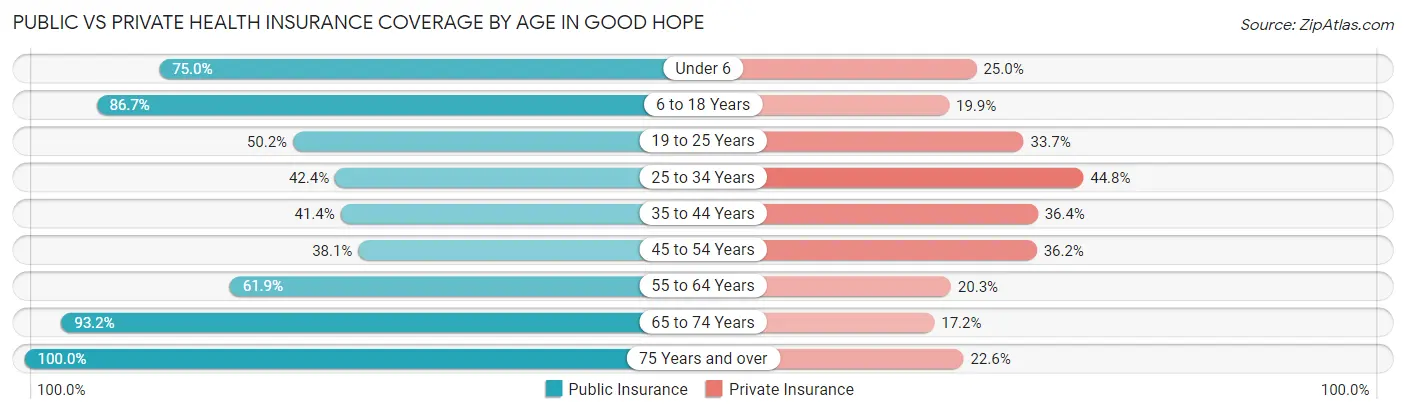
| Age Bracket | Public Insurance | Private Insurance |
| Under 6 | 420 (75.0%) | 140 (25.0%) |
| 6 to 18 Years | 1,494 (86.7%) | 343 (19.9%) |
| 19 to 25 Years | 503 (50.2%) | 338 (33.7%) |
| 25 to 34 Years | 540 (42.4%) | 571 (44.8%) |
| 35 to 44 Years | 364 (41.4%) | 320 (36.4%) |
| 45 to 54 Years | 500 (38.1%) | 475 (36.2%) |
| 55 to 64 Years | 538 (61.9%) | 176 (20.3%) |
| 65 to 74 Years | 369 (93.2%) | 68 (17.2%) |
| 75 Years and over | 270 (100.0%) | 61 (22.6%) |
| Total | 4,998 (60.3%) | 2,492 (30.1%) |
Disability Status by Sex by Age in Good Hope
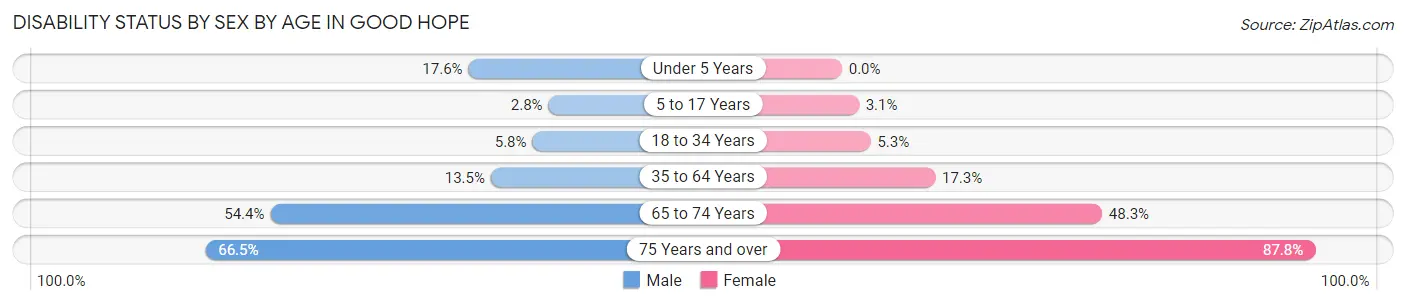
| Age Bracket | Male | Female |
| Under 5 Years | 34 (17.6%) | 0 (0.0%) |
| 5 to 17 Years | 20 (2.8%) | 28 (3.1%) |
| 18 to 34 Years | 74 (5.8%) | 60 (5.3%) |
| 35 to 64 Years | 217 (13.5%) | 251 (17.3%) |
| 65 to 74 Years | 105 (54.4%) | 98 (48.3%) |
| 75 Years and over | 103 (66.4%) | 101 (87.8%) |
Disability Class by Sex by Age in Good Hope
Disability Class: Hearing Difficulty
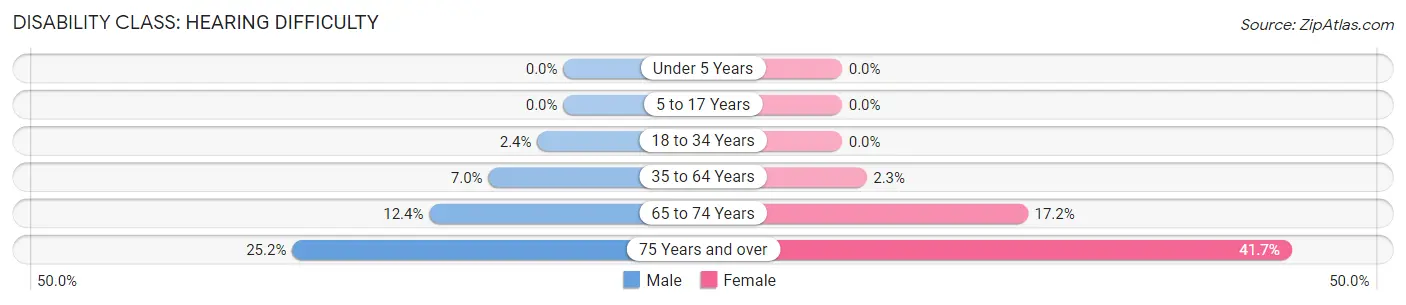
| Age Bracket | Male | Female |
| Under 5 Years | 0 (0.0%) | 0 (0.0%) |
| 5 to 17 Years | 0 (0.0%) | 0 (0.0%) |
| 18 to 34 Years | 31 (2.4%) | 0 (0.0%) |
| 35 to 64 Years | 112 (7.0%) | 33 (2.3%) |
| 65 to 74 Years | 24 (12.4%) | 35 (17.2%) |
| 75 Years and over | 39 (25.2%) | 48 (41.7%) |
Disability Class: Vision Difficulty
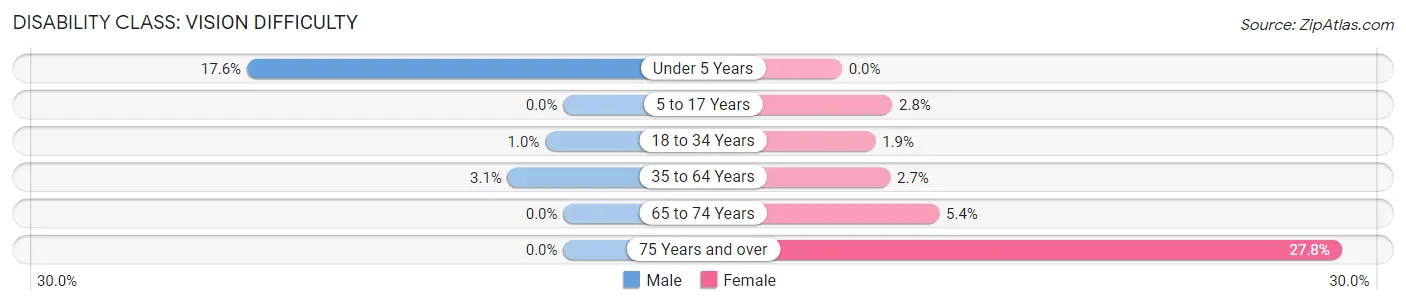
| Age Bracket | Male | Female |
| Under 5 Years | 34 (17.6%) | 0 (0.0%) |
| 5 to 17 Years | 0 (0.0%) | 25 (2.8%) |
| 18 to 34 Years | 13 (1.0%) | 21 (1.9%) |
| 35 to 64 Years | 50 (3.1%) | 39 (2.7%) |
| 65 to 74 Years | 0 (0.0%) | 11 (5.4%) |
| 75 Years and over | 0 (0.0%) | 32 (27.8%) |
Disability Class: Cognitive Difficulty
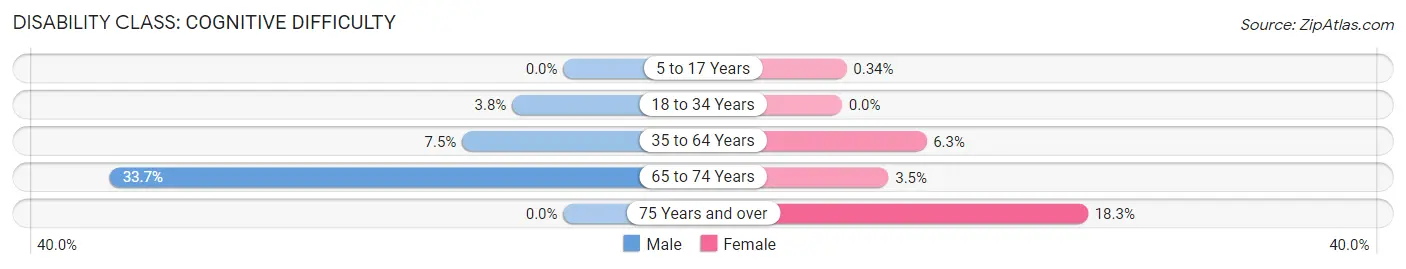
| Age Bracket | Male | Female |
| 5 to 17 Years | 0 (0.0%) | 3 (0.3%) |
| 18 to 34 Years | 49 (3.8%) | 0 (0.0%) |
| 35 to 64 Years | 121 (7.5%) | 91 (6.3%) |
| 65 to 74 Years | 65 (33.7%) | 7 (3.5%) |
| 75 Years and over | 0 (0.0%) | 21 (18.3%) |
Disability Class: Ambulatory Difficulty
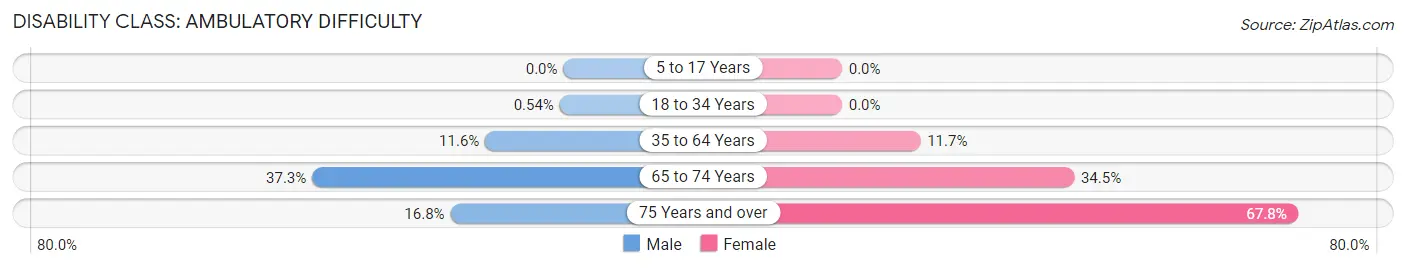
| Age Bracket | Male | Female |
| 5 to 17 Years | 0 (0.0%) | 0 (0.0%) |
| 18 to 34 Years | 7 (0.5%) | 0 (0.0%) |
| 35 to 64 Years | 187 (11.6%) | 169 (11.7%) |
| 65 to 74 Years | 72 (37.3%) | 70 (34.5%) |
| 75 Years and over | 26 (16.8%) | 78 (67.8%) |
Disability Class: Self-Care Difficulty
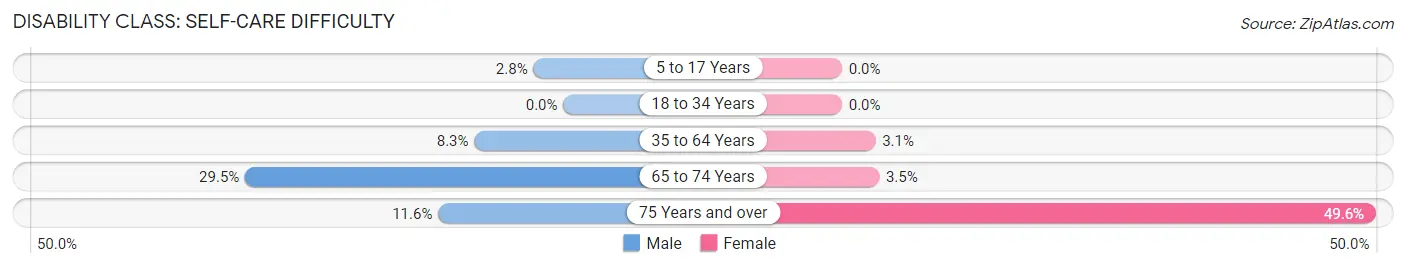
| Age Bracket | Male | Female |
| 5 to 17 Years | 20 (2.8%) | 0 (0.0%) |
| 18 to 34 Years | 0 (0.0%) | 0 (0.0%) |
| 35 to 64 Years | 133 (8.3%) | 45 (3.1%) |
| 65 to 74 Years | 57 (29.5%) | 7 (3.5%) |
| 75 Years and over | 18 (11.6%) | 57 (49.6%) |
Technology Access in Good Hope
Computing Device Access in Good Hope
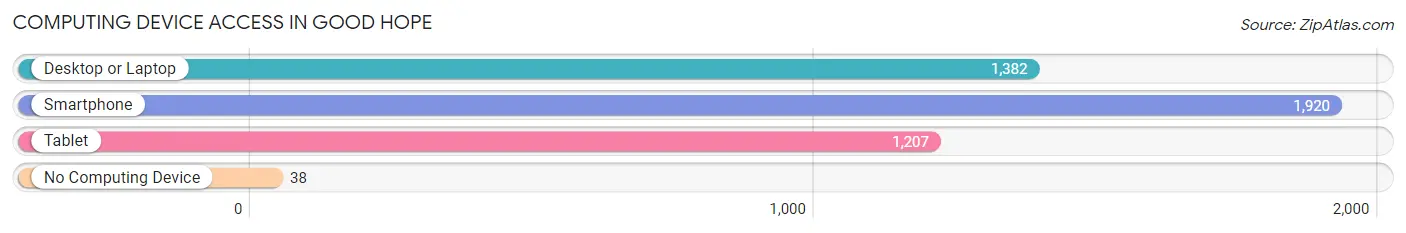
| Device Type | # Households | % Households |
| Desktop or Laptop | 1,382 | 69.0% |
| Smartphone | 1,920 | 95.9% |
| Tablet | 1,207 | 60.3% |
| No Computing Device | 38 | 1.9% |
| Total | 2,002 | 100.0% |
Internet Access in Good Hope
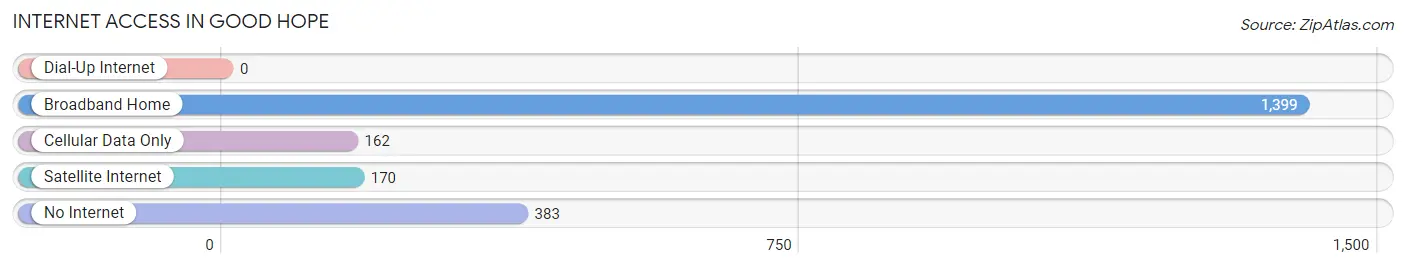
| Internet Type | # Households | % Households |
| Dial-Up Internet | 0 | 0.0% |
| Broadband Home | 1,399 | 69.9% |
| Cellular Data Only | 162 | 8.1% |
| Satellite Internet | 170 | 8.5% |
| No Internet | 383 | 19.1% |
| Total | 2,002 | 100.0% |
Good Hope Summary
Good Hope is a small unincorporated community located in the Coachella Valley of Riverside County, California. It is situated in the foothills of the Santa Rosa Mountains, approximately 10 miles east of the city of Coachella. The population of Good Hope was estimated to be 1,845 in 2019.
History
Good Hope was founded in the late 19th century by a group of settlers from the Midwest. The settlers were attracted to the area by the abundance of water and the fertile soil. The first settlers built a small community and named it Good Hope.
The community grew slowly over the years, and by the early 20th century, it had become a thriving agricultural center. The main crops grown in the area were cotton, alfalfa, and citrus. The town also had a small general store, a post office, and a school.
In the 1950s, the area began to experience rapid growth due to the influx of people from the Midwest and other parts of the country. This growth was fueled by the development of the nearby Coachella Valley, which was becoming a popular destination for retirees and vacationers.
Geography
Good Hope is located in the Coachella Valley of Riverside County, California. It is situated in the foothills of the Santa Rosa Mountains, approximately 10 miles east of the city of Coachella. The area is characterized by a semi-arid climate, with hot summers and mild winters.
The terrain of Good Hope is mostly flat, with some rolling hills. The area is home to a variety of wildlife, including coyotes, bobcats, and mountain lions.
Economy
Good Hope’s economy is largely based on agriculture. The main crops grown in the area are cotton, alfalfa, and citrus. The area is also home to a variety of small businesses, including restaurants, convenience stores, and auto repair shops.
The area is also home to a number of tourist attractions, including the nearby Coachella Valley Preserve and the Santa Rosa and San Jacinto Mountains National Monument.
Demographics
As of 2019, the population of Good Hope was estimated to be 1,845. The racial makeup of the town was 79.3% White, 0.7% African American, 0.3% Native American, 0.2% Asian, 0.1% Pacific Islander, 16.2% from other races, and 3.4% from two or more races. Hispanic or Latino of any race were 33.2% of the population.
The median household income in Good Hope was $37,917, and the median family income was $41,250. The per capita income was $17,845. About 17.2% of families and 20.3% of the population were below the poverty line, including 28.3% of those under age 18 and 8.2% of those age 65 or over.
Good Hope is served by the Coachella Valley Unified School District. The town is home to two elementary schools, one middle school, and one high school.
Common Questions
What is Per Capita Income in Good Hope?
Per Capita income in Good Hope is $17,661.
What is the Median Family Income in Good Hope?
Median Family Income in Good Hope is $59,250.
What is the Median Household income in Good Hope?
Median Household Income in Good Hope is $53,934.
What is Income or Wage Gap in Good Hope?
Income or Wage Gap in Good Hope is 9.9%.
Women in Good Hope earn 90.1 cents for every dollar earned by a man.
What is Family Income Deficit in Good Hope?
Family Income Deficit in Good Hope is $11,936.
Families that are below poverty line in Good Hope earn $11,936 less on average than the poverty threshold level.
What is Inequality or Gini Index in Good Hope?
Inequality or Gini Index in Good Hope is 0.38.
What is the Total Population of Good Hope?
Total Population of Good Hope is 8,291.
What is the Total Male Population of Good Hope?
Total Male Population of Good Hope is 4,165.
What is the Total Female Population of Good Hope?
Total Female Population of Good Hope is 4,126.
What is the Ratio of Males per 100 Females in Good Hope?
There are 100.95 Males per 100 Females in Good Hope.
What is the Ratio of Females per 100 Males in Good Hope?
There are 99.06 Females per 100 Males in Good Hope.
What is the Median Population Age in Good Hope?
Median Population Age in Good Hope is 31.3 Years.
What is the Average Family Size in Good Hope
Average Family Size in Good Hope is 4.4 People.
What is the Average Household Size in Good Hope
Average Household Size in Good Hope is 4.1 People.
How Large is the Labor Force in Good Hope?
There are 3,717 People in the Labor Forcein in Good Hope.
What is the Percentage of People in the Labor Force in Good Hope?
57.9% of People are in the Labor Force in Good Hope.
What is the Unemployment Rate in Good Hope?
Unemployment Rate in Good Hope is 12.4%.