Cities with the Highest Percentage of Population Employed in Construction & Extraction in South Dakota
RELATED REPORTS & OPTIONS
Construction & Extraction
South Dakota
Compare Cities
Map of Cities with the Highest Percentage of Population Employed in Construction & Extraction in South Dakota
0.0%
100.0%
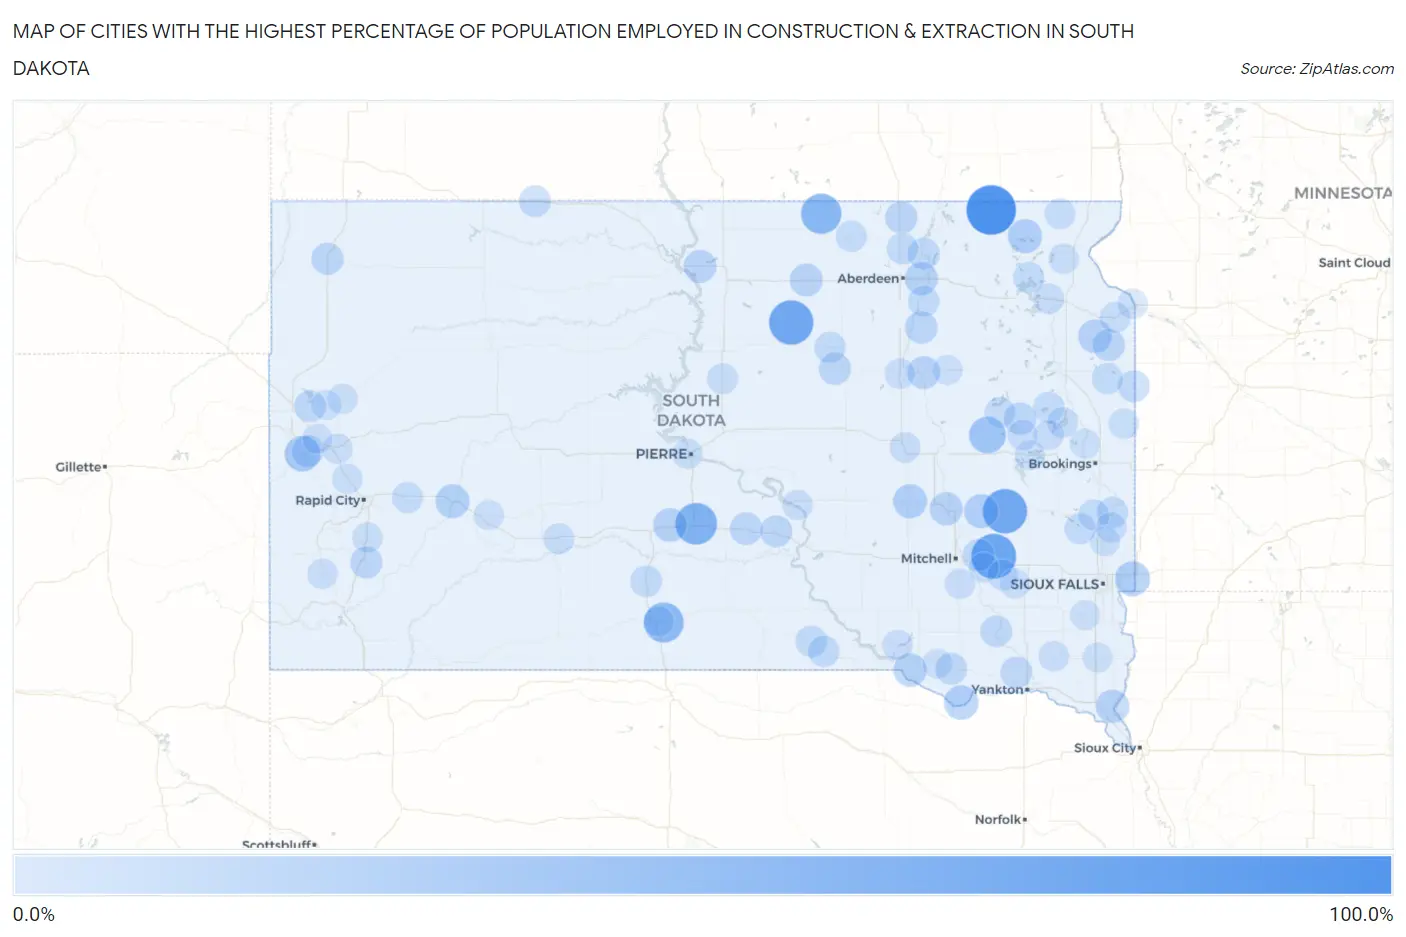
Cities with the Highest Percentage of Population Employed in Construction & Extraction in South Dakota
| City | % Employed | vs State | vs National | |
| 1. | Kidder | 100.0% | 5.1% (+94.9)#1 | 5.0% (+95.0)#32 |
| 2. | Farmer | 77.8% | 5.1% (+72.7)#2 | 5.0% (+72.8)#53 |
| 3. | Onaka | 75.0% | 5.1% (+69.9)#3 | 5.0% (+70.0)#57 |
| 4. | Vilas | 75.0% | 5.1% (+69.9)#4 | 5.0% (+70.0)#58 |
| 5. | Vivian | 62.1% | 5.1% (+56.9)#5 | 5.0% (+57.1)#87 |
| 6. | Long Lake | 55.6% | 5.1% (+50.4)#6 | 5.0% (+50.6)#124 |
| 7. | White Horse | 53.8% | 5.1% (+48.7)#7 | 5.0% (+48.9)#134 |
| 8. | Bancroft | 38.9% | 5.1% (+33.8)#8 | 5.0% (+33.9)#299 |
| 9. | Central City | 33.3% | 5.1% (+28.2)#9 | 5.0% (+28.3)#417 |
| 10. | Valley Springs | 30.0% | 5.1% (+24.9)#10 | 5.0% (+25.0)#546 |
| 11. | Wonderland Homes | 29.6% | 5.1% (+24.4)#11 | 5.0% (+24.6)#563 |
| 12. | Running Water | 28.0% | 5.1% (+22.9)#12 | 5.0% (+23.0)#643 |
| 13. | Lake City | 27.3% | 5.1% (+22.1)#13 | 5.0% (+22.3)#692 |
| 14. | Fedora | 27.3% | 5.1% (+22.1)#14 | 5.0% (+22.3)#694 |
| 15. | Lane | 26.7% | 5.1% (+21.5)#15 | 5.0% (+21.7)#740 |
| 16. | Wasta | 25.8% | 5.1% (+20.7)#16 | 5.0% (+20.8)#781 |
| 17. | Draper | 25.0% | 5.1% (+19.9)#17 | 5.0% (+20.0)#851 |
| 18. | Stockholm | 24.3% | 5.1% (+19.2)#18 | 5.0% (+19.3)#892 |
| 19. | Marty | 24.1% | 5.1% (+19.0)#19 | 5.0% (+19.1)#905 |
| 20. | Richland | 22.9% | 5.1% (+17.8)#20 | 5.0% (+17.9)#1,026 |
| 21. | Bath Corner | 22.2% | 5.1% (+17.1)#21 | 5.0% (+17.2)#1,107 |
| 22. | Forestburg | 22.2% | 5.1% (+17.1)#22 | 5.0% (+17.2)#1,110 |
| 23. | Roscoe | 21.8% | 5.1% (+16.7)#23 | 5.0% (+16.9)#1,147 |
| 24. | Frankfort | 21.1% | 5.1% (+15.9)#24 | 5.0% (+16.1)#1,232 |
| 25. | Glenham | 20.9% | 5.1% (+15.8)#25 | 5.0% (+15.9)#1,256 |
| 26. | Bryant | 19.8% | 5.1% (+14.6)#26 | 5.0% (+14.8)#1,404 |
| 27. | Kennebec | 19.6% | 5.1% (+14.5)#27 | 5.0% (+14.6)#1,433 |
| 28. | Brentford | 19.5% | 5.1% (+14.4)#28 | 5.0% (+14.5)#1,449 |
| 29. | La Bolt | 19.0% | 5.1% (+13.9)#29 | 5.0% (+14.1)#1,528 |
| 30. | Frederick | 18.9% | 5.1% (+13.7)#30 | 5.0% (+13.9)#1,554 |
| 31. | Orient | 18.2% | 5.1% (+13.1)#31 | 5.0% (+13.2)#1,698 |
| 32. | Buffalo | 18.1% | 5.1% (+13.0)#32 | 5.0% (+13.1)#1,708 |
| 33. | Reliance | 17.9% | 5.1% (+12.8)#33 | 5.0% (+13.0)#1,753 |
| 34. | Fairburn | 17.6% | 5.1% (+12.5)#34 | 5.0% (+12.7)#1,820 |
| 35. | Columbia | 17.5% | 5.1% (+12.4)#35 | 5.0% (+12.5)#1,834 |
| 36. | Fulton | 17.5% | 5.1% (+12.4)#36 | 5.0% (+12.5)#1,841 |
| 37. | Avon | 17.2% | 5.1% (+12.1)#37 | 5.0% (+12.2)#1,905 |
| 38. | Olivet | 17.1% | 5.1% (+12.0)#38 | 5.0% (+12.1)#1,928 |
| 39. | Fruitdale | 17.1% | 5.1% (+11.9)#39 | 5.0% (+12.1)#1,947 |
| 40. | Deadwood | 17.0% | 5.1% (+11.9)#40 | 5.0% (+12.0)#1,957 |
| 41. | Angostura | 16.7% | 5.1% (+11.5)#41 | 5.0% (+11.7)#2,053 |
| 42. | Morristown | 16.2% | 5.1% (+11.1)#42 | 5.0% (+11.2)#2,180 |
| 43. | Gary | 16.1% | 5.1% (+11.0)#43 | 5.0% (+11.1)#2,196 |
| 44. | Utica | 16.1% | 5.1% (+11.0)#44 | 5.0% (+11.1)#2,203 |
| 45. | White River | 15.8% | 5.1% (+10.6)#45 | 5.0% (+10.8)#2,318 |
| 46. | Faulkton | 15.2% | 5.1% (+10.0)#46 | 5.0% (+10.2)#2,495 |
| 47. | Burke | 15.1% | 5.1% (+10.0)#47 | 5.0% (+10.1)#2,507 |
| 48. | Egan | 14.9% | 5.1% (+9.73)#48 | 5.0% (+9.86)#2,601 |
| 49. | Herrick | 14.8% | 5.1% (+9.69)#49 | 5.0% (+9.82)#2,627 |
| 50. | Westport | 14.7% | 5.1% (+9.58)#50 | 5.0% (+9.71)#2,669 |
| 51. | Hayti | 14.3% | 5.1% (+9.16)#51 | 5.0% (+9.29)#2,799 |
| 52. | Chester | 14.3% | 5.1% (+9.16)#52 | 5.0% (+9.29)#2,807 |
| 53. | Altamont | 14.3% | 5.1% (+9.16)#53 | 5.0% (+9.29)#2,827 |
| 54. | Colman | 14.0% | 5.1% (+8.88)#54 | 5.0% (+9.01)#2,921 |
| 55. | Grenville | 14.0% | 5.1% (+8.83)#55 | 5.0% (+8.96)#2,943 |
| 56. | Stratford | 13.5% | 5.1% (+8.39)#56 | 5.0% (+8.52)#3,140 |
| 57. | Leola | 13.4% | 5.1% (+8.31)#57 | 5.0% (+8.44)#3,176 |
| 58. | New Underwood | 13.2% | 5.1% (+8.08)#58 | 5.0% (+8.21)#3,277 |
| 59. | Millerdale Colony | 12.5% | 5.1% (+7.38)#59 | 5.0% (+7.51)#3,643 |
| 60. | Kadoka | 12.3% | 5.1% (+7.21)#60 | 5.0% (+7.33)#3,734 |
| 61. | Milbank | 12.3% | 5.1% (+7.20)#61 | 5.0% (+7.33)#3,738 |
| 62. | Willow Lake | 12.3% | 5.1% (+7.16)#62 | 5.0% (+7.29)#3,765 |
| 63. | Emery | 12.0% | 5.1% (+6.88)#63 | 5.0% (+7.01)#3,915 |
| 64. | Lake Poinsett | 11.9% | 5.1% (+6.81)#64 | 5.0% (+6.94)#3,968 |
| 65. | Claire City | 11.8% | 5.1% (+6.64)#65 | 5.0% (+6.77)#4,095 |
| 66. | Ortley | 11.8% | 5.1% (+6.64)#66 | 5.0% (+6.77)#4,101 |
| 67. | Wolsey | 11.7% | 5.1% (+6.62)#67 | 5.0% (+6.75)#4,112 |
| 68. | Agar | 11.5% | 5.1% (+6.42)#68 | 5.0% (+6.54)#4,247 |
| 69. | Glendale Colony | 11.3% | 5.1% (+6.13)#69 | 5.0% (+6.26)#4,459 |
| 70. | Irene | 11.2% | 5.1% (+6.07)#70 | 5.0% (+6.20)#4,491 |
| 71. | Hermosa | 11.2% | 5.1% (+6.05)#71 | 5.0% (+6.18)#4,519 |
| 72. | Mountain Plains | 11.1% | 5.1% (+5.96)#72 | 5.0% (+6.08)#4,618 |
| 73. | Redfield | 10.9% | 5.1% (+5.78)#73 | 5.0% (+5.91)#4,739 |
| 74. | Trent | 10.8% | 5.1% (+5.72)#74 | 5.0% (+5.85)#4,786 |
| 75. | Sturgis | 10.8% | 5.1% (+5.69)#75 | 5.0% (+5.82)#4,805 |
| 76. | Antelope | 10.7% | 5.1% (+5.59)#76 | 5.0% (+5.72)#4,889 |
| 77. | Pringle | 10.5% | 5.1% (+5.36)#77 | 5.0% (+5.49)#5,090 |
| 78. | Ethan | 10.4% | 5.1% (+5.24)#78 | 5.0% (+5.37)#5,189 |
| 79. | Badger | 10.3% | 5.1% (+5.13)#79 | 5.0% (+5.26)#5,307 |
| 80. | Fort Pierre | 10.1% | 5.1% (+5.02)#80 | 5.0% (+5.15)#5,397 |
| 81. | Fort Thompson | 10.1% | 5.1% (+4.97)#81 | 5.0% (+5.09)#5,452 |
| 82. | Agency Village | 10.0% | 5.1% (+4.90)#82 | 5.0% (+5.03)#5,515 |
| 83. | Piedmont | 10.0% | 5.1% (+4.89)#83 | 5.0% (+5.02)#5,519 |
| 84. | Lake Andes | 10.0% | 5.1% (+4.88)#84 | 5.0% (+5.01)#5,527 |
| 85. | Astoria | 10.0% | 5.1% (+4.88)#85 | 5.0% (+5.01)#5,557 |
| 86. | Erwin | 10.0% | 5.1% (+4.88)#86 | 5.0% (+5.01)#5,578 |
| 87. | Newell | 9.9% | 5.1% (+4.77)#87 | 5.0% (+4.90)#5,669 |
| 88. | Lake Preston | 9.9% | 5.1% (+4.76)#88 | 5.0% (+4.89)#5,680 |
| 89. | Big Stone City | 9.7% | 5.1% (+4.62)#89 | 5.0% (+4.75)#5,818 |
| 90. | Bridgewater | 9.7% | 5.1% (+4.55)#90 | 5.0% (+4.68)#5,875 |
| 91. | Quinn | 9.7% | 5.1% (+4.55)#91 | 5.0% (+4.68)#5,884 |
| 92. | Nisland | 9.5% | 5.1% (+4.40)#92 | 5.0% (+4.53)#6,046 |
| 93. | Bruce | 9.4% | 5.1% (+4.33)#93 | 5.0% (+4.45)#6,125 |
| 94. | Dell Rapids | 9.4% | 5.1% (+4.25)#94 | 5.0% (+4.37)#6,203 |
| 95. | Beresford | 9.4% | 5.1% (+4.24)#95 | 5.0% (+4.37)#6,204 |
| 96. | Whitewood | 9.3% | 5.1% (+4.21)#96 | 5.0% (+4.34)#6,243 |
| 97. | Doland | 9.3% | 5.1% (+4.21)#97 | 5.0% (+4.34)#6,245 |
| 98. | Alexandria | 9.3% | 5.1% (+4.16)#98 | 5.0% (+4.29)#6,308 |
| 99. | Lennox | 9.3% | 5.1% (+4.16)#99 | 5.0% (+4.29)#6,312 |
| 100. | Dante | 9.2% | 5.1% (+4.11)#100 | 5.0% (+4.24)#6,369 |
Common Questions
What are the Top 10 Cities with the Highest Percentage of Population Employed in Construction & Extraction in South Dakota?
Top 10 Cities with the Highest Percentage of Population Employed in Construction & Extraction in South Dakota are:
#1
100.0%
#2
77.8%
#3
75.0%
#4
75.0%
#5
62.1%
#6
55.6%
#7
53.8%
#8
38.9%
#9
33.3%
#10
30.0%
What city has the Highest Percentage of Population Employed in Construction & Extraction in South Dakota?
Kidder has the Highest Percentage of Population Employed in Construction & Extraction in South Dakota with 100.0%.
What is the Percentage of Population Employed in Construction & Extraction in the State of South Dakota?
Percentage of Population Employed in Construction & Extraction in South Dakota is 5.1%.
What is the Percentage of Population Employed in Construction & Extraction in the United States?
Percentage of Population Employed in Construction & Extraction in the United States is 5.0%.