Cities with the Highest Percentage of Population Employed in Construction & Extraction in Delaware
RELATED REPORTS & OPTIONS
Construction & Extraction
Delaware
Compare Cities
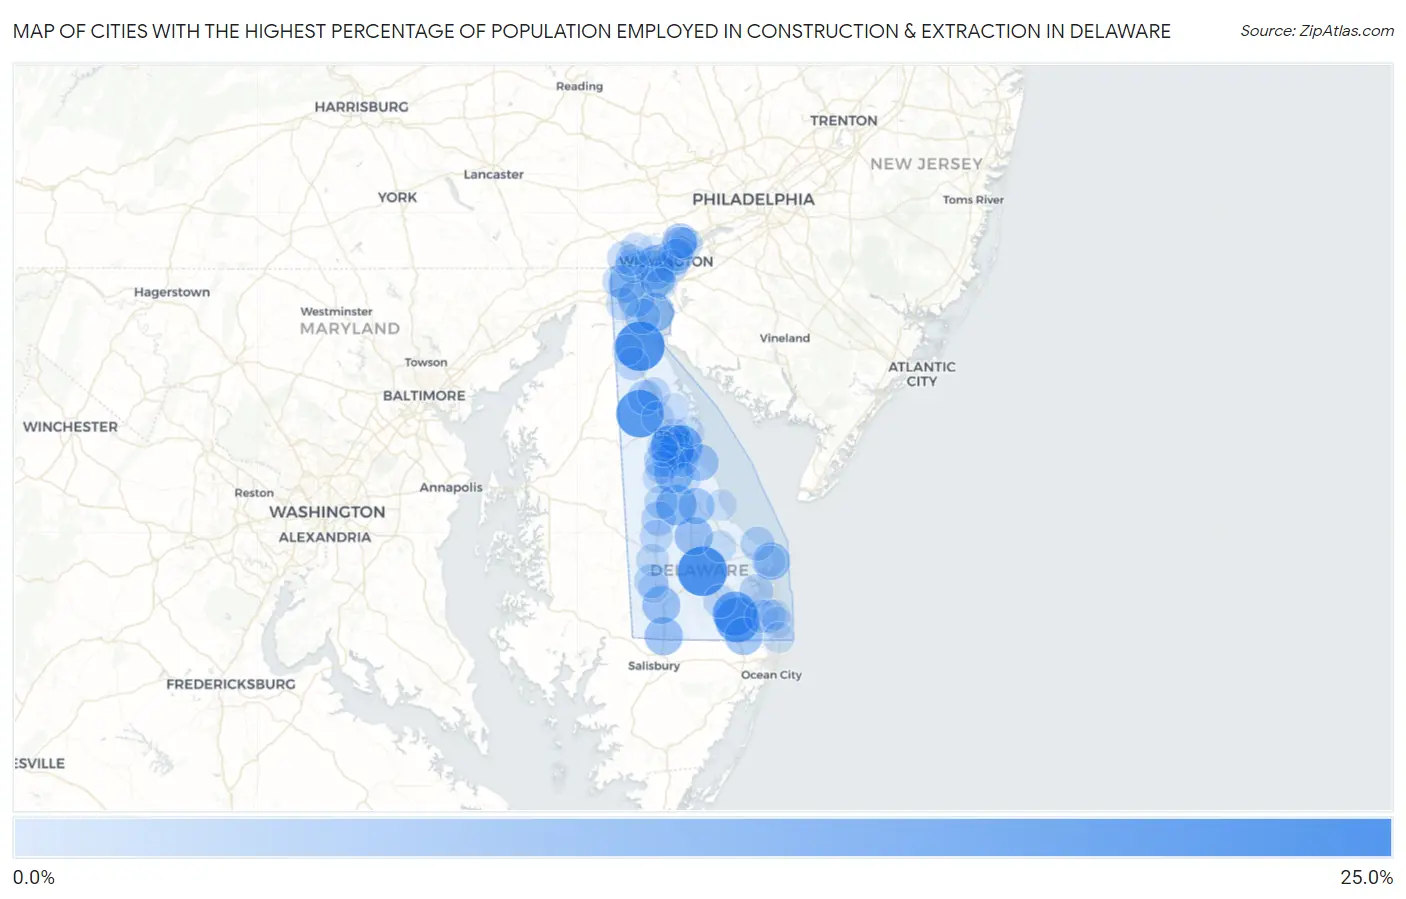
Map of Cities with the Highest Percentage of Population Employed in Construction & Extraction in Delaware
0.0%
25.0%
Cities with the Highest Percentage of Population Employed in Construction & Extraction in Delaware
| City | % Employed | vs State | vs National | |
| 1. | Georgetown | 20.3% | 4.9%(+15.4)#1 | 5.0%(+15.3)#1,331 |
| 2. | Odessa | 19.9% | 4.9%(+15.0)#2 | 5.0%(+14.9)#1,387 |
| 3. | Kenton | 18.1% | 4.9%(+13.2)#3 | 5.0%(+13.1)#1,724 |
| 4. | Frankford | 15.2% | 4.9%(+10.4)#4 | 5.0%(+10.2)#2,471 |
| 5. | Dagsboro | 14.8% | 4.9%(+9.90)#5 | 5.0%(+9.77)#2,644 |
| 6. | Highland Acres | 13.9% | 4.9%(+9.05)#6 | 5.0%(+8.92)#2,959 |
| 7. | Dover Base Housing | 12.3% | 4.9%(+7.43)#7 | 5.0%(+7.30)#3,755 |
| 8. | Houston | 10.7% | 4.9%(+5.85)#8 | 5.0%(+5.72)#4,892 |
| 9. | Riverview | 8.9% | 4.9%(+4.01)#9 | 5.0%(+3.88)#6,782 |
| 10. | Newport | 8.9% | 4.9%(+4.01)#10 | 5.0%(+3.88)#6,787 |
| 11. | Delaware City | 8.7% | 4.9%(+3.81)#11 | 5.0%(+3.68)#7,064 |
| 12. | Ellendale | 8.5% | 4.9%(+3.64)#12 | 5.0%(+3.52)#7,305 |
| 13. | Delmar | 8.4% | 4.9%(+3.52)#13 | 5.0%(+3.39)#7,471 |
| 14. | Laurel | 8.3% | 4.9%(+3.41)#14 | 5.0%(+3.29)#7,625 |
| 15. | Brookside | 7.8% | 4.9%(+2.95)#15 | 5.0%(+2.83)#8,351 |
| 16. | Henlopen Acres | 7.8% | 4.9%(+2.95)#16 | 5.0%(+2.82)#8,364 |
| 17. | Selbyville | 7.8% | 4.9%(+2.94)#17 | 5.0%(+2.82)#8,368 |
| 18. | Elsmere | 7.3% | 4.9%(+2.39)#18 | 5.0%(+2.26)#9,312 |
| 19. | Lincoln | 7.2% | 4.9%(+2.33)#19 | 5.0%(+2.20)#9,397 |
| 20. | Bowers | 6.9% | 4.9%(+2.00)#20 | 5.0%(+1.87)#10,018 |
| 21. | Bear | 6.7% | 4.9%(+1.88)#21 | 5.0%(+1.75)#10,229 |
| 22. | Milford | 6.4% | 4.9%(+1.51)#22 | 5.0%(+1.38)#11,012 |
| 23. | Rising Sun Lebanon | 5.9% | 4.9%(+1.06)#23 | 5.0%(+0.932)#12,030 |
| 24. | Edgemoor | 5.8% | 4.9%(+0.951)#24 | 5.0%(+0.823)#12,296 |
| 25. | Arden | 5.7% | 4.9%(+0.819)#25 | 5.0%(+0.692)#12,610 |
| 26. | St Georges | 5.6% | 4.9%(+0.775)#26 | 5.0%(+0.648)#12,718 |
| 27. | Wilmington Manor | 5.2% | 4.9%(+0.360)#27 | 5.0%(+0.232)#13,734 |
| 28. | Clayton | 4.9% | 4.9%(-0.006)#28 | 5.0%(-0.134)#14,703 |
| 29. | Farmington | 4.5% | 4.9%(-0.321)#29 | 5.0%(-0.449)#15,566 |
| 30. | Woodside | 4.5% | 4.9%(-0.402)#30 | 5.0%(-0.530)#15,786 |
| 31. | Ardencroft | 4.4% | 4.9%(-0.481)#31 | 5.0%(-0.608)#15,997 |
| 32. | Seaford | 4.1% | 4.9%(-0.802)#32 | 5.0%(-0.929)#16,973 |
| 33. | Lewes | 4.0% | 4.9%(-0.823)#33 | 5.0%(-0.950)#17,060 |
| 34. | Pike Creek Valley | 3.9% | 4.9%(-1.01)#34 | 5.0%(-1.14)#17,608 |
| 35. | Long Neck | 3.9% | 4.9%(-1.01)#35 | 5.0%(-1.14)#17,618 |
| 36. | Ocean View | 3.6% | 4.9%(-1.24)#36 | 5.0%(-1.36)#18,278 |
| 37. | Harrington | 3.5% | 4.9%(-1.32)#37 | 5.0%(-1.45)#18,542 |
| 38. | Magnolia | 3.4% | 4.9%(-1.42)#38 | 5.0%(-1.55)#18,835 |
| 39. | Millsboro | 3.3% | 4.9%(-1.55)#39 | 5.0%(-1.67)#19,208 |
| 40. | Millville | 3.3% | 4.9%(-1.56)#40 | 5.0%(-1.69)#19,239 |
| 41. | Woodside East | 3.3% | 4.9%(-1.60)#41 | 5.0%(-1.72)#19,362 |
| 42. | Wilmington | 3.2% | 4.9%(-1.64)#42 | 5.0%(-1.76)#19,472 |
| 43. | Townsend | 3.1% | 4.9%(-1.80)#43 | 5.0%(-1.93)#19,966 |
| 44. | Glasgow | 3.0% | 4.9%(-1.83)#44 | 5.0%(-1.95)#20,038 |
| 45. | Dover | 3.0% | 4.9%(-1.86)#45 | 5.0%(-1.99)#20,123 |
| 46. | Greenwood | 3.0% | 4.9%(-1.90)#46 | 5.0%(-2.03)#20,239 |
| 47. | North Star | 2.9% | 4.9%(-2.00)#47 | 5.0%(-2.13)#20,510 |
| 48. | Bridgeville | 2.9% | 4.9%(-2.01)#48 | 5.0%(-2.14)#20,551 |
| 49. | Newark | 2.7% | 4.9%(-2.13)#49 | 5.0%(-2.26)#20,893 |
| 50. | Smyrna | 2.7% | 4.9%(-2.13)#50 | 5.0%(-2.26)#20,900 |
| 51. | Bellefonte | 2.5% | 4.9%(-2.32)#51 | 5.0%(-2.45)#21,391 |
| 52. | Claymont | 2.5% | 4.9%(-2.34)#52 | 5.0%(-2.46)#21,438 |
| 53. | Viola | 2.4% | 4.9%(-2.43)#53 | 5.0%(-2.56)#21,673 |
| 54. | Rodney Village | 2.4% | 4.9%(-2.49)#54 | 5.0%(-2.62)#21,851 |
| 55. | Hockessin | 2.3% | 4.9%(-2.59)#55 | 5.0%(-2.72)#22,084 |
| 56. | Cheswold | 2.2% | 4.9%(-2.65)#56 | 5.0%(-2.78)#22,267 |
| 57. | Felton | 2.2% | 4.9%(-2.68)#57 | 5.0%(-2.81)#22,335 |
| 58. | Milton | 2.0% | 4.9%(-2.86)#58 | 5.0%(-2.99)#22,780 |
| 59. | Pike Creek | 1.9% | 4.9%(-2.98)#59 | 5.0%(-3.10)#23,082 |
| 60. | New Castle | 1.7% | 4.9%(-3.16)#60 | 5.0%(-3.28)#23,491 |
| 61. | Little Creek | 1.5% | 4.9%(-3.40)#61 | 5.0%(-3.52)#24,024 |
| 62. | Frederica | 1.4% | 4.9%(-3.42)#62 | 5.0%(-3.55)#24,070 |
| 63. | South Bethany | 1.4% | 4.9%(-3.48)#63 | 5.0%(-3.61)#24,172 |
| 64. | Blades | 1.3% | 4.9%(-3.55)#64 | 5.0%(-3.68)#24,294 |
| 65. | Rehoboth Beach | 1.3% | 4.9%(-3.55)#65 | 5.0%(-3.68)#24,301 |
| 66. | Middletown | 1.3% | 4.9%(-3.56)#66 | 5.0%(-3.68)#24,303 |
| 67. | Bethany Beach | 1.3% | 4.9%(-3.59)#67 | 5.0%(-3.72)#24,361 |
| 68. | Slaughter Beach | 1.1% | 4.9%(-3.72)#68 | 5.0%(-3.84)#24,596 |
| 69. | Camden | 1.1% | 4.9%(-3.73)#69 | 5.0%(-3.86)#24,629 |
| 70. | Leipsic | 1.1% | 4.9%(-3.74)#70 | 5.0%(-3.87)#24,650 |
| 71. | Ardentown | 1.0% | 4.9%(-3.87)#71 | 5.0%(-3.99)#24,851 |
| 72. | Wyoming | 1.00% | 4.9%(-3.87)#72 | 5.0%(-4.00)#24,853 |
| 73. | Fenwick Island | 0.93% | 4.9%(-3.93)#73 | 5.0%(-4.06)#24,957 |
| 74. | Greenville | 0.58% | 4.9%(-4.28)#74 | 5.0%(-4.41)#25,477 |
1
Common Questions
What are the Top 10 Cities with the Highest Percentage of Population Employed in Construction & Extraction in Delaware?
Top 10 Cities with the Highest Percentage of Population Employed in Construction & Extraction in Delaware are:
#1
20.3%
#2
19.9%
#3
18.1%
#4
15.2%
#5
14.8%
#6
13.9%
#7
12.3%
#8
10.7%
#9
8.9%
#10
8.9%
What city has the Highest Percentage of Population Employed in Construction & Extraction in Delaware?
Georgetown has the Highest Percentage of Population Employed in Construction & Extraction in Delaware with 20.3%.
What is the Percentage of Population Employed in Construction & Extraction in the State of Delaware?
Percentage of Population Employed in Construction & Extraction in Delaware is 4.9%.
What is the Percentage of Population Employed in Construction & Extraction in the United States?
Percentage of Population Employed in Construction & Extraction in the United States is 5.0%.