Riverside, CA Map & Demographics
Riverside Map
Riverside Overview
$31,632
PER CAPITA INCOME
$95,041
AVG FAMILY INCOME
$83,448
AVG HOUSEHOLD INCOME
24.0%
WAGE / INCOME GAP [ % ]
76.0¢/ $1
WAGE / INCOME GAP [ $ ]
$10,990
FAMILY INCOME DEFICIT
0.42
INEQUALITY / GINI INDEX
316,076
TOTAL POPULATION
157,363
MALE POPULATION
158,713
FEMALE POPULATION
99.15
MALES / 100 FEMALES
100.86
FEMALES / 100 MALES
32.4
MEDIAN AGE
3.8
AVG FAMILY SIZE
3.3
AVG HOUSEHOLD SIZE
160,182
LABOR FORCE [ PEOPLE ]
64.0%
PERCENT IN LABOR FORCE
6.1%
UNEMPLOYMENT RATE
Income in Riverside
Income Overview in Riverside
Per Capita Income in Riverside is $31,632, while median incomes of families and households are $95,041 and $83,448 respectively.
| Characteristic | Number | Measure |
| Per Capita Income | 316,076 | $31,632 |
| Median Family Income | 66,776 | $95,041 |
| Mean Family Income | 66,776 | $114,521 |
| Median Household Income | 90,540 | $83,448 |
| Mean Household Income | 90,540 | $104,490 |
| Income Deficit | 66,776 | $10,990 |
| Wage / Income Gap (%) | 316,076 | 24.04% |
| Wage / Income Gap ($) | 316,076 | 75.96¢ per $1 |
| Gini / Inequality Index | 316,076 | 0.42 |
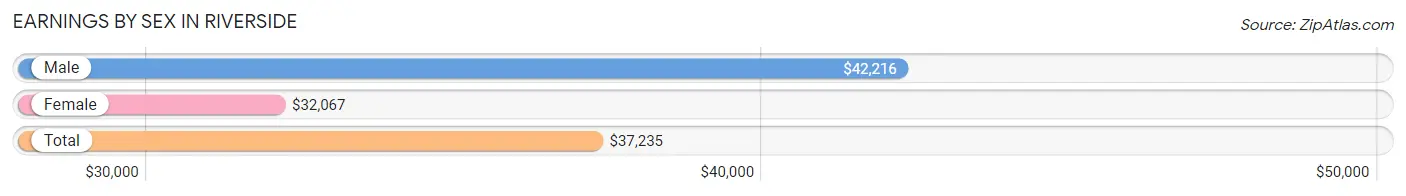
Earnings by Sex in Riverside
Average Earnings in Riverside are $37,235, $42,216 for men and $32,067 for women, a difference of 24.0%.
| Sex | Number | Average Earnings |
| Male | 88,593 (53.9%) | $42,216 |
| Female | 75,839 (46.1%) | $32,067 |
| Total | 164,432 (100.0%) | $37,235 |
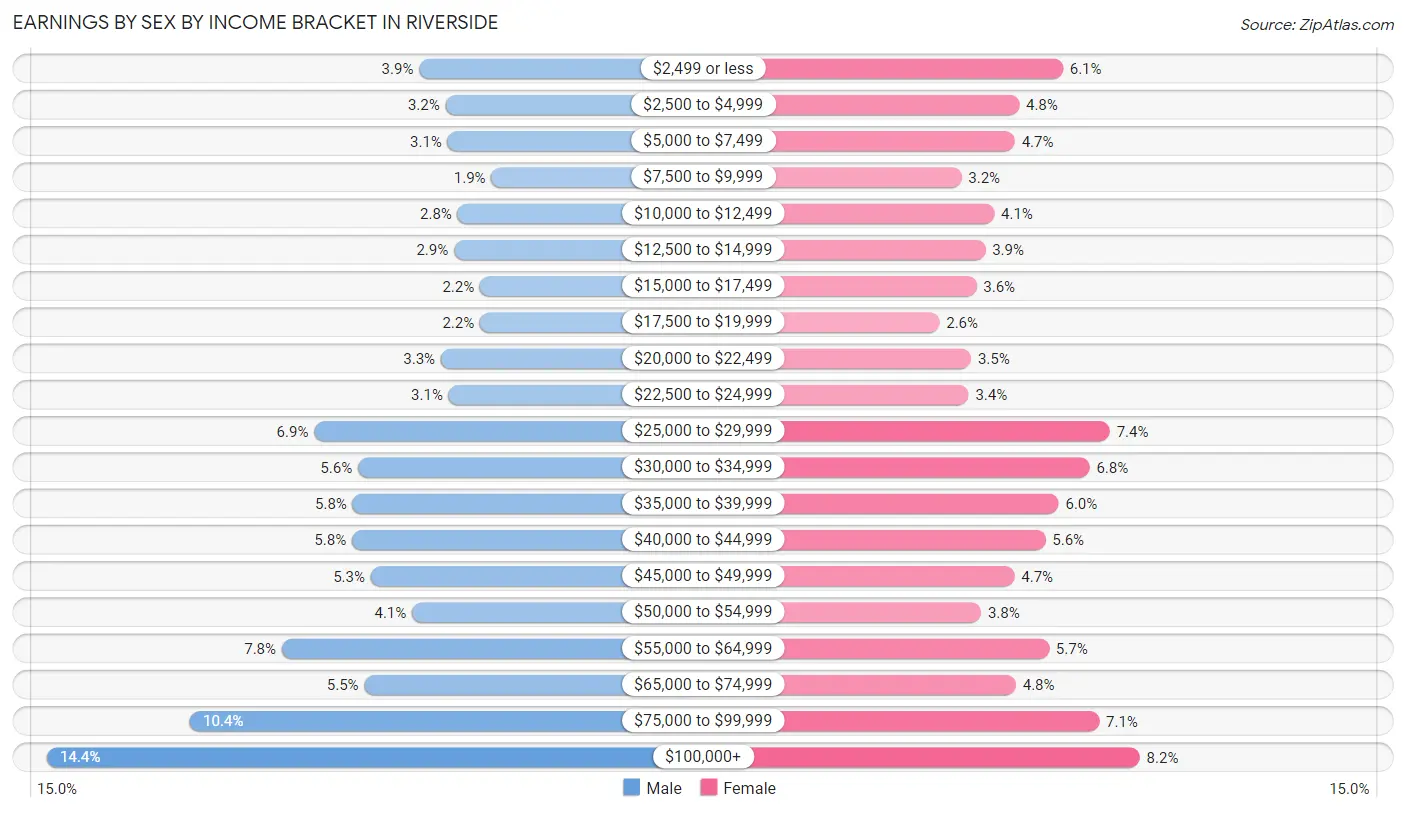
Earnings by Sex by Income Bracket in Riverside
The most common earnings brackets in Riverside are $100,000+ for men (12,733 | 14.4%) and $100,000+ for women (6,241 | 8.2%).
| Income | Male | Female |
| $2,499 or less | 3,465 (3.9%) | 4,603 (6.1%) |
| $2,500 to $4,999 | 2,811 (3.2%) | 3,674 (4.8%) |
| $5,000 to $7,499 | 2,754 (3.1%) | 3,580 (4.7%) |
| $7,500 to $9,999 | 1,669 (1.9%) | 2,439 (3.2%) |
| $10,000 to $12,499 | 2,509 (2.8%) | 3,143 (4.1%) |
| $12,500 to $14,999 | 2,592 (2.9%) | 2,949 (3.9%) |
| $15,000 to $17,499 | 1,947 (2.2%) | 2,761 (3.6%) |
| $17,500 to $19,999 | 1,952 (2.2%) | 1,975 (2.6%) |
| $20,000 to $22,499 | 2,925 (3.3%) | 2,644 (3.5%) |
| $22,500 to $24,999 | 2,732 (3.1%) | 2,595 (3.4%) |
| $25,000 to $29,999 | 6,081 (6.9%) | 5,606 (7.4%) |
| $30,000 to $34,999 | 4,984 (5.6%) | 5,170 (6.8%) |
| $35,000 to $39,999 | 5,121 (5.8%) | 4,510 (5.9%) |
| $40,000 to $44,999 | 5,137 (5.8%) | 4,233 (5.6%) |
| $45,000 to $49,999 | 4,670 (5.3%) | 3,572 (4.7%) |
| $50,000 to $54,999 | 3,639 (4.1%) | 2,860 (3.8%) |
| $55,000 to $64,999 | 6,881 (7.8%) | 4,310 (5.7%) |
| $65,000 to $74,999 | 4,826 (5.4%) | 3,600 (4.8%) |
| $75,000 to $99,999 | 9,165 (10.3%) | 5,374 (7.1%) |
| $100,000+ | 12,733 (14.4%) | 6,241 (8.2%) |
| Total | 88,593 (100.0%) | 75,839 (100.0%) |
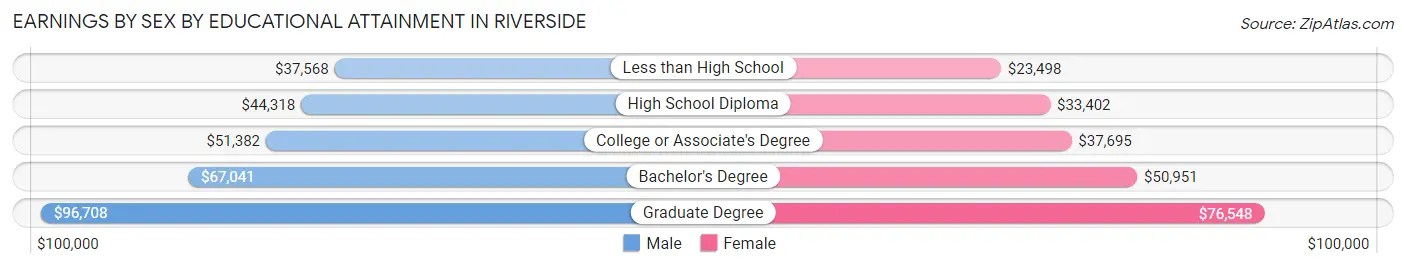
Earnings by Sex by Educational Attainment in Riverside
Average earnings in Riverside are $48,973 for men and $38,557 for women, a difference of 21.3%. Men with an educational attainment of graduate degree enjoy the highest average annual earnings of $96,708, while those with less than high school education earn the least with $37,568. Women with an educational attainment of graduate degree earn the most with the average annual earnings of $76,548, while those with less than high school education have the smallest earnings of $23,498.
| Educational Attainment | Male Income | Female Income |
| Less than High School | $37,568 | $23,498 |
| High School Diploma | $44,318 | $33,402 |
| College or Associate's Degree | $51,382 | $37,695 |
| Bachelor's Degree | $67,041 | $50,951 |
| Graduate Degree | $96,708 | $76,548 |
| Total | $48,973 | $38,557 |
Family Income in Riverside
Family Income Brackets in Riverside
According to the Riverside family income data, there are 15,225 families falling into the $100,000 to $149,999 income range, which is the most common income bracket and makes up 22.8% of all families. Conversely, the $10,000 to $14,999 income bracket is the least frequent group with only 1,068 families (1.6%) belonging to this category.
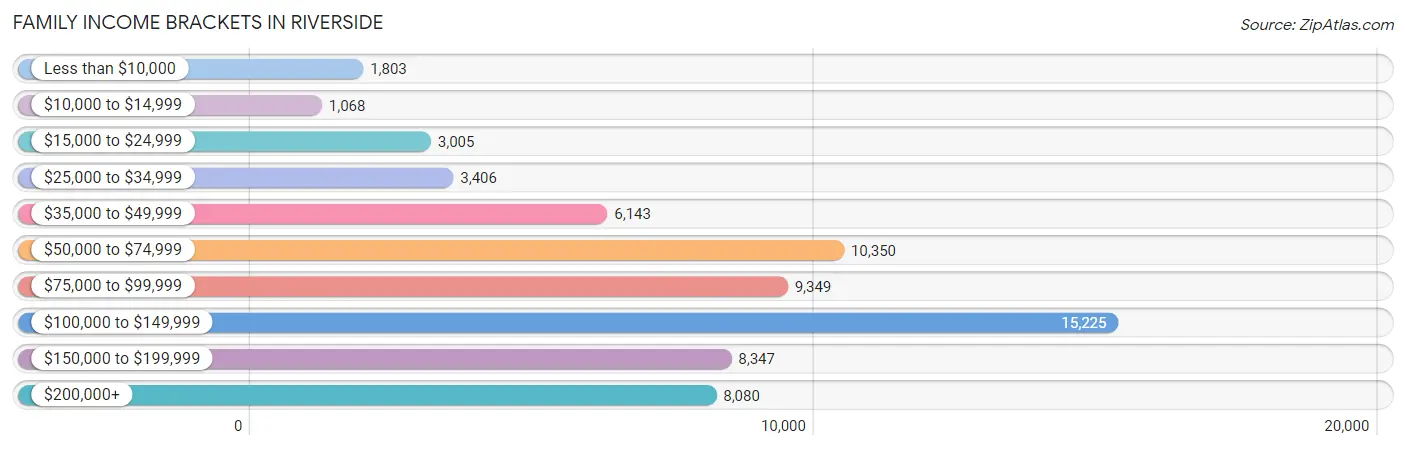
| Income Bracket | # Families | % Families |
| Less than $10,000 | 1,803 | 2.7% |
| $10,000 to $14,999 | 1,068 | 1.6% |
| $15,000 to $24,999 | 3,005 | 4.5% |
| $25,000 to $34,999 | 3,406 | 5.1% |
| $35,000 to $49,999 | 6,143 | 9.2% |
| $50,000 to $74,999 | 10,350 | 15.5% |
| $75,000 to $99,999 | 9,349 | 14.0% |
| $100,000 to $149,999 | 15,225 | 22.8% |
| $150,000 to $199,999 | 8,347 | 12.5% |
| $200,000+ | 8,080 | 12.1% |
Family Income by Famaliy Size in Riverside
7+ person families (2,975 | 4.5%) account for the highest median family income in Riverside with $125,026 per family, while 2-person families (22,128 | 33.1%) have the highest median income of $39,014 per family member.
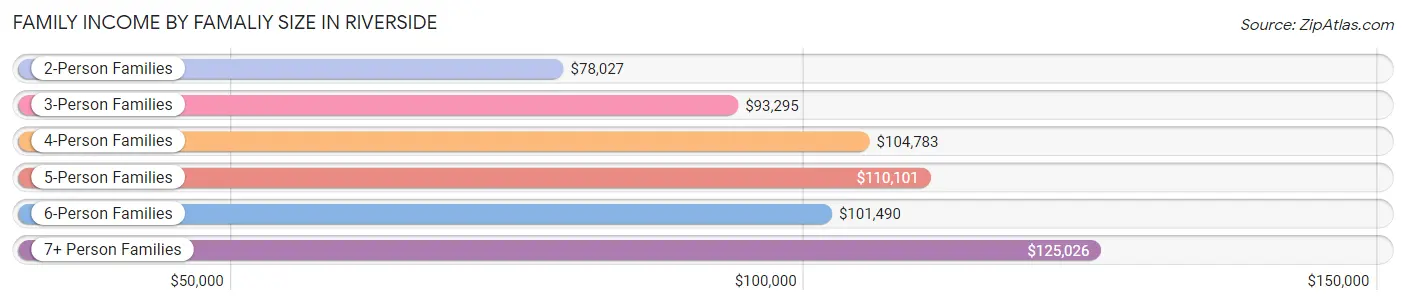
| Income Bracket | # Families | Median Income |
| 2-Person Families | 22,128 (33.1%) | $78,027 |
| 3-Person Families | 14,613 (21.9%) | $93,295 |
| 4-Person Families | 14,393 (21.5%) | $104,783 |
| 5-Person Families | 8,628 (12.9%) | $110,101 |
| 6-Person Families | 4,039 (6.0%) | $101,490 |
| 7+ Person Families | 2,975 (4.5%) | $125,026 |
| Total | 66,776 (100.0%) | $95,041 |
Family Income by Number of Earners in Riverside
The median family income in Riverside is $95,041, with families comprising 3+ earners (12,688) having the highest median family income of $141,084, while families with no earners (5,962) have the lowest median family income of $48,419, accounting for 19.0% and 8.9% of families, respectively.
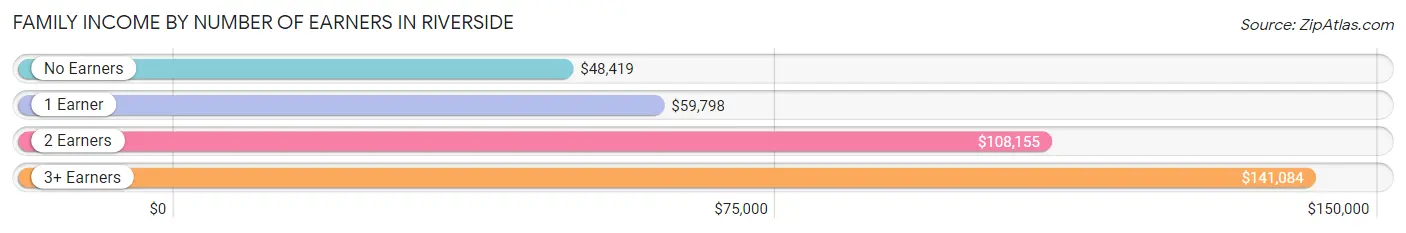
| Number of Earners | # Families | Median Income |
| No Earners | 5,962 (8.9%) | $48,419 |
| 1 Earner | 21,512 (32.2%) | $59,798 |
| 2 Earners | 26,614 (39.9%) | $108,155 |
| 3+ Earners | 12,688 (19.0%) | $141,084 |
| Total | 66,776 (100.0%) | $95,041 |
Household Income in Riverside
Household Income Brackets in Riverside
With 18,199 households falling in the category, the $100,000 to $149,999 income range is the most frequent in Riverside, accounting for 20.1% of all households. In contrast, only 2,626 households (2.9%) fall into the $10,000 to $14,999 income bracket, making it the least populous group.
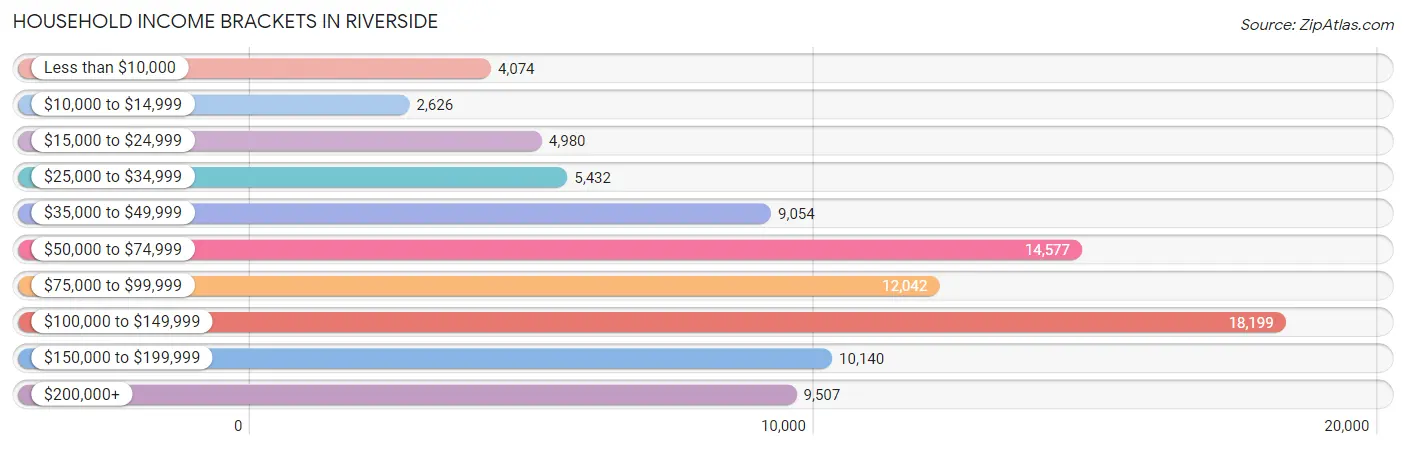
| Income Bracket | # Households | % Households |
| Less than $10,000 | 4,074 | 4.5% |
| $10,000 to $14,999 | 2,626 | 2.9% |
| $15,000 to $24,999 | 4,980 | 5.5% |
| $25,000 to $34,999 | 5,432 | 6.0% |
| $35,000 to $49,999 | 9,054 | 10.0% |
| $50,000 to $74,999 | 14,577 | 16.1% |
| $75,000 to $99,999 | 12,042 | 13.3% |
| $100,000 to $149,999 | 18,199 | 20.1% |
| $150,000 to $199,999 | 10,140 | 11.2% |
| $200,000+ | 9,507 | 10.5% |
Household Income by Householder Age in Riverside
The median household income in Riverside is $83,448, with the highest median household income of $105,982 found in the 45 to 64 years age bracket for the primary householder. A total of 33,791 households (37.3%) fall into this category. Meanwhile, the 15 to 24 years age bracket for the primary householder has the lowest median household income of $39,943, with 3,434 households (3.8%) in this group.
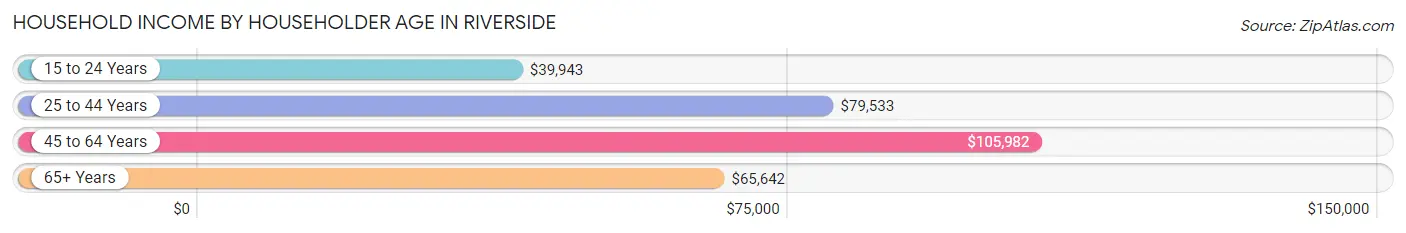
| Income Bracket | # Households | Median Income |
| 15 to 24 Years | 3,434 (3.8%) | $39,943 |
| 25 to 44 Years | 34,199 (37.8%) | $79,533 |
| 45 to 64 Years | 33,791 (37.3%) | $105,982 |
| 65+ Years | 19,116 (21.1%) | $65,642 |
| Total | 90,540 (100.0%) | $83,448 |
Poverty in Riverside
Income Below Poverty by Sex and Age in Riverside
With 11.8% poverty level for males and 13.7% for females among the residents of Riverside, 18 to 24 year old males and 5 year old females are the most vulnerable to poverty, with 3,320 males (18.9%) and 370 females (21.4%) in their respective age groups living below the poverty level.
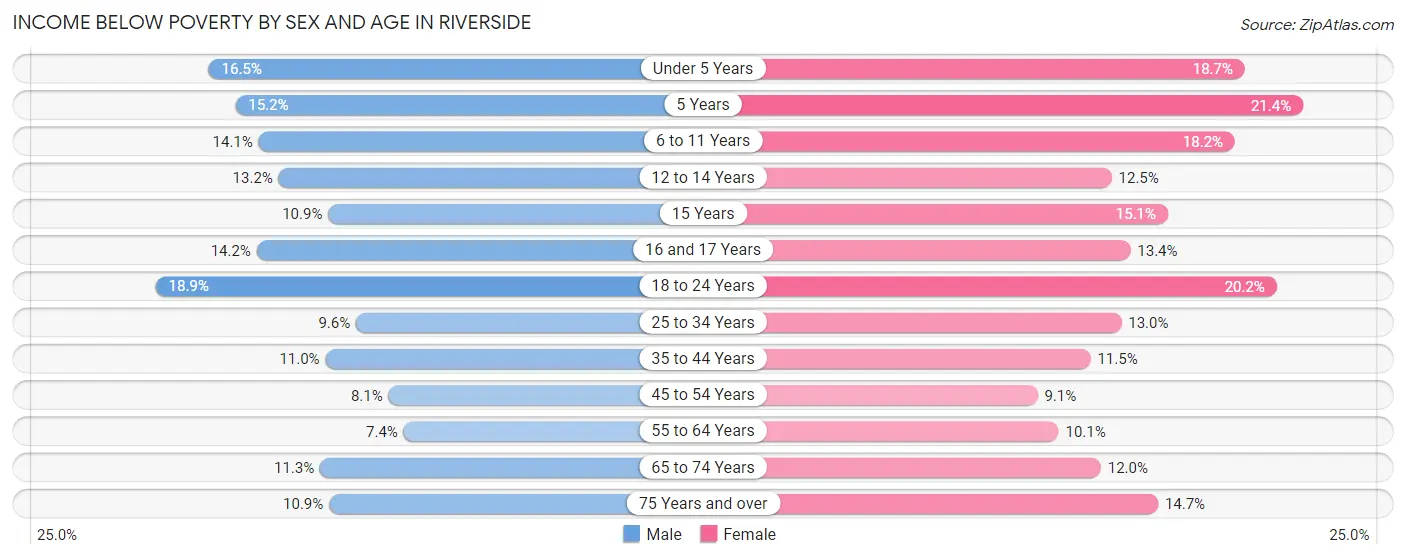
| Age Bracket | Male | Female |
| Under 5 Years | 1,506 (16.5%) | 1,659 (18.7%) |
| 5 Years | 350 (15.2%) | 370 (21.4%) |
| 6 to 11 Years | 1,794 (14.1%) | 2,027 (18.2%) |
| 12 to 14 Years | 987 (13.2%) | 824 (12.5%) |
| 15 Years | 245 (10.9%) | 362 (15.1%) |
| 16 and 17 Years | 639 (14.2%) | 556 (13.4%) |
| 18 to 24 Years | 3,320 (18.9%) | 3,361 (20.2%) |
| 25 to 34 Years | 2,449 (9.6%) | 3,046 (13.0%) |
| 35 to 44 Years | 2,376 (11.0%) | 2,431 (11.5%) |
| 45 to 54 Years | 1,490 (8.1%) | 1,660 (9.1%) |
| 55 to 64 Years | 1,159 (7.4%) | 1,565 (10.1%) |
| 65 to 74 Years | 1,059 (11.3%) | 1,465 (12.0%) |
| 75 Years and over | 528 (10.9%) | 1,204 (14.7%) |
| Total | 17,902 (11.8%) | 20,530 (13.7%) |
Income Above Poverty by Sex and Age in Riverside
According to the poverty statistics in Riverside, males aged 55 to 64 years and females aged 45 to 54 years are the age groups that are most secure financially, with 92.6% of males and 90.9% of females in these age groups living above the poverty line.
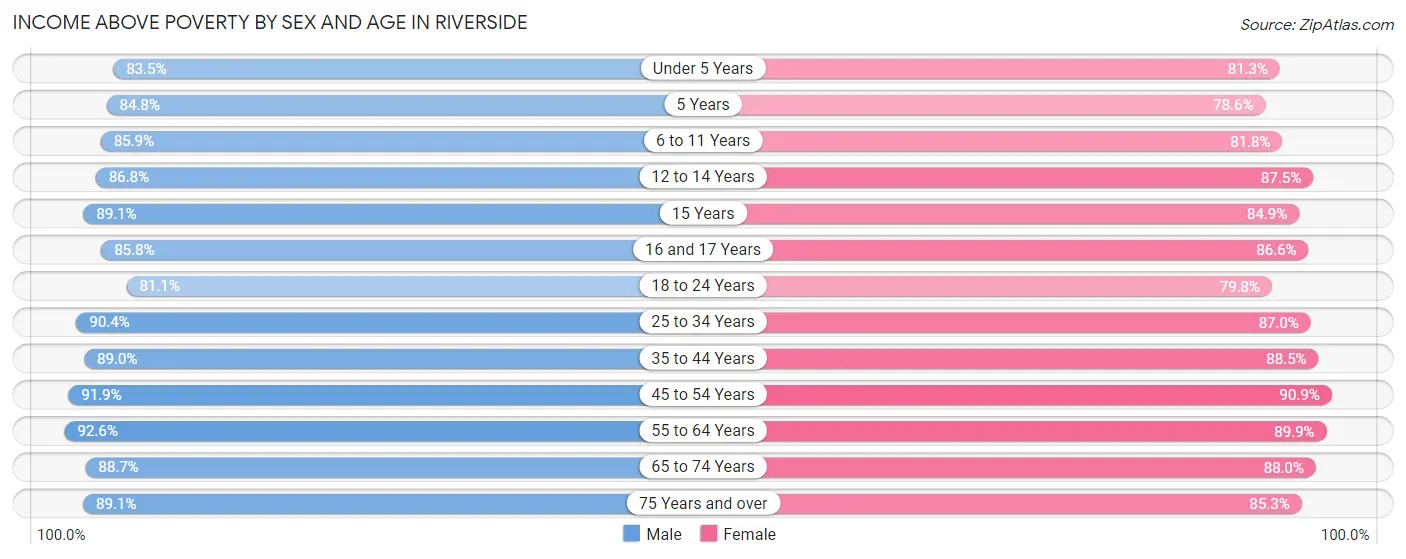
| Age Bracket | Male | Female |
| Under 5 Years | 7,646 (83.5%) | 7,213 (81.3%) |
| 5 Years | 1,950 (84.8%) | 1,359 (78.6%) |
| 6 to 11 Years | 10,892 (85.9%) | 9,085 (81.8%) |
| 12 to 14 Years | 6,483 (86.8%) | 5,755 (87.5%) |
| 15 Years | 2,001 (89.1%) | 2,031 (84.9%) |
| 16 and 17 Years | 3,851 (85.8%) | 3,597 (86.6%) |
| 18 to 24 Years | 14,225 (81.1%) | 13,295 (79.8%) |
| 25 to 34 Years | 22,997 (90.4%) | 20,436 (87.0%) |
| 35 to 44 Years | 19,143 (89.0%) | 18,629 (88.5%) |
| 45 to 54 Years | 16,874 (91.9%) | 16,626 (90.9%) |
| 55 to 64 Years | 14,483 (92.6%) | 13,996 (89.9%) |
| 65 to 74 Years | 8,324 (88.7%) | 10,726 (88.0%) |
| 75 Years and over | 4,330 (89.1%) | 7,006 (85.3%) |
| Total | 133,199 (88.1%) | 129,754 (86.3%) |
Income Below Poverty Among Married-Couple Families in Riverside
The poverty statistics for married-couple families in Riverside show that 5.0% or 2,278 of the total 45,538 families live below the poverty line. Families with 5 or more children have the highest poverty rate of 32.9%, comprising of 90 families. On the other hand, families with no children have the lowest poverty rate of 2.8%, which includes 614 families.
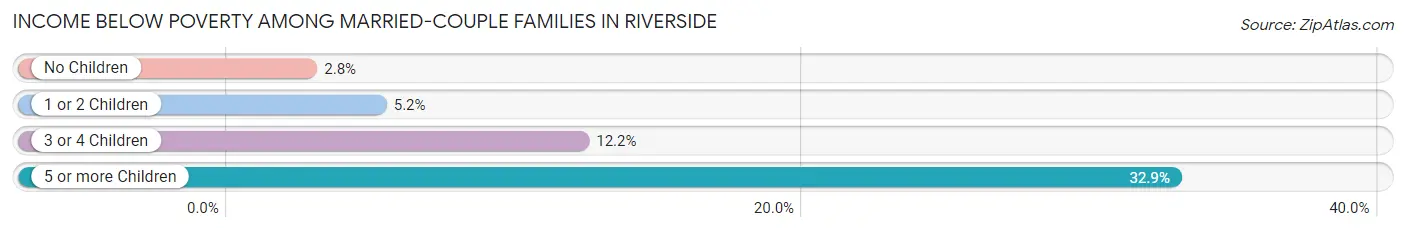
| Children | Above Poverty | Below Poverty |
| No Children | 21,659 (97.2%) | 614 (2.8%) |
| 1 or 2 Children | 16,652 (94.8%) | 910 (5.2%) |
| 3 or 4 Children | 4,765 (87.8%) | 664 (12.2%) |
| 5 or more Children | 184 (67.1%) | 90 (32.9%) |
| Total | 43,260 (95.0%) | 2,278 (5.0%) |
Income Below Poverty Among Single-Parent Households in Riverside
According to the poverty data in Riverside, 13.1% or 858 single-father households and 19.4% or 2,850 single-mother households are living below the poverty line. Among single-father households, those with 3 or 4 children have the highest poverty rate, with 240 households (31.4%) experiencing poverty. Likewise, among single-mother households, those with 3 or 4 children have the highest poverty rate, with 570 households (32.3%) falling below the poverty line.
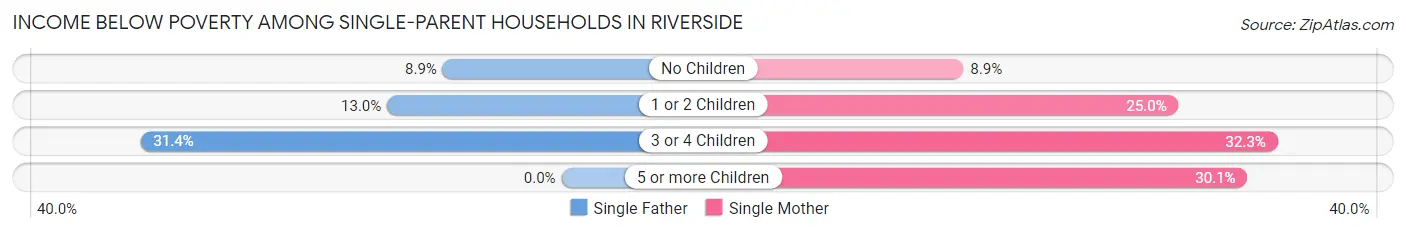
| Children | Single Father | Single Mother |
| No Children | 275 (8.8%) | 529 (8.9%) |
| 1 or 2 Children | 343 (13.0%) | 1,714 (24.9%) |
| 3 or 4 Children | 240 (31.4%) | 570 (32.3%) |
| 5 or more Children | 0 (0.0%) | 37 (30.1%) |
| Total | 858 (13.1%) | 2,850 (19.4%) |
Income Below Poverty Among Married-Couple vs Single-Parent Households in Riverside
The poverty data for Riverside shows that 2,278 of the married-couple family households (5.0%) and 3,708 of the single-parent households (17.5%) are living below the poverty level. Within the married-couple family households, those with 5 or more children have the highest poverty rate, with 90 households (32.9%) falling below the poverty line. Among the single-parent households, those with 3 or 4 children have the highest poverty rate, with 810 household (32.0%) living below poverty.
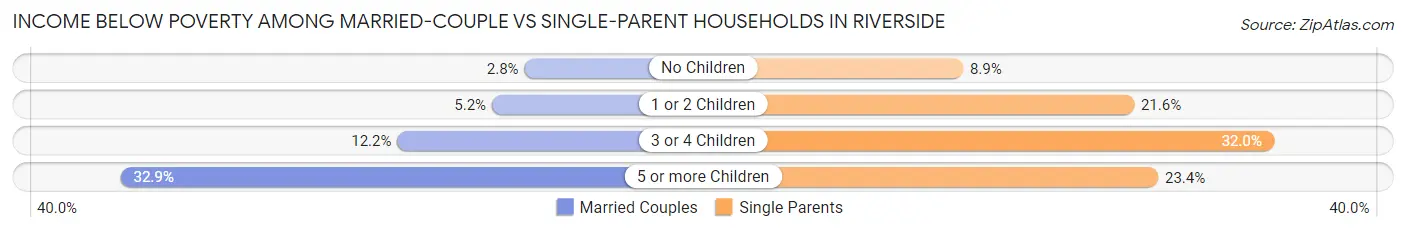
| Children | Married-Couple Families | Single-Parent Households |
| No Children | 614 (2.8%) | 804 (8.9%) |
| 1 or 2 Children | 910 (5.2%) | 2,057 (21.6%) |
| 3 or 4 Children | 664 (12.2%) | 810 (32.0%) |
| 5 or more Children | 90 (32.9%) | 37 (23.4%) |
| Total | 2,278 (5.0%) | 3,708 (17.5%) |
Race in Riverside
The most populous races in Riverside are Hispanic or Latino (174,987 | 55.4%), White / Caucasian (143,019 | 45.3%), and Some other Race (84,037 | 26.6%).
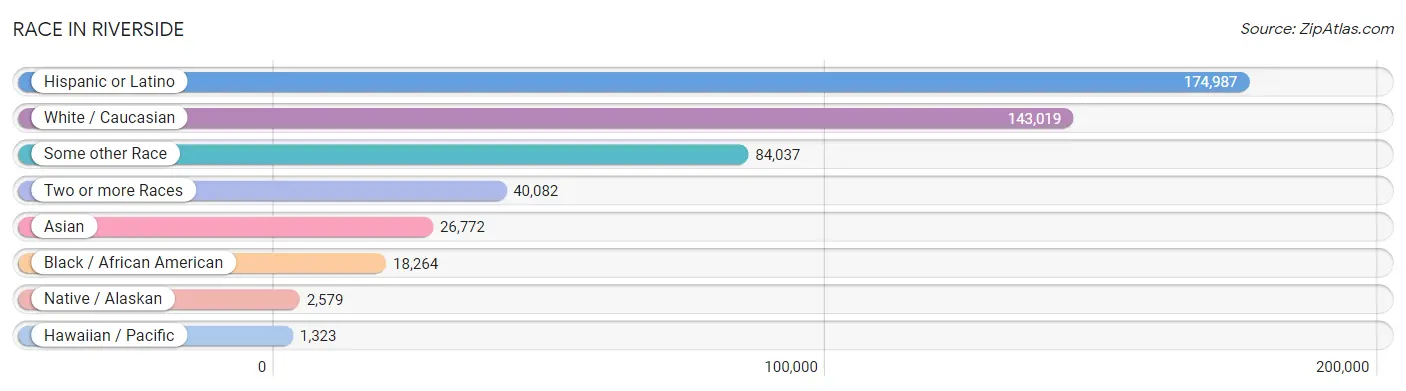
| Race | # Population | % Population |
| Asian | 26,772 | 8.5% |
| Black / African American | 18,264 | 5.8% |
| Hawaiian / Pacific | 1,323 | 0.4% |
| Hispanic or Latino | 174,987 | 55.4% |
| Native / Alaskan | 2,579 | 0.8% |
| White / Caucasian | 143,019 | 45.3% |
| Two or more Races | 40,082 | 12.7% |
| Some other Race | 84,037 | 26.6% |
| Total | 316,076 | 100.0% |
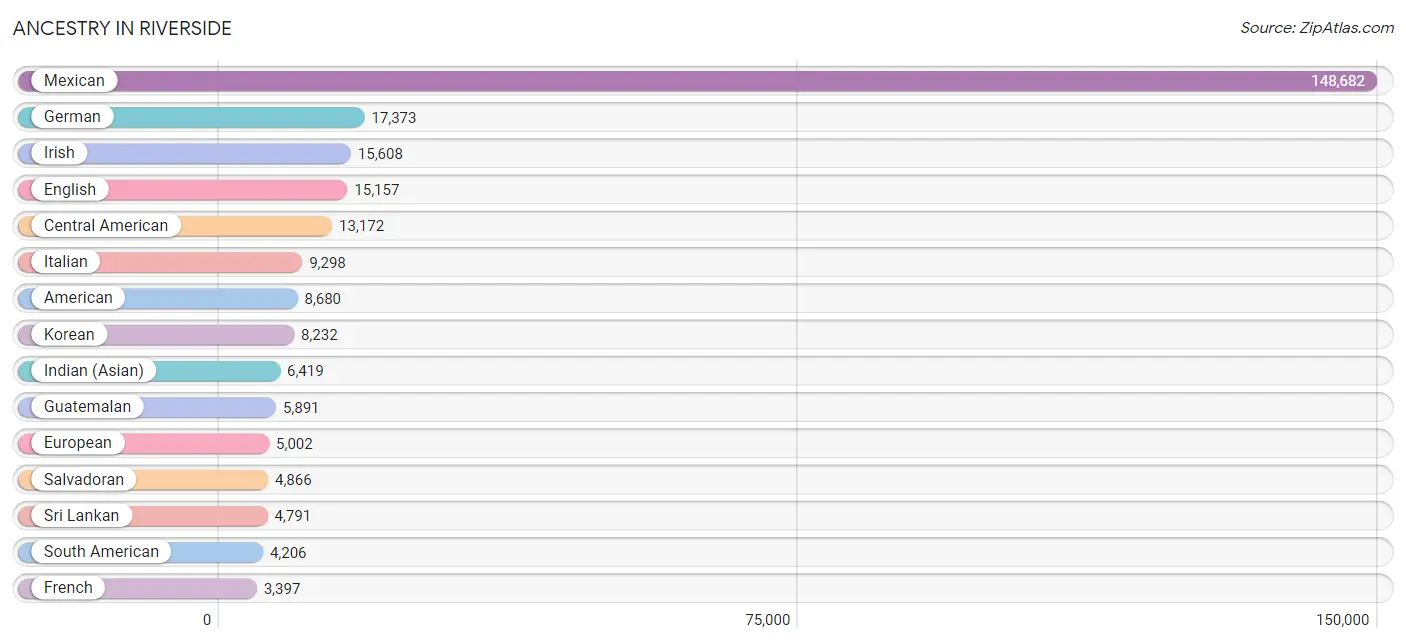
Ancestry in Riverside
The most populous ancestries reported in Riverside are Mexican (148,682 | 47.0%), German (17,373 | 5.5%), Irish (15,608 | 4.9%), English (15,157 | 4.8%), and Central American (13,172 | 4.2%), together accounting for 66.4% of all Riverside residents.
| Ancestry | # Population | % Population |
| Afghan | 44 | 0.0% |
| African | 1,499 | 0.5% |
| Alaska Native | 7 | 0.0% |
| Alaskan Athabascan | 59 | 0.0% |
| American | 8,680 | 2.8% |
| Apache | 454 | 0.1% |
| Arab | 2,747 | 0.9% |
| Argentinean | 389 | 0.1% |
| Armenian | 234 | 0.1% |
| Australian | 76 | 0.0% |
| Austrian | 308 | 0.1% |
| Bangladeshi | 39 | 0.0% |
| Barbadian | 31 | 0.0% |
| Basque | 70 | 0.0% |
| Belgian | 82 | 0.0% |
| Belizean | 95 | 0.0% |
| Bermudan | 6 | 0.0% |
| Bhutanese | 2,166 | 0.7% |
| Blackfeet | 239 | 0.1% |
| Bolivian | 134 | 0.0% |
| Brazilian | 300 | 0.1% |
| British | 1,377 | 0.4% |
| British West Indian | 23 | 0.0% |
| Bulgarian | 56 | 0.0% |
| Burmese | 2,585 | 0.8% |
| Cajun | 79 | 0.0% |
| Cambodian | 22 | 0.0% |
| Canadian | 460 | 0.2% |
| Celtic | 29 | 0.0% |
| Central American | 13,172 | 4.2% |
| Central American Indian | 534 | 0.2% |
| Cherokee | 909 | 0.3% |
| Cheyenne | 6 | 0.0% |
| Chickasaw | 41 | 0.0% |
| Chilean | 175 | 0.1% |
| Chinese | 57 | 0.0% |
| Chippewa | 27 | 0.0% |
| Choctaw | 62 | 0.0% |
| Colombian | 1,576 | 0.5% |
| Comanche | 5 | 0.0% |
| Costa Rican | 417 | 0.1% |
| Creek | 23 | 0.0% |
| Croatian | 316 | 0.1% |
| Cuban | 819 | 0.3% |
| Czech | 318 | 0.1% |
| Czechoslovakian | 170 | 0.1% |
| Danish | 705 | 0.2% |
| Delaware | 1 | 0.0% |
| Dominican | 338 | 0.1% |
| Dutch | 1,951 | 0.6% |
| Eastern European | 259 | 0.1% |
| Ecuadorian | 255 | 0.1% |
| Egyptian | 445 | 0.1% |
| English | 15,157 | 4.8% |
| Ethiopian | 110 | 0.0% |
| European | 5,002 | 1.6% |
| Filipino | 596 | 0.2% |
| Finnish | 277 | 0.1% |
| French | 3,397 | 1.1% |
| French American Indian | 74 | 0.0% |
| French Canadian | 701 | 0.2% |
| German | 17,373 | 5.5% |
| Ghanaian | 25 | 0.0% |
| Greek | 889 | 0.3% |
| Guamanian / Chamorro | 201 | 0.1% |
| Guatemalan | 5,891 | 1.9% |
| Guyanese | 22 | 0.0% |
| Haitian | 15 | 0.0% |
| Honduran | 946 | 0.3% |
| Hungarian | 671 | 0.2% |
| Icelander | 30 | 0.0% |
| Indian (Asian) | 6,419 | 2.0% |
| Indonesian | 143 | 0.1% |
| Iranian | 514 | 0.2% |
| Iraqi | 87 | 0.0% |
| Irish | 15,608 | 4.9% |
| Iroquois | 66 | 0.0% |
| Israeli | 76 | 0.0% |
| Italian | 9,298 | 2.9% |
| Jamaican | 383 | 0.1% |
| Japanese | 836 | 0.3% |
| Jordanian | 284 | 0.1% |
| Korean | 8,232 | 2.6% |
| Laotian | 240 | 0.1% |
| Latvian | 41 | 0.0% |
| Lebanese | 651 | 0.2% |
| Lithuanian | 129 | 0.0% |
| Lumbee | 12 | 0.0% |
| Luxembourger | 21 | 0.0% |
| Malaysian | 267 | 0.1% |
| Mexican | 148,682 | 47.0% |
| Mexican American Indian | 1,374 | 0.4% |
| Moroccan | 26 | 0.0% |
| Native Hawaiian | 993 | 0.3% |
| Navajo | 303 | 0.1% |
| Nicaraguan | 866 | 0.3% |
| Nigerian | 612 | 0.2% |
| Northern European | 164 | 0.1% |
| Norwegian | 2,043 | 0.6% |
| Osage | 8 | 0.0% |
| Paiute | 165 | 0.1% |
| Pakistani | 546 | 0.2% |
| Palestinian | 343 | 0.1% |
| Panamanian | 162 | 0.1% |
| Pennsylvania German | 20 | 0.0% |
| Peruvian | 1,256 | 0.4% |
| Pima | 18 | 0.0% |
| Polish | 2,290 | 0.7% |
| Portuguese | 610 | 0.2% |
| Pueblo | 221 | 0.1% |
| Puerto Rican | 1,991 | 0.6% |
| Romanian | 612 | 0.2% |
| Russian | 1,041 | 0.3% |
| Salvadoran | 4,866 | 1.5% |
| Samoan | 704 | 0.2% |
| Scandinavian | 831 | 0.3% |
| Scotch-Irish | 907 | 0.3% |
| Scottish | 2,722 | 0.9% |
| Seminole | 18 | 0.0% |
| Serbian | 139 | 0.0% |
| Shoshone | 44 | 0.0% |
| Sioux | 226 | 0.1% |
| Slavic | 11 | 0.0% |
| Slovak | 184 | 0.1% |
| Slovene | 74 | 0.0% |
| South African | 55 | 0.0% |
| South American | 4,206 | 1.3% |
| South American Indian | 60 | 0.0% |
| Spaniard | 1,962 | 0.6% |
| Spanish | 1,198 | 0.4% |
| Spanish American | 18 | 0.0% |
| Spanish American Indian | 52 | 0.0% |
| Sri Lankan | 4,791 | 1.5% |
| Subsaharan African | 2,585 | 0.8% |
| Sudanese | 83 | 0.0% |
| Swedish | 1,612 | 0.5% |
| Swiss | 288 | 0.1% |
| Syrian | 434 | 0.1% |
| Thai | 3,256 | 1.0% |
| Tohono O'Odham | 50 | 0.0% |
| Tongan | 58 | 0.0% |
| Trinidadian and Tobagonian | 4 | 0.0% |
| Turkish | 430 | 0.1% |
| Ukrainian | 378 | 0.1% |
| Venezuelan | 398 | 0.1% |
| Vietnamese | 185 | 0.1% |
| Welsh | 843 | 0.3% |
| West Indian | 124 | 0.0% |
| Yaqui | 276 | 0.1% |
| Yugoslavian | 229 | 0.1% |
| Yuman | 134 | 0.0% |
| Zimbabwean | 31 | 0.0% | View All 152 Rows |
Immigrants in Riverside
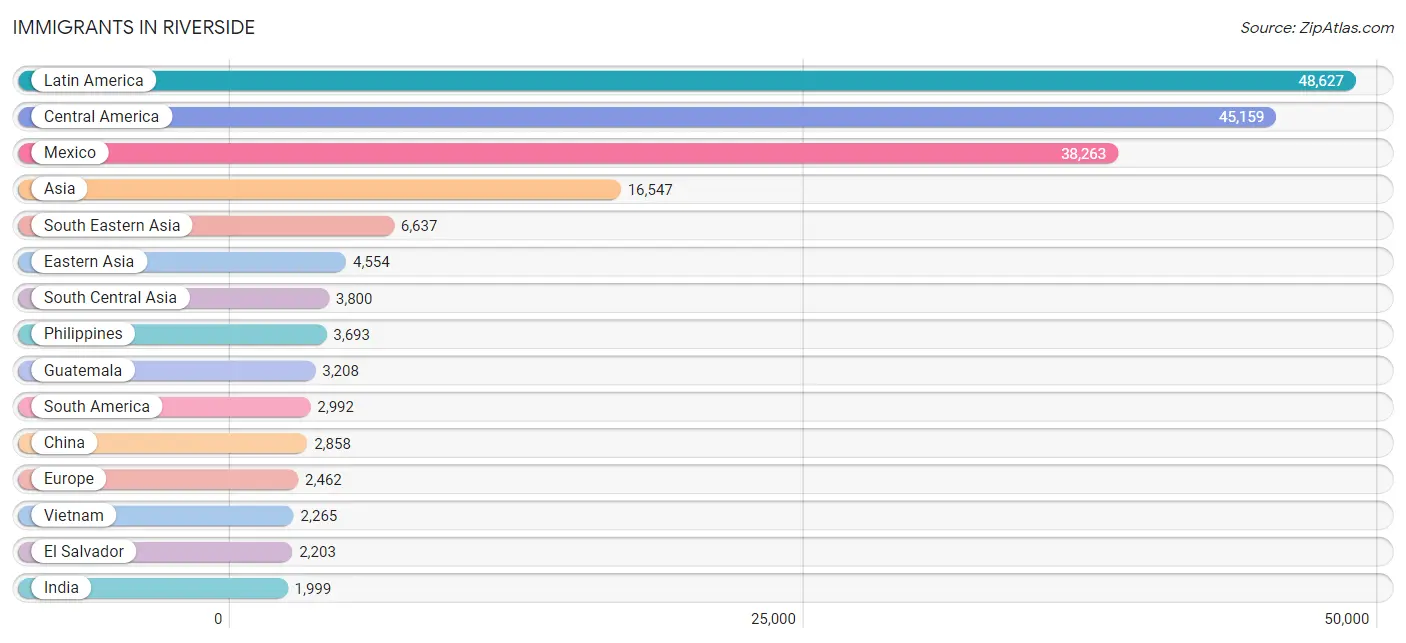
The most numerous immigrant groups reported in Riverside came from Latin America (48,627 | 15.4%), Central America (45,159 | 14.3%), Mexico (38,263 | 12.1%), Asia (16,547 | 5.2%), and South Eastern Asia (6,637 | 2.1%), together accounting for 49.1% of all Riverside residents.
| Immigration Origin | # Population | % Population |
| Afghanistan | 66 | 0.0% |
| Africa | 1,915 | 0.6% |
| Argentina | 191 | 0.1% |
| Armenia | 6 | 0.0% |
| Asia | 16,547 | 5.2% |
| Australia | 34 | 0.0% |
| Austria | 36 | 0.0% |
| Bangladesh | 304 | 0.1% |
| Barbados | 13 | 0.0% |
| Belarus | 6 | 0.0% |
| Belgium | 23 | 0.0% |
| Belize | 99 | 0.0% |
| Bolivia | 102 | 0.0% |
| Brazil | 375 | 0.1% |
| Bulgaria | 30 | 0.0% |
| Cambodia | 210 | 0.1% |
| Cameroon | 14 | 0.0% |
| Canada | 442 | 0.1% |
| Caribbean | 476 | 0.2% |
| Central America | 45,159 | 14.3% |
| Chile | 52 | 0.0% |
| China | 2,858 | 0.9% |
| Colombia | 1,066 | 0.3% |
| Costa Rica | 193 | 0.1% |
| Croatia | 78 | 0.0% |
| Cuba | 226 | 0.1% |
| Czechoslovakia | 98 | 0.0% |
| Denmark | 4 | 0.0% |
| Dominican Republic | 21 | 0.0% |
| Eastern Africa | 315 | 0.1% |
| Eastern Asia | 4,554 | 1.4% |
| Eastern Europe | 833 | 0.3% |
| Ecuador | 80 | 0.0% |
| Egypt | 558 | 0.2% |
| El Salvador | 2,203 | 0.7% |
| England | 258 | 0.1% |
| Eritrea | 12 | 0.0% |
| Ethiopia | 137 | 0.0% |
| Europe | 2,462 | 0.8% |
| Fiji | 85 | 0.0% |
| France | 144 | 0.1% |
| Germany | 276 | 0.1% |
| Ghana | 157 | 0.1% |
| Greece | 67 | 0.0% |
| Guatemala | 3,208 | 1.0% |
| Guyana | 20 | 0.0% |
| Haiti | 60 | 0.0% |
| Honduras | 609 | 0.2% |
| Hong Kong | 44 | 0.0% |
| Hungary | 35 | 0.0% |
| India | 1,999 | 0.6% |
| Indonesia | 68 | 0.0% |
| Iran | 283 | 0.1% |
| Iraq | 113 | 0.0% |
| Ireland | 64 | 0.0% |
| Israel | 99 | 0.0% |
| Italy | 117 | 0.0% |
| Jamaica | 123 | 0.0% |
| Japan | 316 | 0.1% |
| Jordan | 232 | 0.1% |
| Kenya | 38 | 0.0% |
| Korea | 1,380 | 0.4% |
| Kuwait | 21 | 0.0% |
| Laos | 68 | 0.0% |
| Latin America | 48,627 | 15.4% |
| Latvia | 10 | 0.0% |
| Lebanon | 181 | 0.1% |
| Lithuania | 1 | 0.0% |
| Malaysia | 8 | 0.0% |
| Mexico | 38,263 | 12.1% |
| Micronesia | 23 | 0.0% |
| Middle Africa | 14 | 0.0% |
| Morocco | 2 | 0.0% |
| Nepal | 278 | 0.1% |
| Netherlands | 134 | 0.0% |
| Nicaragua | 441 | 0.1% |
| Nigeria | 615 | 0.2% |
| Northern Africa | 604 | 0.2% |
| Northern Europe | 642 | 0.2% |
| Norway | 26 | 0.0% |
| Oceania | 263 | 0.1% |
| Pakistan | 747 | 0.2% |
| Panama | 143 | 0.1% |
| Peru | 801 | 0.3% |
| Philippines | 3,693 | 1.2% |
| Poland | 78 | 0.0% |
| Portugal | 50 | 0.0% |
| Romania | 227 | 0.1% |
| Russia | 62 | 0.0% |
| Saudi Arabia | 109 | 0.0% |
| Scotland | 6 | 0.0% |
| Serbia | 42 | 0.0% |
| Sierra Leone | 43 | 0.0% |
| Singapore | 22 | 0.0% |
| South Africa | 61 | 0.0% |
| South America | 2,992 | 0.9% |
| South Central Asia | 3,800 | 1.2% |
| South Eastern Asia | 6,637 | 2.1% |
| Southern Europe | 369 | 0.1% |
| Spain | 135 | 0.0% |
| Sri Lanka | 123 | 0.0% |
| Sudan | 35 | 0.0% |
| Sweden | 12 | 0.0% |
| Syria | 356 | 0.1% |
| Taiwan | 495 | 0.2% |
| Thailand | 127 | 0.0% |
| Trinidad and Tobago | 33 | 0.0% |
| Turkey | 272 | 0.1% |
| Uganda | 21 | 0.0% |
| Ukraine | 42 | 0.0% |
| Venezuela | 281 | 0.1% |
| Vietnam | 2,265 | 0.7% |
| Western Africa | 830 | 0.3% |
| Western Asia | 1,459 | 0.5% |
| Western Europe | 618 | 0.2% |
| Yemen | 4 | 0.0% |
| Zimbabwe | 37 | 0.0% | View All 117 Rows |
Sex and Age in Riverside
Sex and Age in Riverside
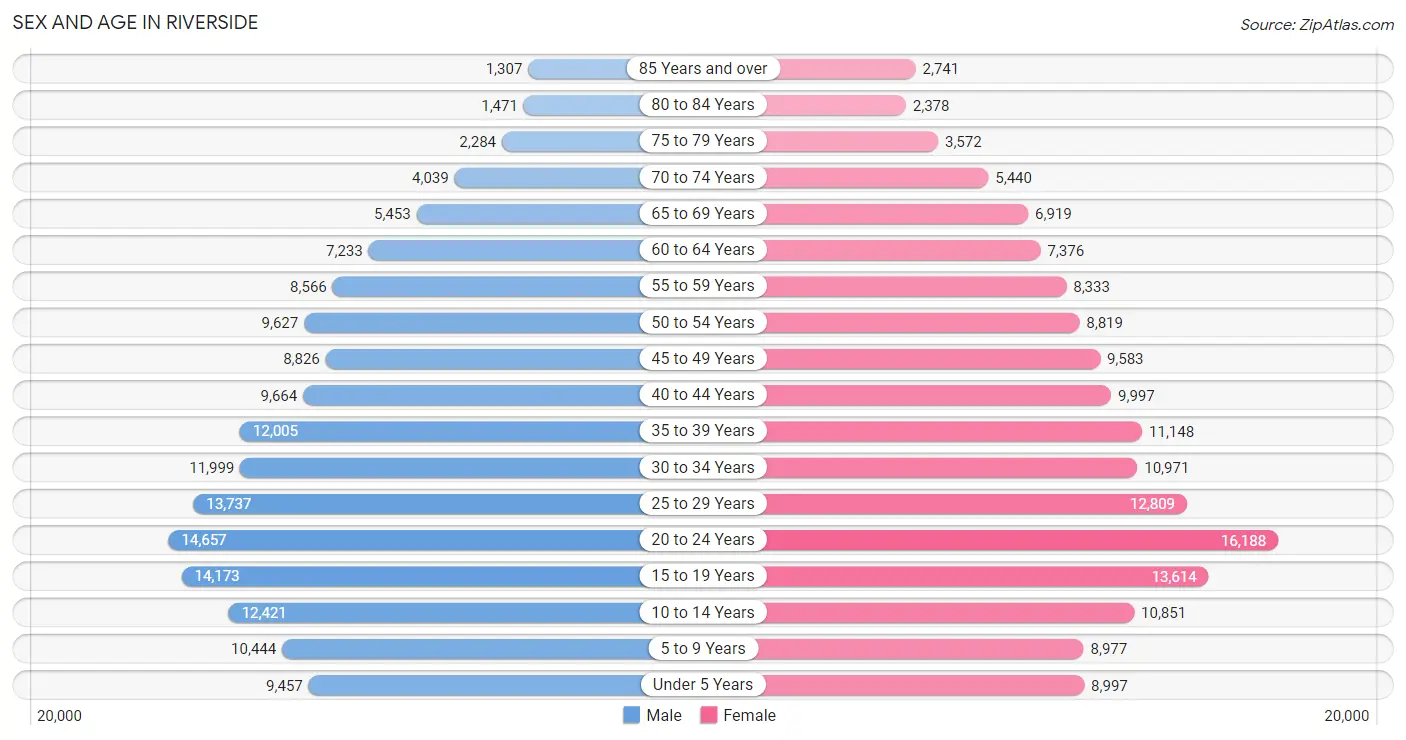
The most populous age groups in Riverside are 20 to 24 Years (14,657 | 9.3%) for men and 20 to 24 Years (16,188 | 10.2%) for women.
| Age Bracket | Male | Female |
| Under 5 Years | 9,457 (6.0%) | 8,997 (5.7%) |
| 5 to 9 Years | 10,444 (6.6%) | 8,977 (5.7%) |
| 10 to 14 Years | 12,421 (7.9%) | 10,851 (6.8%) |
| 15 to 19 Years | 14,173 (9.0%) | 13,614 (8.6%) |
| 20 to 24 Years | 14,657 (9.3%) | 16,188 (10.2%) |
| 25 to 29 Years | 13,737 (8.7%) | 12,809 (8.1%) |
| 30 to 34 Years | 11,999 (7.6%) | 10,971 (6.9%) |
| 35 to 39 Years | 12,005 (7.6%) | 11,148 (7.0%) |
| 40 to 44 Years | 9,664 (6.1%) | 9,997 (6.3%) |
| 45 to 49 Years | 8,826 (5.6%) | 9,583 (6.0%) |
| 50 to 54 Years | 9,627 (6.1%) | 8,819 (5.6%) |
| 55 to 59 Years | 8,566 (5.4%) | 8,333 (5.2%) |
| 60 to 64 Years | 7,233 (4.6%) | 7,376 (4.6%) |
| 65 to 69 Years | 5,453 (3.5%) | 6,919 (4.4%) |
| 70 to 74 Years | 4,039 (2.6%) | 5,440 (3.4%) |
| 75 to 79 Years | 2,284 (1.5%) | 3,572 (2.2%) |
| 80 to 84 Years | 1,471 (0.9%) | 2,378 (1.5%) |
| 85 Years and over | 1,307 (0.8%) | 2,741 (1.7%) |
| Total | 157,363 (100.0%) | 158,713 (100.0%) |
Families and Households in Riverside
Median Family Size in Riverside
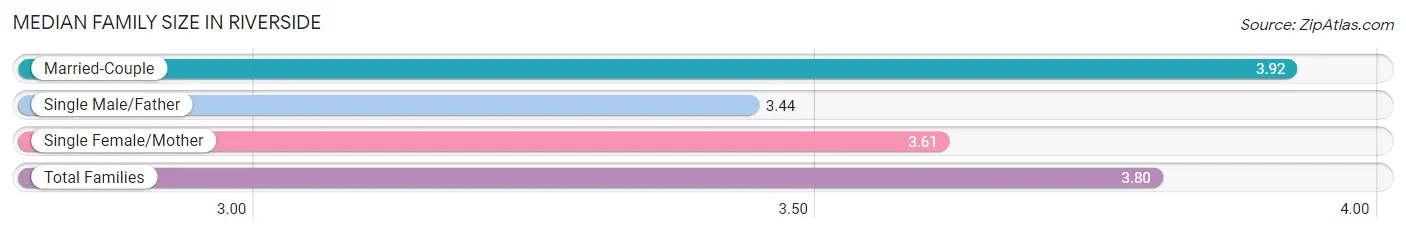
The median family size in Riverside is 3.80 persons per family, with married-couple families (45,538 | 68.2%) accounting for the largest median family size of 3.92 persons per family. On the other hand, single male/father families (6,548 | 9.8%) represent the smallest median family size with 3.44 persons per family.
| Family Type | # Families | Family Size |
| Married-Couple | 45,538 (68.2%) | 3.92 |
| Single Male/Father | 6,548 (9.8%) | 3.44 |
| Single Female/Mother | 14,690 (22.0%) | 3.61 |
| Total Families | 66,776 (100.0%) | 3.80 |
Median Household Size in Riverside
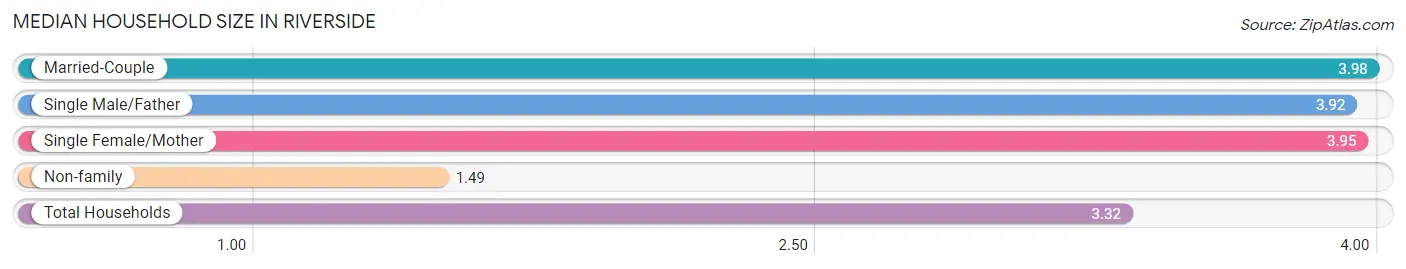
The median household size in Riverside is 3.32 persons per household, with married-couple households (45,538 | 50.3%) accounting for the largest median household size of 3.98 persons per household. non-family households (23,764 | 26.3%) represent the smallest median household size with 1.49 persons per household.
| Household Type | # Households | Household Size |
| Married-Couple | 45,538 (50.3%) | 3.98 |
| Single Male/Father | 6,548 (7.2%) | 3.92 |
| Single Female/Mother | 14,690 (16.2%) | 3.95 |
| Non-family | 23,764 (26.3%) | 1.49 |
| Total Households | 90,540 (100.0%) | 3.32 |
Household Size by Marriage Status in Riverside
Out of a total of 90,540 households in Riverside, 66,776 (73.8%) are family households, while 23,764 (26.3%) are nonfamily households. The most numerous type of family households are 2-person households, comprising 19,457, and the most common type of nonfamily households are 1-person households, comprising 16,846.
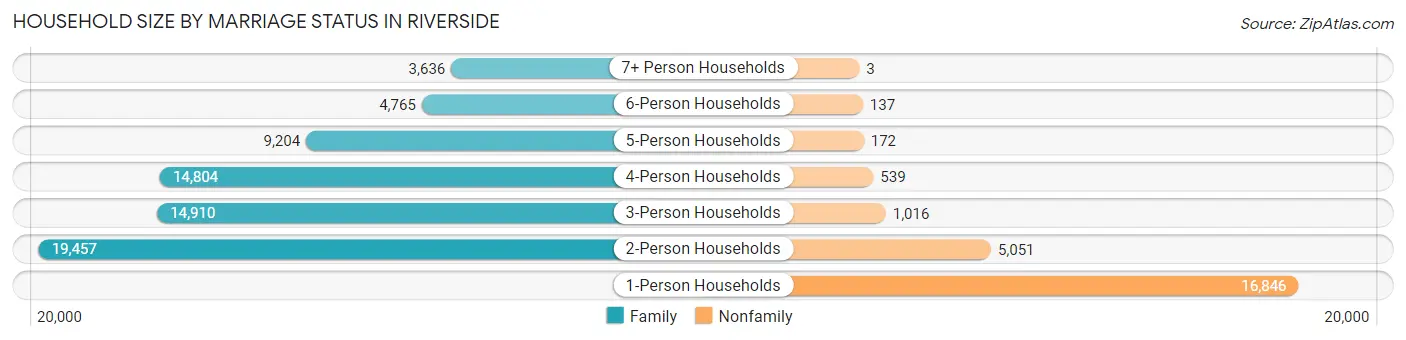
| Household Size | Family Households | Nonfamily Households |
| 1-Person Households | - | 16,846 (18.6%) |
| 2-Person Households | 19,457 (21.5%) | 5,051 (5.6%) |
| 3-Person Households | 14,910 (16.5%) | 1,016 (1.1%) |
| 4-Person Households | 14,804 (16.4%) | 539 (0.6%) |
| 5-Person Households | 9,204 (10.2%) | 172 (0.2%) |
| 6-Person Households | 4,765 (5.3%) | 137 (0.2%) |
| 7+ Person Households | 3,636 (4.0%) | 3 (0.0%) |
| Total | 66,776 (73.8%) | 23,764 (26.3%) |
Female Fertility in Riverside
Fertility by Age in Riverside
Average fertility rate in Riverside is 41.0 births per 1,000 women. Women in the age bracket of 20 to 34 years have the highest fertility rate with 56.0 births per 1,000 women. Women in the age bracket of 20 to 34 years acount for 63.2% of all women with births.
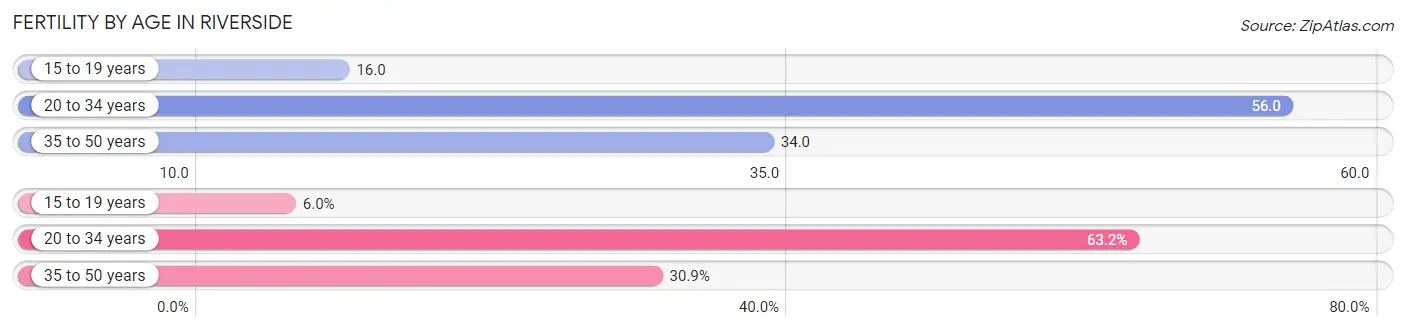
| Age Bracket | Women with Births | Births / 1,000 Women |
| 15 to 19 years | 212 (6.0%) | 16.0 |
| 20 to 34 years | 2,249 (63.2%) | 56.0 |
| 35 to 50 years | 1,098 (30.8%) | 34.0 |
| Total | 3,559 (100.0%) | 41.0 |
Fertility by Age by Marriage Status in Riverside
56.4% of women with births (3,559) in Riverside are married. The highest percentage of unmarried women with births falls into 15 to 19 years age bracket with 100.0% of them unmarried at the time of birth, while the lowest percentage of unmarried women with births belong to 35 to 50 years age bracket with 33.8% of them unmarried.
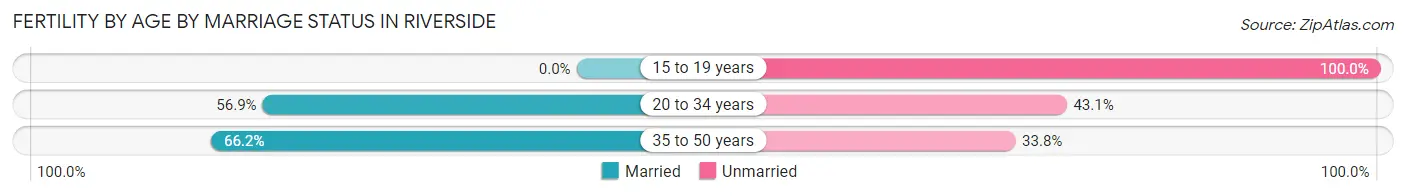
| Age Bracket | Married | Unmarried |
| 15 to 19 years | 0 (0.0%) | 212 (100.0%) |
| 20 to 34 years | 1,280 (56.9%) | 969 (43.1%) |
| 35 to 50 years | 727 (66.2%) | 371 (33.8%) |
| Total | 2,007 (56.4%) | 1,552 (43.6%) |
Fertility by Education in Riverside
Average fertility rate in Riverside is 41.0 births per 1,000 women. Women with the education attainment of graduate degree have the highest fertility rate of 83.0 births per 1,000 women, while women with the education attainment of less than high school have the lowest fertility at 24.0 births per 1,000 women. Women with the education attainment of high school diploma represent 32.4% of all women with births.
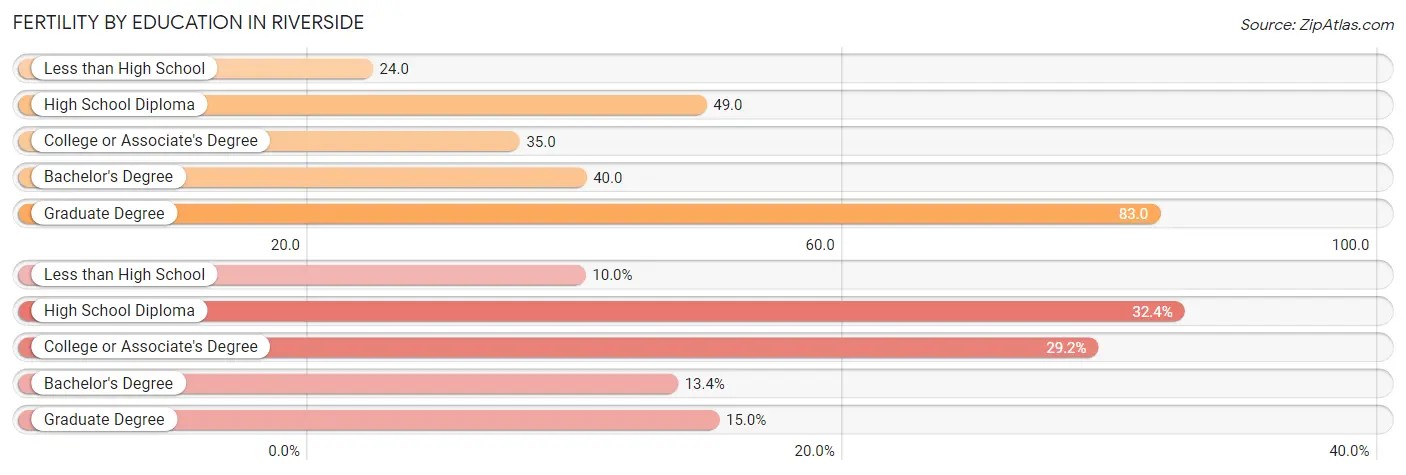
| Educational Attainment | Women with Births | Births / 1,000 Women |
| Less than High School | 355 (10.0%) | 24.0 |
| High School Diploma | 1,154 (32.4%) | 49.0 |
| College or Associate's Degree | 1,039 (29.2%) | 35.0 |
| Bachelor's Degree | 478 (13.4%) | 40.0 |
| Graduate Degree | 533 (15.0%) | 83.0 |
| Total | 3,559 (100.0%) | 41.0 |
Fertility by Education by Marriage Status in Riverside
43.6% of women with births in Riverside are unmarried. Women with the educational attainment of bachelor's degree are most likely to be married with 71.1% of them married at childbirth, while women with the educational attainment of high school diploma are least likely to be married with 63.3% of them unmarried at childbirth.
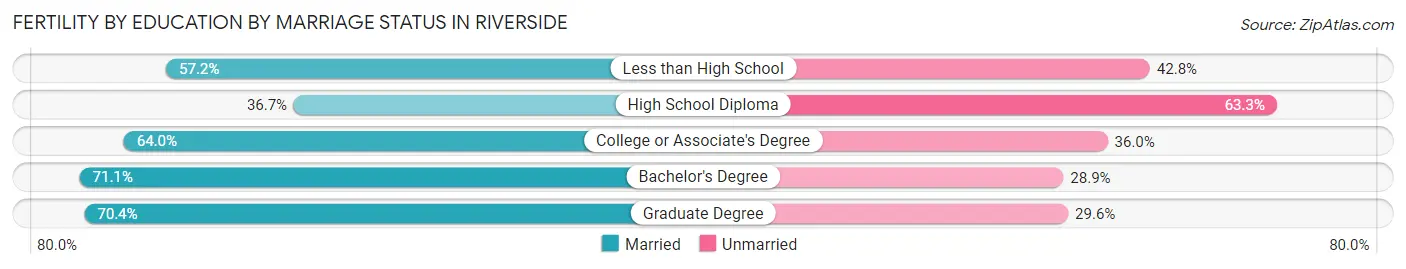
| Educational Attainment | Married | Unmarried |
| Less than High School | 203 (57.2%) | 152 (42.8%) |
| High School Diploma | 424 (36.7%) | 730 (63.3%) |
| College or Associate's Degree | 665 (64.0%) | 374 (36.0%) |
| Bachelor's Degree | 340 (71.1%) | 138 (28.9%) |
| Graduate Degree | 375 (70.4%) | 158 (29.6%) |
| Total | 2,007 (56.4%) | 1,552 (43.6%) |
Employment Characteristics in Riverside
Employment by Class of Employer in Riverside
Among the 146,251 employed individuals in Riverside, private company employees (101,672 | 69.5%), local government employees (13,126 | 9.0%), and not-for-profit organizations (8,750 | 6.0%) make up the most common classes of employment.
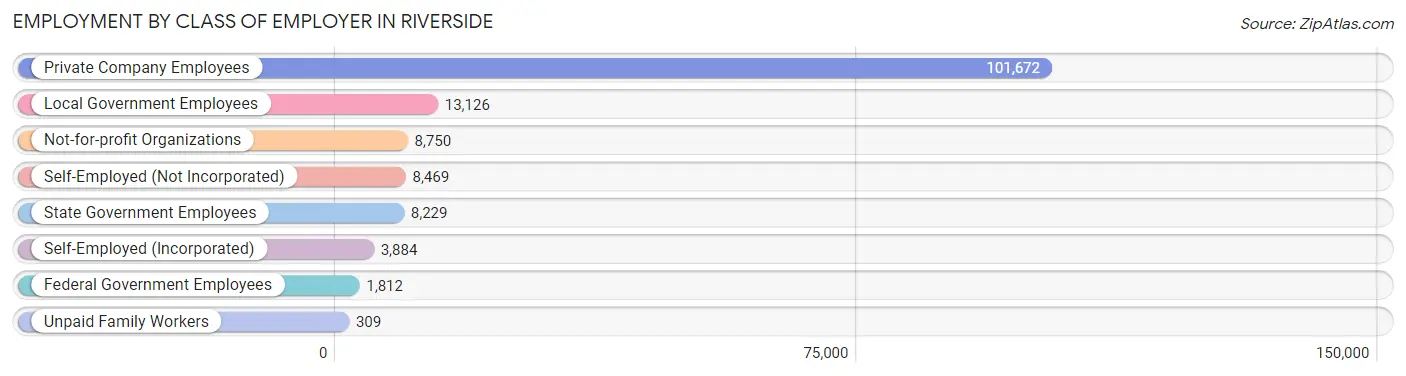
| Employer Class | # Employees | % Employees |
| Private Company Employees | 101,672 | 69.5% |
| Self-Employed (Incorporated) | 3,884 | 2.7% |
| Self-Employed (Not Incorporated) | 8,469 | 5.8% |
| Not-for-profit Organizations | 8,750 | 6.0% |
| Local Government Employees | 13,126 | 9.0% |
| State Government Employees | 8,229 | 5.6% |
| Federal Government Employees | 1,812 | 1.2% |
| Unpaid Family Workers | 309 | 0.2% |
| Total | 146,251 | 100.0% |
Employment Status by Age in Riverside
According to the labor force statistics for Riverside, out of the total population over 16 years of age (250,285), 64.0% or 160,182 individuals are in the labor force, with 6.1% or 9,771 of them unemployed. The age group with the highest labor force participation rate is 35 to 44 years, with 83.4% or 35,707 individuals in the labor force. Within the labor force, the 16 to 19 years age range has the highest percentage of unemployed individuals, with 13.9% or 917 of them being unemployed.
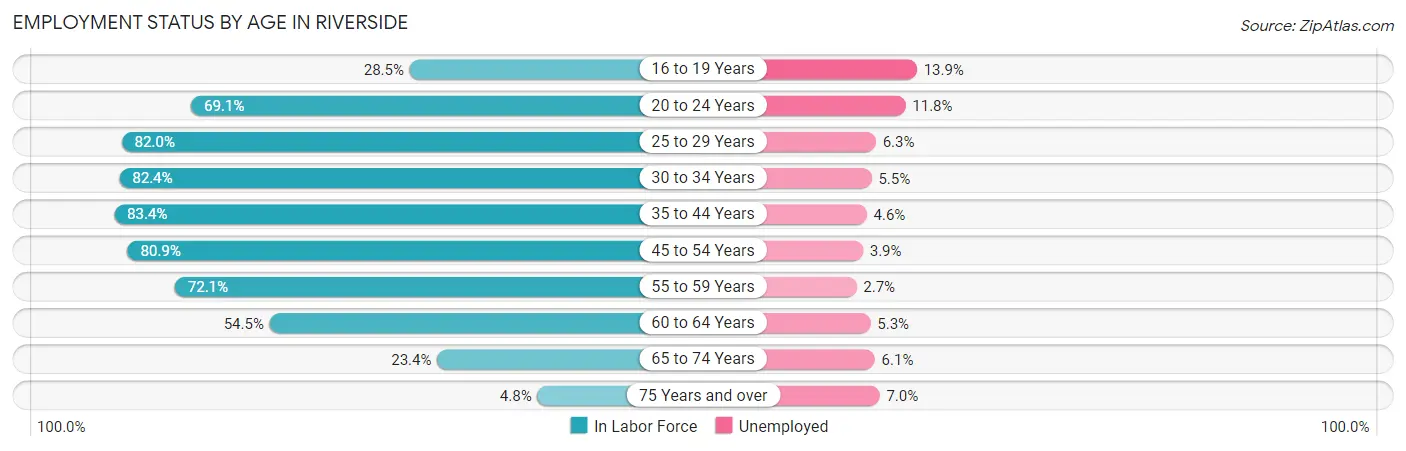
| Age Bracket | In Labor Force | Unemployed |
| 16 to 19 Years | 6,596 (28.5%) | 917 (13.9%) |
| 20 to 24 Years | 21,314 (69.1%) | 2,515 (11.8%) |
| 25 to 29 Years | 21,768 (82.0%) | 1,371 (6.3%) |
| 30 to 34 Years | 18,927 (82.4%) | 1,041 (5.5%) |
| 35 to 44 Years | 35,707 (83.4%) | 1,643 (4.6%) |
| 45 to 54 Years | 29,816 (80.9%) | 1,163 (3.9%) |
| 55 to 59 Years | 12,184 (72.1%) | 329 (2.7%) |
| 60 to 64 Years | 7,962 (54.5%) | 422 (5.3%) |
| 65 to 74 Years | 5,113 (23.4%) | 312 (6.1%) |
| 75 Years and over | 660 (4.8%) | 46 (7.0%) |
| Total | 160,182 (64.0%) | 9,771 (6.1%) |
Employment Status by Educational Attainment in Riverside
According to labor force statistics for Riverside, 78.6% of individuals (126,305) out of the total population between 25 and 64 years of age (160,693) are in the labor force, with 4.7% or 5,936 of them being unemployed. The group with the highest labor force participation rate are those with the educational attainment of bachelor's degree or higher, with 86.2% or 33,059 individuals in the labor force. Within the labor force, individuals with high school diploma education have the highest percentage of unemployment, with 5.7% or 2,028 of them being unemployed.
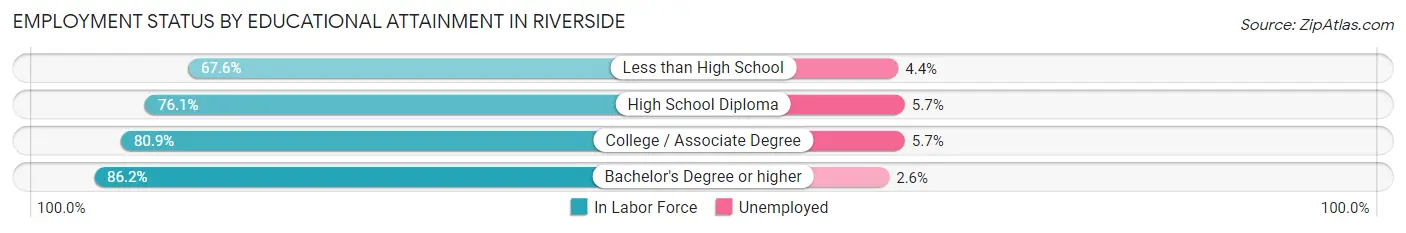
| Educational Attainment | In Labor Force | Unemployed |
| Less than High School | 17,514 (67.6%) | 1,140 (4.4%) |
| High School Diploma | 35,577 (76.1%) | 2,665 (5.7%) |
| College / Associate Degree | 40,194 (80.9%) | 2,832 (5.7%) |
| Bachelor's Degree or higher | 33,059 (86.2%) | 997 (2.6%) |
| Total | 126,305 (78.6%) | 7,553 (4.7%) |
Employment Occupations by Sex in Riverside
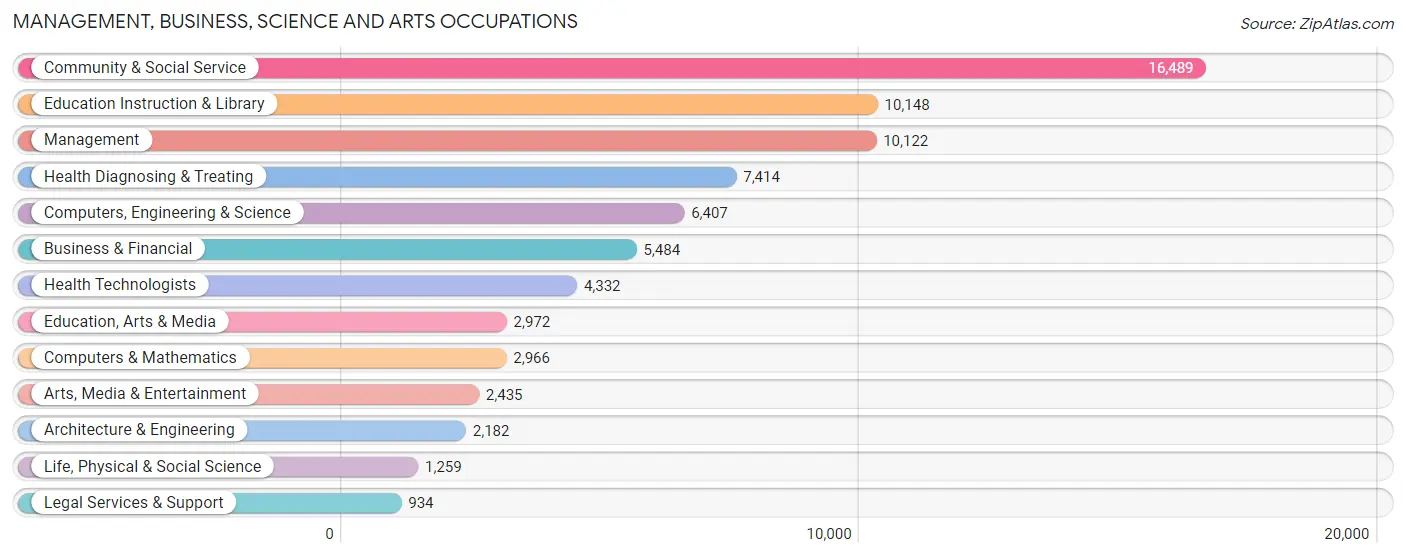
Management, Business, Science and Arts Occupations
The most common Management, Business, Science and Arts occupations in Riverside are Community & Social Service (16,489 | 11.0%), Education Instruction & Library (10,148 | 6.8%), Management (10,122 | 6.7%), Health Diagnosing & Treating (7,414 | 4.9%), and Computers, Engineering & Science (6,407 | 4.3%).
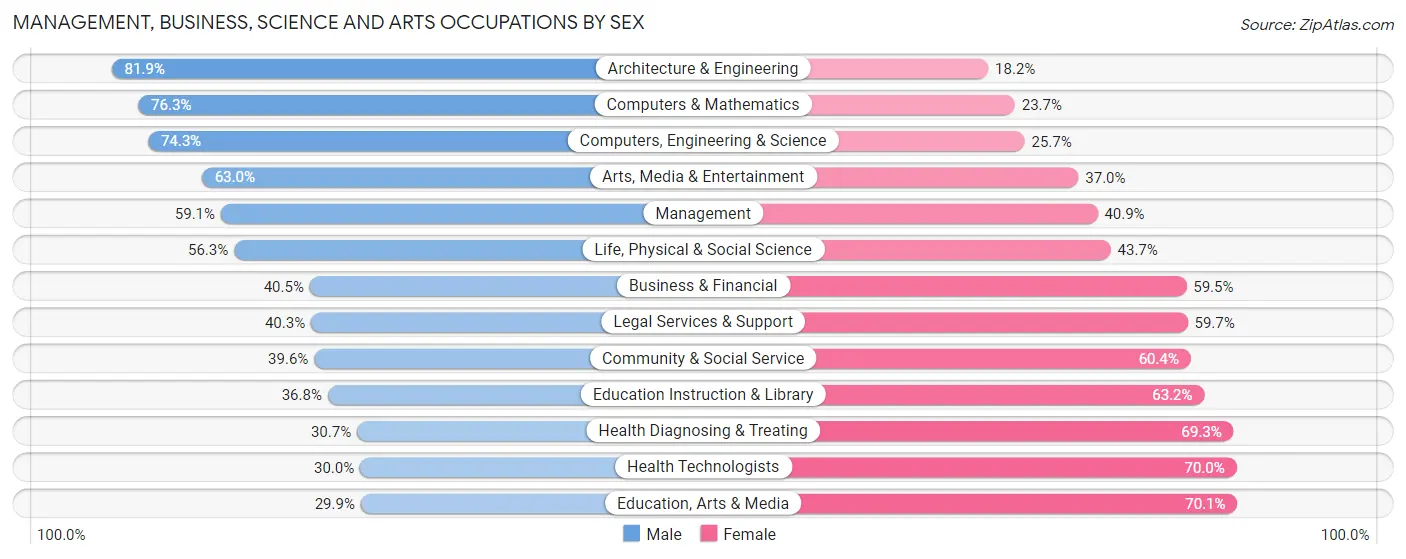
Management, Business, Science and Arts Occupations by Sex
Within the Management, Business, Science and Arts occupations in Riverside, the most male-oriented occupations are Architecture & Engineering (81.9%), Computers & Mathematics (76.3%), and Computers, Engineering & Science (74.3%), while the most female-oriented occupations are Education, Arts & Media (70.1%), Health Technologists (70.0%), and Health Diagnosing & Treating (69.3%).
| Occupation | Male | Female |
| Management | 5,978 (59.1%) | 4,144 (40.9%) |
| Business & Financial | 2,222 (40.5%) | 3,262 (59.5%) |
| Computers, Engineering & Science | 4,758 (74.3%) | 1,649 (25.7%) |
| Computers & Mathematics | 2,263 (76.3%) | 703 (23.7%) |
| Architecture & Engineering | 1,786 (81.9%) | 396 (18.1%) |
| Life, Physical & Social Science | 709 (56.3%) | 550 (43.7%) |
| Community & Social Service | 6,529 (39.6%) | 9,960 (60.4%) |
| Education, Arts & Media | 888 (29.9%) | 2,084 (70.1%) |
| Legal Services & Support | 376 (40.3%) | 558 (59.7%) |
| Education Instruction & Library | 3,730 (36.8%) | 6,418 (63.2%) |
| Arts, Media & Entertainment | 1,535 (63.0%) | 900 (37.0%) |
| Health Diagnosing & Treating | 2,273 (30.7%) | 5,141 (69.3%) |
| Health Technologists | 1,301 (30.0%) | 3,031 (70.0%) |
| Total (Category) | 21,760 (47.4%) | 24,156 (52.6%) |
| Total (Overall) | 81,360 (54.2%) | 68,762 (45.8%) |
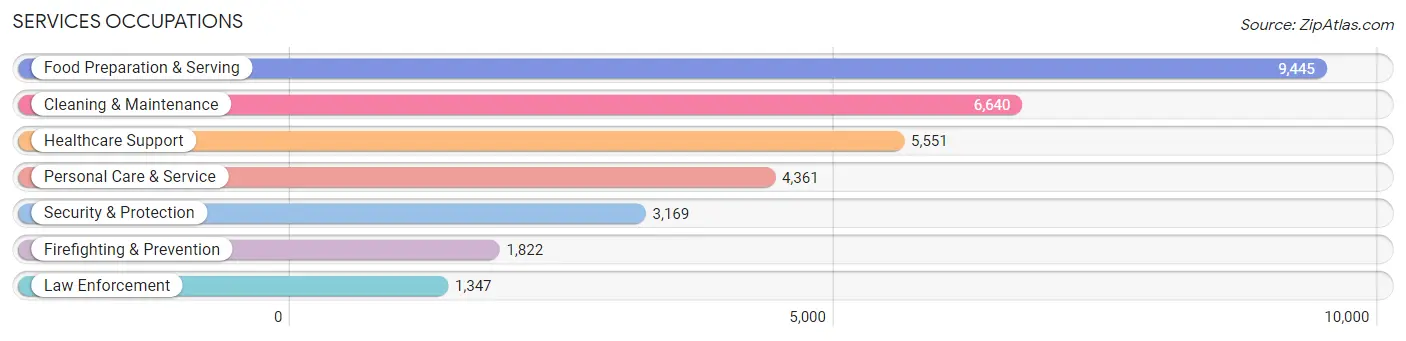
Services Occupations
The most common Services occupations in Riverside are Food Preparation & Serving (9,445 | 6.3%), Cleaning & Maintenance (6,640 | 4.4%), Healthcare Support (5,551 | 3.7%), Personal Care & Service (4,361 | 2.9%), and Security & Protection (3,169 | 2.1%).
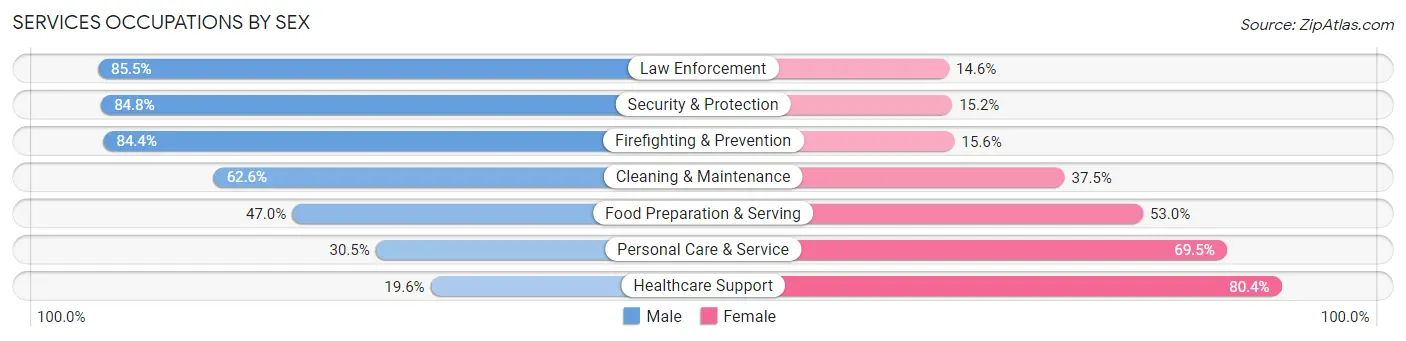
Services Occupations by Sex
Within the Services occupations in Riverside, the most male-oriented occupations are Law Enforcement (85.5%), Security & Protection (84.8%), and Firefighting & Prevention (84.4%), while the most female-oriented occupations are Healthcare Support (80.4%), Personal Care & Service (69.5%), and Food Preparation & Serving (53.0%).
| Occupation | Male | Female |
| Healthcare Support | 1,090 (19.6%) | 4,461 (80.4%) |
| Security & Protection | 2,688 (84.8%) | 481 (15.2%) |
| Firefighting & Prevention | 1,537 (84.4%) | 285 (15.6%) |
| Law Enforcement | 1,151 (85.5%) | 196 (14.5%) |
| Food Preparation & Serving | 4,443 (47.0%) | 5,002 (53.0%) |
| Cleaning & Maintenance | 4,153 (62.5%) | 2,487 (37.4%) |
| Personal Care & Service | 1,330 (30.5%) | 3,031 (69.5%) |
| Total (Category) | 13,704 (47.0%) | 15,462 (53.0%) |
| Total (Overall) | 81,360 (54.2%) | 68,762 (45.8%) |
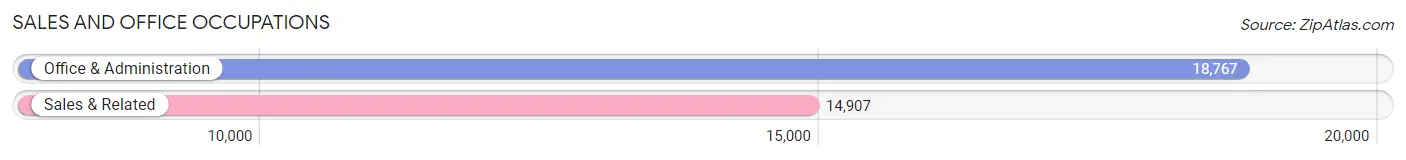
Sales and Office Occupations
The most common Sales and Office occupations in Riverside are Office & Administration (18,767 | 12.5%), and Sales & Related (14,907 | 9.9%).
Sales and Office Occupations by Sex
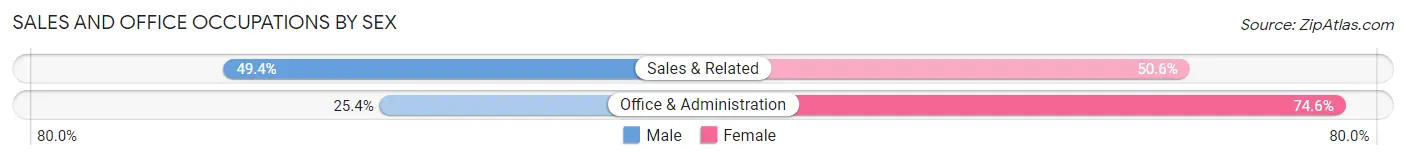
| Occupation | Male | Female |
| Sales & Related | 7,364 (49.4%) | 7,543 (50.6%) |
| Office & Administration | 4,766 (25.4%) | 14,001 (74.6%) |
| Total (Category) | 12,130 (36.0%) | 21,544 (64.0%) |
| Total (Overall) | 81,360 (54.2%) | 68,762 (45.8%) |
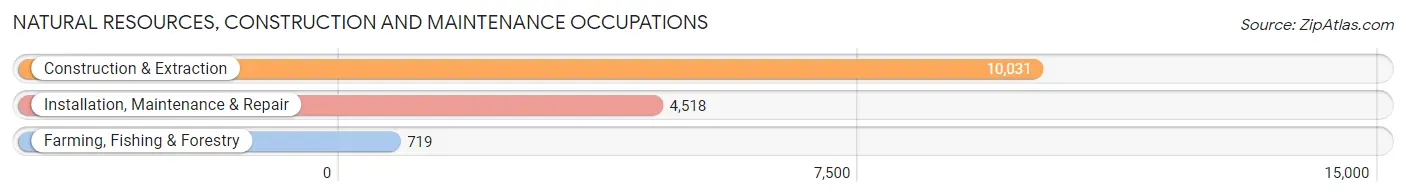
Natural Resources, Construction and Maintenance Occupations
The most common Natural Resources, Construction and Maintenance occupations in Riverside are Construction & Extraction (10,031 | 6.7%), Installation, Maintenance & Repair (4,518 | 3.0%), and Farming, Fishing & Forestry (719 | 0.5%).
Natural Resources, Construction and Maintenance Occupations by Sex
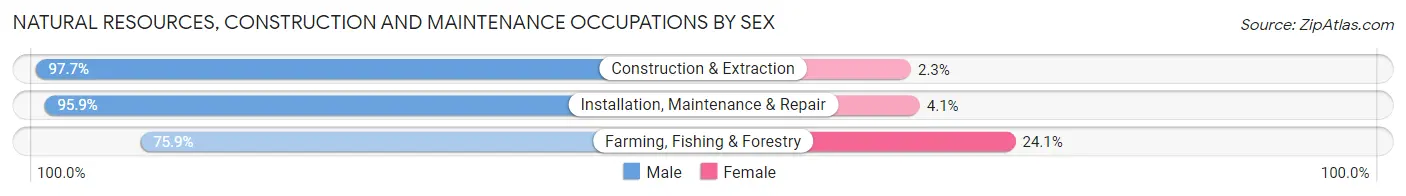
| Occupation | Male | Female |
| Farming, Fishing & Forestry | 546 (75.9%) | 173 (24.1%) |
| Construction & Extraction | 9,799 (97.7%) | 232 (2.3%) |
| Installation, Maintenance & Repair | 4,331 (95.9%) | 187 (4.1%) |
| Total (Category) | 14,676 (96.1%) | 592 (3.9%) |
| Total (Overall) | 81,360 (54.2%) | 68,762 (45.8%) |
Production, Transportation and Moving Occupations
The most common Production, Transportation and Moving occupations in Riverside are Material Moving (10,080 | 6.7%), Production (10,030 | 6.7%), and Transportation (5,988 | 4.0%).
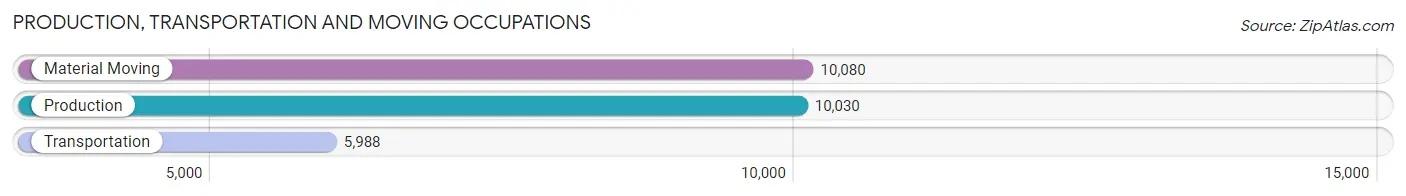
Production, Transportation and Moving Occupations by Sex
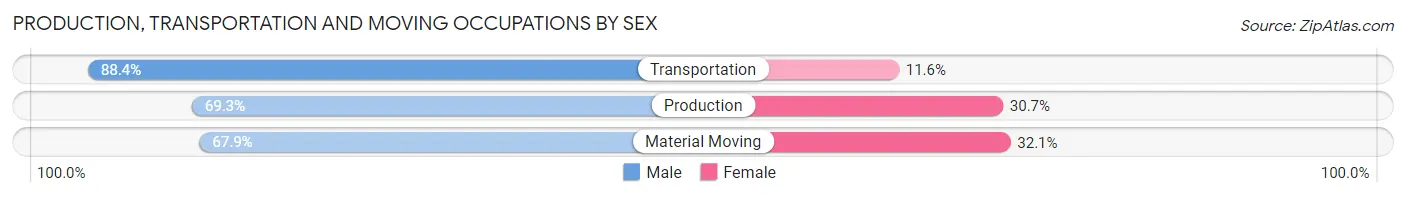
| Occupation | Male | Female |
| Production | 6,951 (69.3%) | 3,079 (30.7%) |
| Transportation | 5,293 (88.4%) | 695 (11.6%) |
| Material Moving | 6,846 (67.9%) | 3,234 (32.1%) |
| Total (Category) | 19,090 (73.2%) | 7,008 (26.9%) |
| Total (Overall) | 81,360 (54.2%) | 68,762 (45.8%) |
Employment Industries by Sex in Riverside
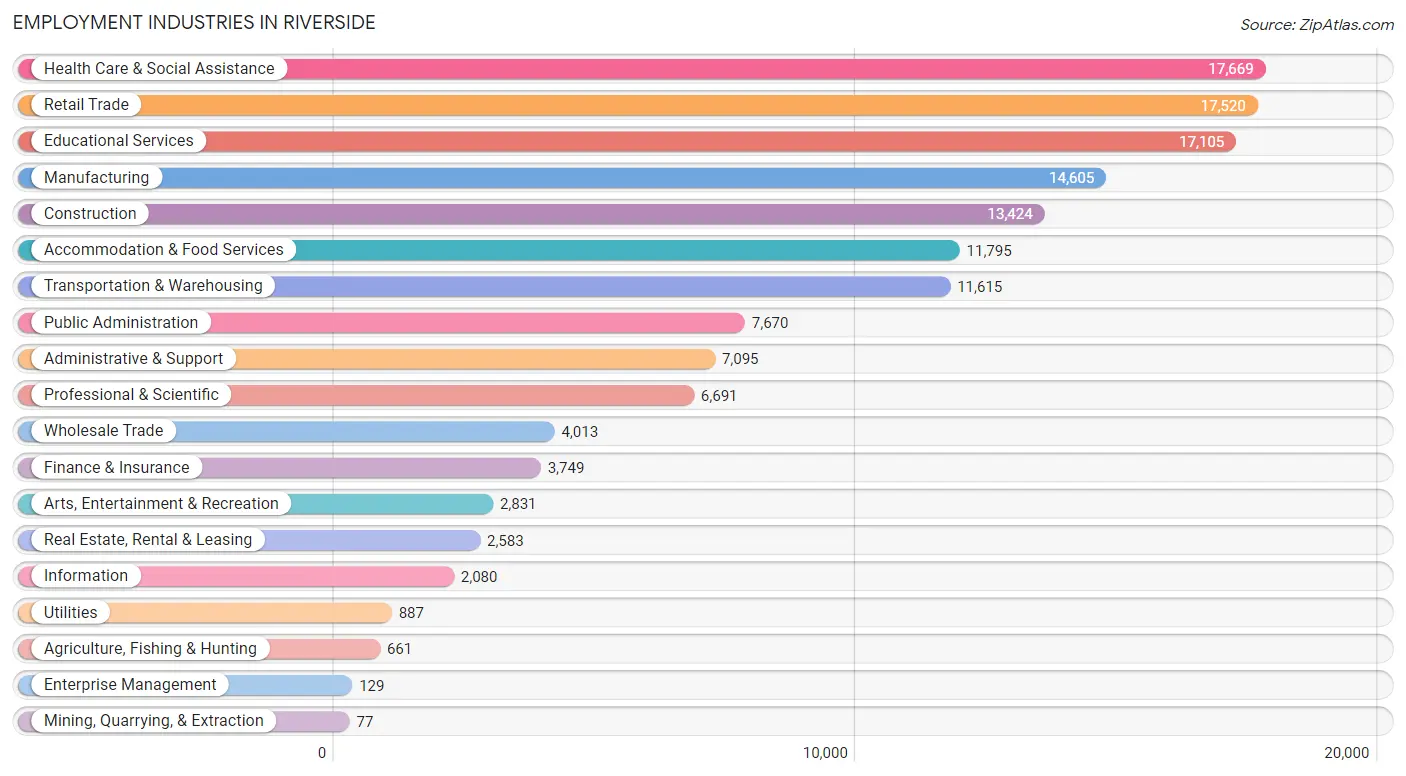
Employment Industries in Riverside
The major employment industries in Riverside include Health Care & Social Assistance (17,669 | 11.8%), Retail Trade (17,520 | 11.7%), Educational Services (17,105 | 11.4%), Manufacturing (14,605 | 9.7%), and Construction (13,424 | 8.9%).
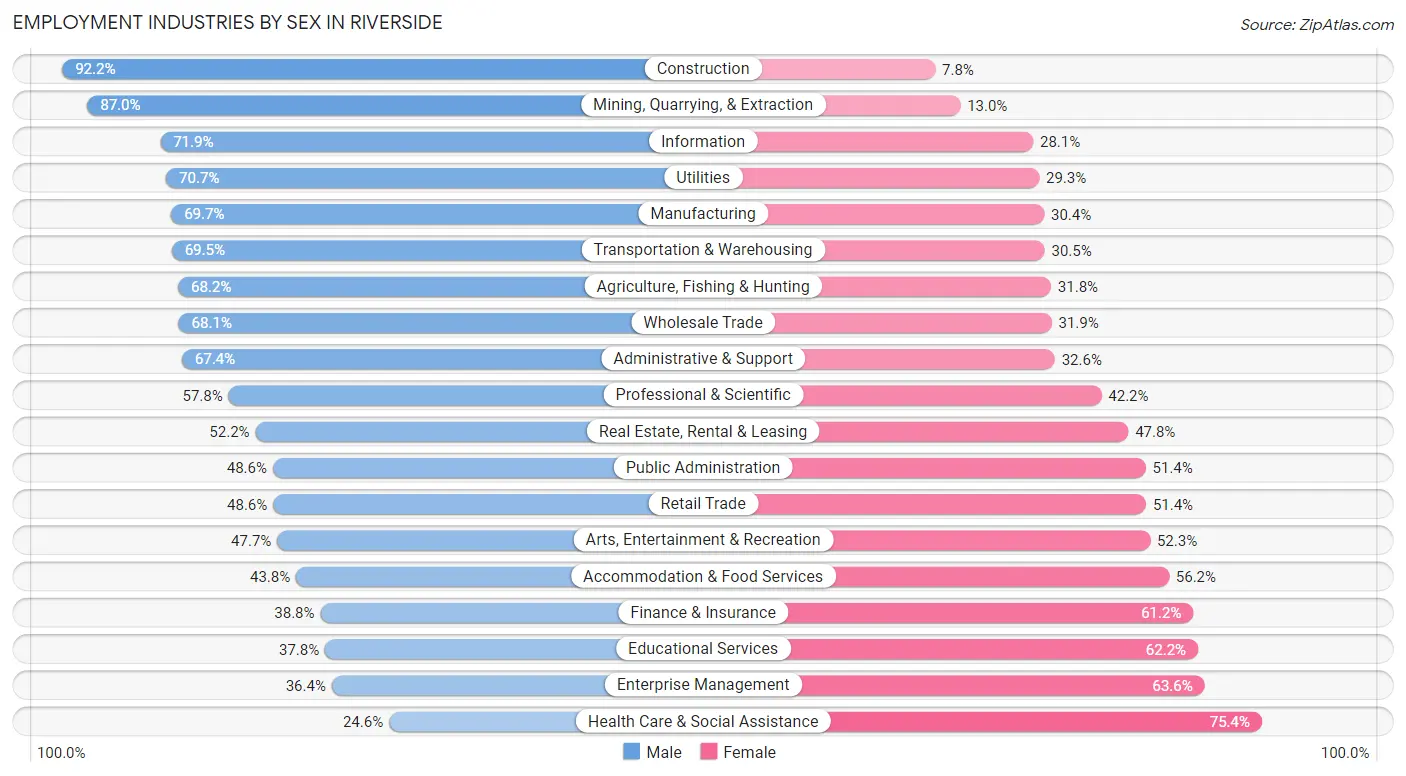
Employment Industries by Sex in Riverside
The Riverside industries that see more men than women are Construction (92.2%), Mining, Quarrying, & Extraction (87.0%), and Information (71.9%), whereas the industries that tend to have a higher number of women are Health Care & Social Assistance (75.4%), Enterprise Management (63.6%), and Educational Services (62.2%).
| Industry | Male | Female |
| Agriculture, Fishing & Hunting | 451 (68.2%) | 210 (31.8%) |
| Mining, Quarrying, & Extraction | 67 (87.0%) | 10 (13.0%) |
| Construction | 12,377 (92.2%) | 1,047 (7.8%) |
| Manufacturing | 10,172 (69.7%) | 4,433 (30.3%) |
| Wholesale Trade | 2,733 (68.1%) | 1,280 (31.9%) |
| Retail Trade | 8,508 (48.6%) | 9,012 (51.4%) |
| Transportation & Warehousing | 8,077 (69.5%) | 3,538 (30.5%) |
| Utilities | 627 (70.7%) | 260 (29.3%) |
| Information | 1,496 (71.9%) | 584 (28.1%) |
| Finance & Insurance | 1,454 (38.8%) | 2,295 (61.2%) |
| Real Estate, Rental & Leasing | 1,349 (52.2%) | 1,234 (47.8%) |
| Professional & Scientific | 3,867 (57.8%) | 2,824 (42.2%) |
| Enterprise Management | 47 (36.4%) | 82 (63.6%) |
| Administrative & Support | 4,785 (67.4%) | 2,310 (32.6%) |
| Educational Services | 6,467 (37.8%) | 10,638 (62.2%) |
| Health Care & Social Assistance | 4,343 (24.6%) | 13,326 (75.4%) |
| Arts, Entertainment & Recreation | 1,351 (47.7%) | 1,480 (52.3%) |
| Accommodation & Food Services | 5,168 (43.8%) | 6,627 (56.2%) |
| Public Administration | 3,730 (48.6%) | 3,940 (51.4%) |
| Total | 81,360 (54.2%) | 68,762 (45.8%) |
Education in Riverside
School Enrollment in Riverside
The most common levels of schooling among the 97,961 students in Riverside are college / undergraduate (33,056 | 33.7%), high school (19,485 | 19.9%), and middle school (17,416 | 17.8%).
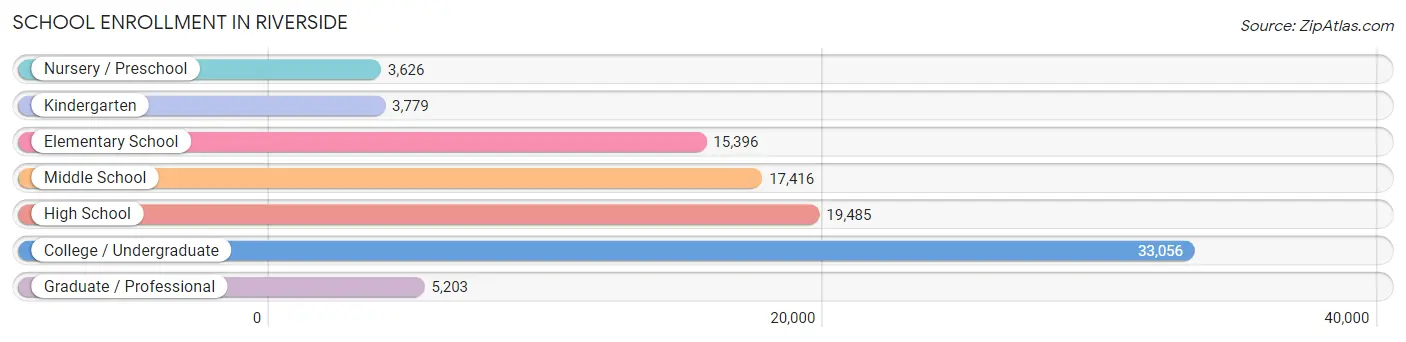
| School Level | # Students | % Students |
| Nursery / Preschool | 3,626 | 3.7% |
| Kindergarten | 3,779 | 3.9% |
| Elementary School | 15,396 | 15.7% |
| Middle School | 17,416 | 17.8% |
| High School | 19,485 | 19.9% |
| College / Undergraduate | 33,056 | 33.7% |
| Graduate / Professional | 5,203 | 5.3% |
| Total | 97,961 | 100.0% |
School Enrollment by Age by Funding Source in Riverside
Out of a total of 97,961 students who are enrolled in schools in Riverside, 13,519 (13.8%) attend a private institution, while the remaining 84,442 (86.2%) are enrolled in public schools. The age group of 3 to 4 year olds has the highest likelihood of being enrolled in private schools, with 1,269 (42.3% in the age bracket) enrolled. Conversely, the age group of 15 to 17 year olds has the lowest likelihood of being enrolled in a private school, with 12,634 (95.7% in the age bracket) attending a public institution.
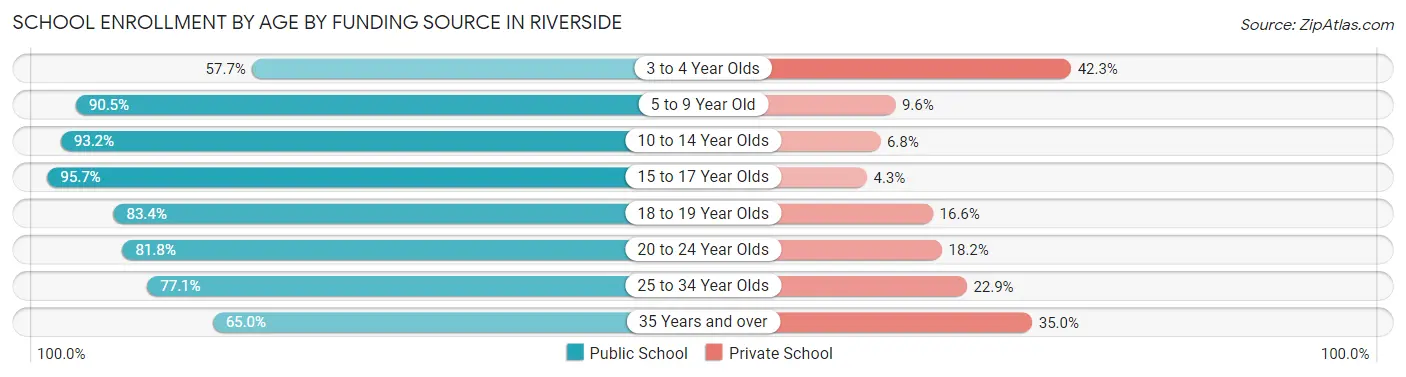
| Age Bracket | Public School | Private School |
| 3 to 4 Year Olds | 1,732 (57.7%) | 1,269 (42.3%) |
| 5 to 9 Year Old | 16,464 (90.4%) | 1,739 (9.6%) |
| 10 to 14 Year Olds | 21,077 (93.2%) | 1,527 (6.8%) |
| 15 to 17 Year Olds | 12,634 (95.7%) | 562 (4.3%) |
| 18 to 19 Year Olds | 9,664 (83.4%) | 1,920 (16.6%) |
| 20 to 24 Year Olds | 13,489 (81.8%) | 3,010 (18.2%) |
| 25 to 34 Year Olds | 6,337 (77.1%) | 1,879 (22.9%) |
| 35 Years and over | 3,026 (65.0%) | 1,632 (35.0%) |
| Total | 84,442 (86.2%) | 13,519 (13.8%) |
Educational Attainment by Field of Study in Riverside
Business (9,359 | 18.3%), social sciences (5,096 | 10.0%), science & technology (4,273 | 8.4%), education (3,877 | 7.6%), and liberal arts & history (3,823 | 7.5%) are the most common fields of study among 51,075 individuals in Riverside who have obtained a bachelor's degree or higher.
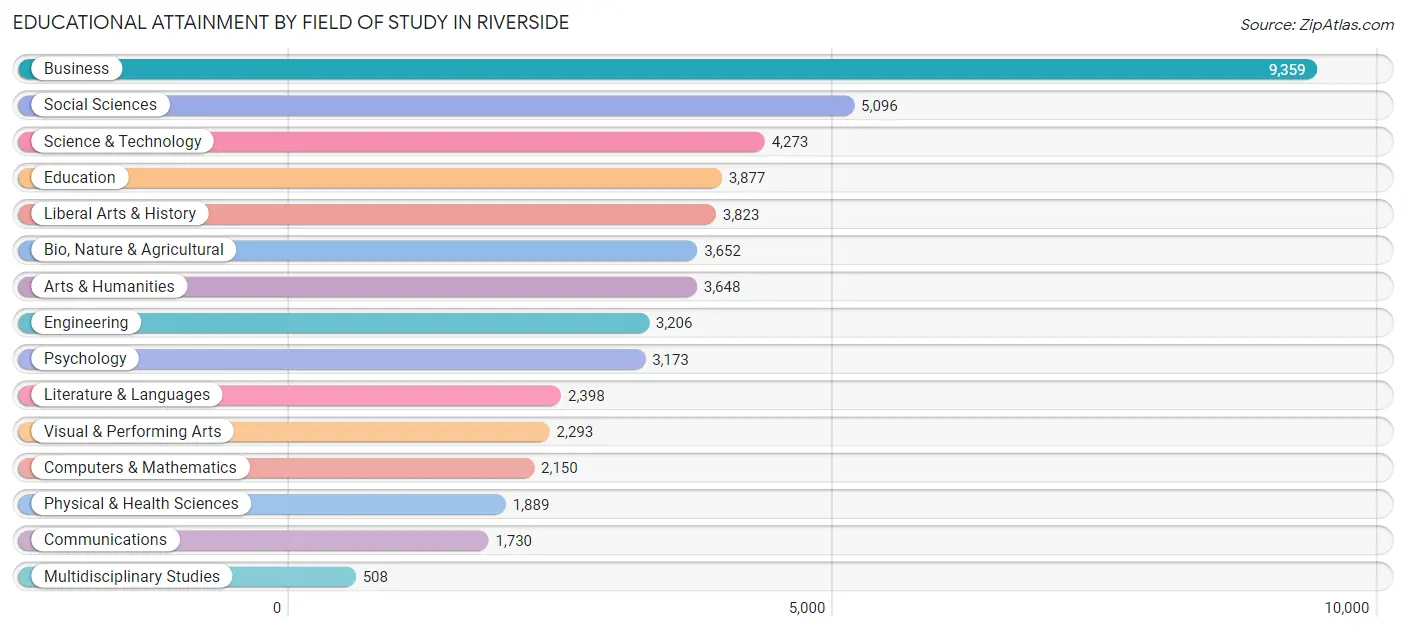
| Field of Study | # Graduates | % Graduates |
| Computers & Mathematics | 2,150 | 4.2% |
| Bio, Nature & Agricultural | 3,652 | 7.1% |
| Physical & Health Sciences | 1,889 | 3.7% |
| Psychology | 3,173 | 6.2% |
| Social Sciences | 5,096 | 10.0% |
| Engineering | 3,206 | 6.3% |
| Multidisciplinary Studies | 508 | 1.0% |
| Science & Technology | 4,273 | 8.4% |
| Business | 9,359 | 18.3% |
| Education | 3,877 | 7.6% |
| Literature & Languages | 2,398 | 4.7% |
| Liberal Arts & History | 3,823 | 7.5% |
| Visual & Performing Arts | 2,293 | 4.5% |
| Communications | 1,730 | 3.4% |
| Arts & Humanities | 3,648 | 7.1% |
| Total | 51,075 | 100.0% |
Transportation & Commute in Riverside
Vehicle Availability by Sex in Riverside
The most prevalent vehicle ownership categories in Riverside are males with 2 vehicles (26,930, accounting for 34.3%) and females with 2 vehicles (21,087, making up 42.4%).
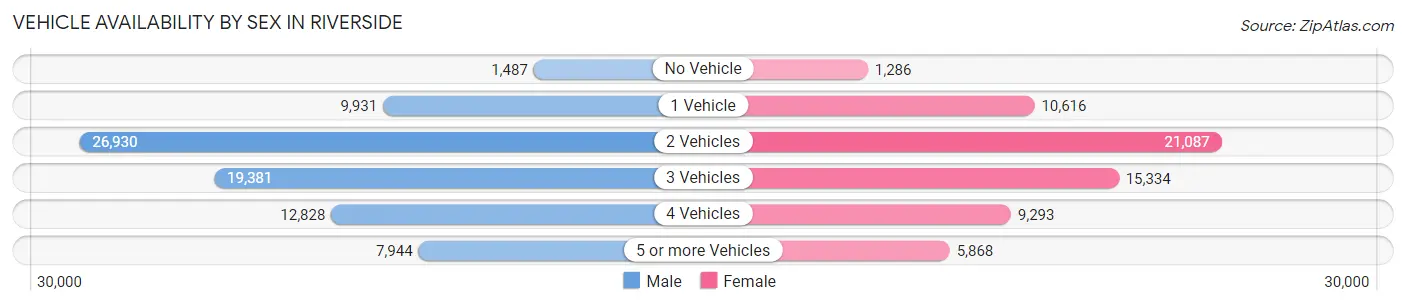
| Vehicles Available | Male | Female |
| No Vehicle | 1,487 (1.9%) | 1,286 (2.0%) |
| 1 Vehicle | 9,931 (12.7%) | 10,616 (16.7%) |
| 2 Vehicles | 26,930 (34.3%) | 21,087 (33.2%) |
| 3 Vehicles | 19,381 (24.7%) | 15,334 (24.1%) |
| 4 Vehicles | 12,828 (16.3%) | 9,293 (14.6%) |
| 5 or more Vehicles | 7,944 (10.1%) | 5,868 (9.2%) |
| Total | 78,501 (100.0%) | 63,484 (100.0%) |
Commute Time in Riverside
The most frequently occuring commute durations in Riverside are 30 to 34 minutes (21,104 commuters, 15.7%), 20 to 24 minutes (19,972 commuters, 14.9%), and 15 to 19 minutes (17,921 commuters, 13.3%).
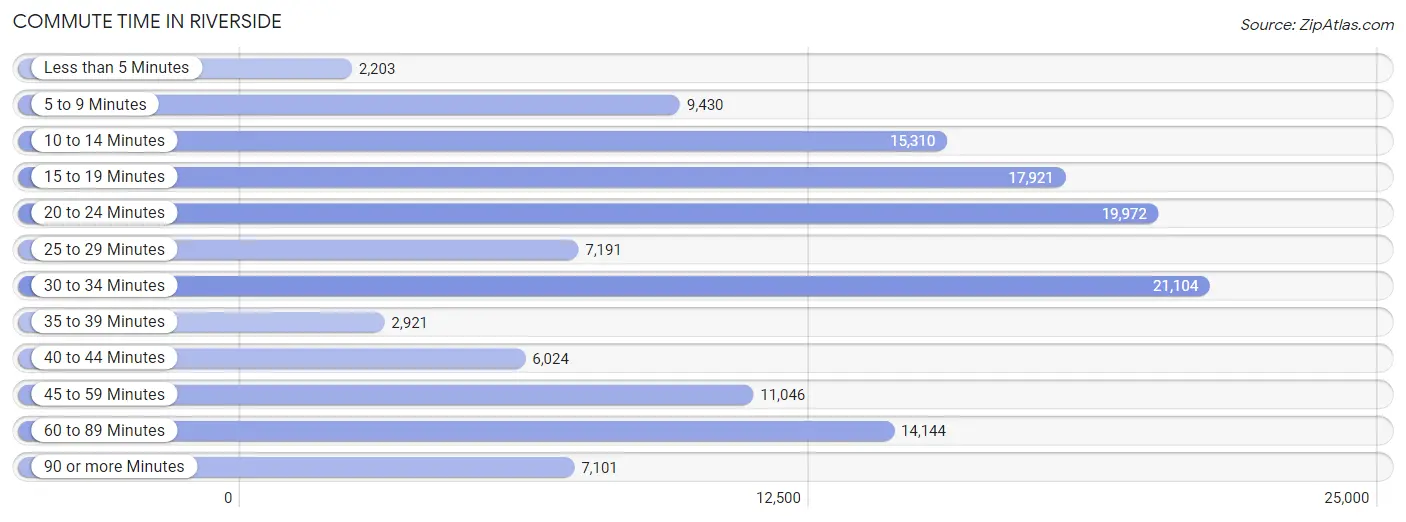
| Commute Time | # Commuters | % Commuters |
| Less than 5 Minutes | 2,203 | 1.6% |
| 5 to 9 Minutes | 9,430 | 7.0% |
| 10 to 14 Minutes | 15,310 | 11.4% |
| 15 to 19 Minutes | 17,921 | 13.3% |
| 20 to 24 Minutes | 19,972 | 14.9% |
| 25 to 29 Minutes | 7,191 | 5.3% |
| 30 to 34 Minutes | 21,104 | 15.7% |
| 35 to 39 Minutes | 2,921 | 2.2% |
| 40 to 44 Minutes | 6,024 | 4.5% |
| 45 to 59 Minutes | 11,046 | 8.2% |
| 60 to 89 Minutes | 14,144 | 10.5% |
| 90 or more Minutes | 7,101 | 5.3% |
Commute Time by Sex in Riverside
The most common commute times in Riverside are 30 to 34 minutes (11,341 commuters, 15.2%) for males and 20 to 24 minutes (9,952 commuters, 16.7%) for females.
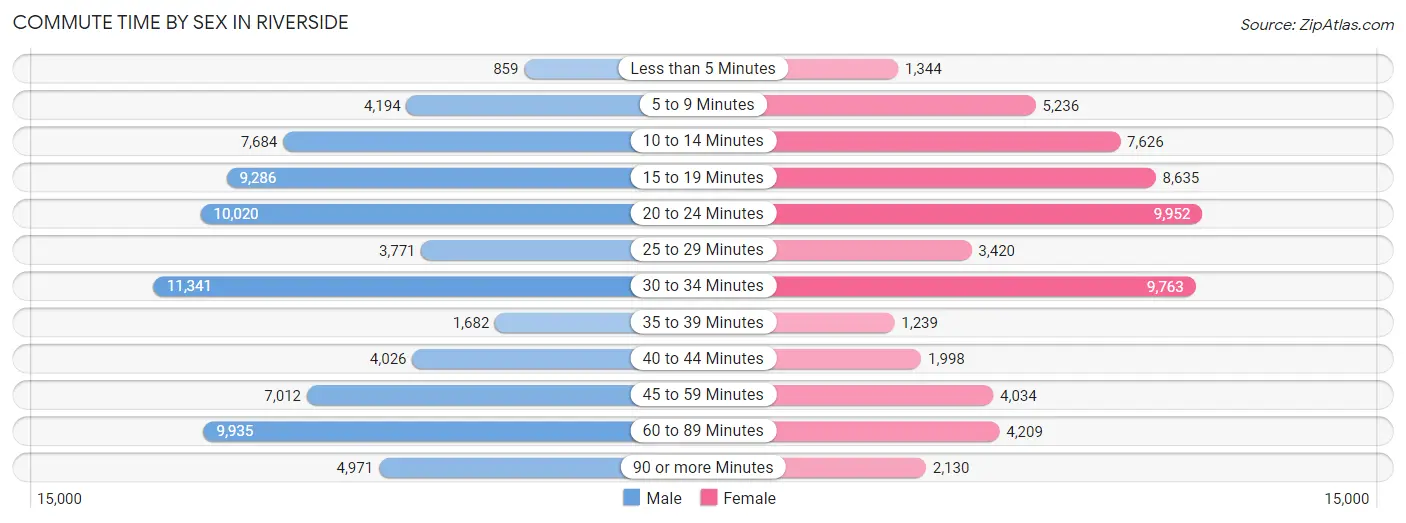
| Commute Time | Male | Female |
| Less than 5 Minutes | 859 (1.1%) | 1,344 (2.3%) |
| 5 to 9 Minutes | 4,194 (5.6%) | 5,236 (8.8%) |
| 10 to 14 Minutes | 7,684 (10.3%) | 7,626 (12.8%) |
| 15 to 19 Minutes | 9,286 (12.4%) | 8,635 (14.5%) |
| 20 to 24 Minutes | 10,020 (13.4%) | 9,952 (16.7%) |
| 25 to 29 Minutes | 3,771 (5.0%) | 3,420 (5.7%) |
| 30 to 34 Minutes | 11,341 (15.2%) | 9,763 (16.4%) |
| 35 to 39 Minutes | 1,682 (2.2%) | 1,239 (2.1%) |
| 40 to 44 Minutes | 4,026 (5.4%) | 1,998 (3.4%) |
| 45 to 59 Minutes | 7,012 (9.4%) | 4,034 (6.8%) |
| 60 to 89 Minutes | 9,935 (13.3%) | 4,209 (7.1%) |
| 90 or more Minutes | 4,971 (6.7%) | 2,130 (3.6%) |
Time of Departure to Work by Sex in Riverside
The most frequent times of departure to work in Riverside are 12:00 AM to 4:59 AM (12,716, 17.0%) for males and 7:00 AM to 7:29 AM (9,417, 15.8%) for females.
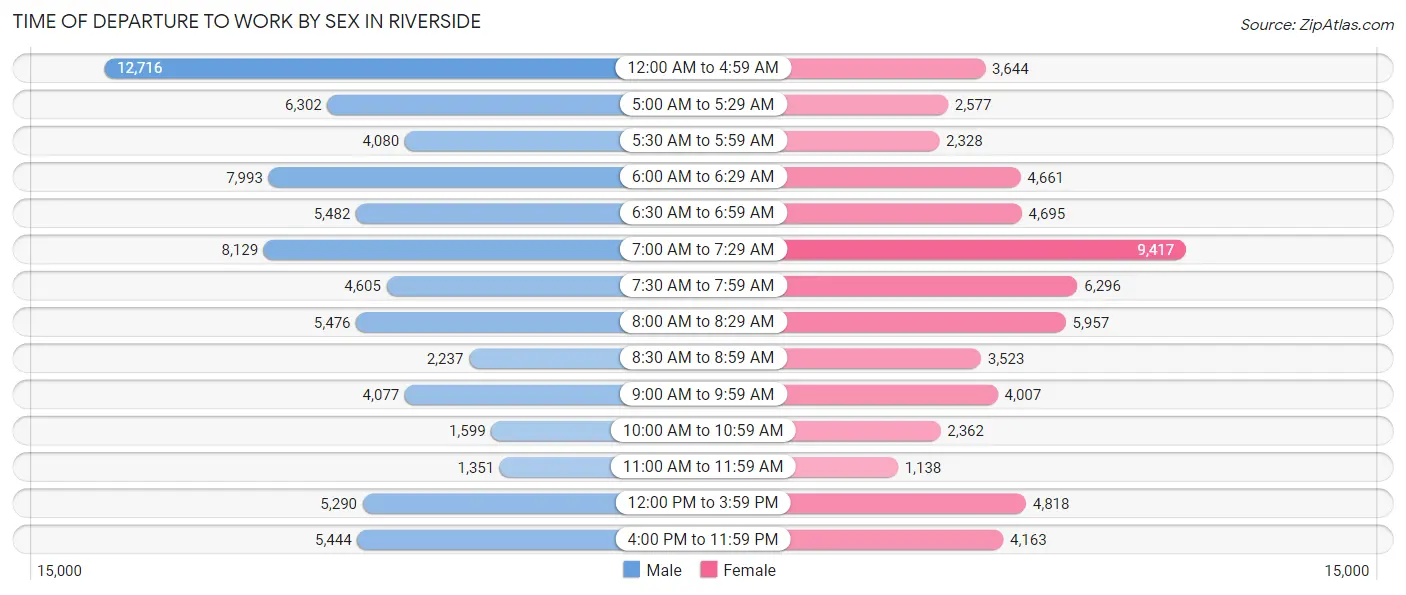
| Time of Departure | Male | Female |
| 12:00 AM to 4:59 AM | 12,716 (17.0%) | 3,644 (6.1%) |
| 5:00 AM to 5:29 AM | 6,302 (8.4%) | 2,577 (4.3%) |
| 5:30 AM to 5:59 AM | 4,080 (5.5%) | 2,328 (3.9%) |
| 6:00 AM to 6:29 AM | 7,993 (10.7%) | 4,661 (7.8%) |
| 6:30 AM to 6:59 AM | 5,482 (7.3%) | 4,695 (7.9%) |
| 7:00 AM to 7:29 AM | 8,129 (10.9%) | 9,417 (15.8%) |
| 7:30 AM to 7:59 AM | 4,605 (6.2%) | 6,296 (10.6%) |
| 8:00 AM to 8:29 AM | 5,476 (7.3%) | 5,957 (10.0%) |
| 8:30 AM to 8:59 AM | 2,237 (3.0%) | 3,523 (5.9%) |
| 9:00 AM to 9:59 AM | 4,077 (5.4%) | 4,007 (6.7%) |
| 10:00 AM to 10:59 AM | 1,599 (2.1%) | 2,362 (4.0%) |
| 11:00 AM to 11:59 AM | 1,351 (1.8%) | 1,138 (1.9%) |
| 12:00 PM to 3:59 PM | 5,290 (7.1%) | 4,818 (8.1%) |
| 4:00 PM to 11:59 PM | 5,444 (7.3%) | 4,163 (7.0%) |
| Total | 74,781 (100.0%) | 59,586 (100.0%) |
Housing Occupancy in Riverside
Occupancy by Ownership in Riverside
Of the total 90,540 dwellings in Riverside, owner-occupied units account for 50,227 (55.5%), while renter-occupied units make up 40,313 (44.5%).
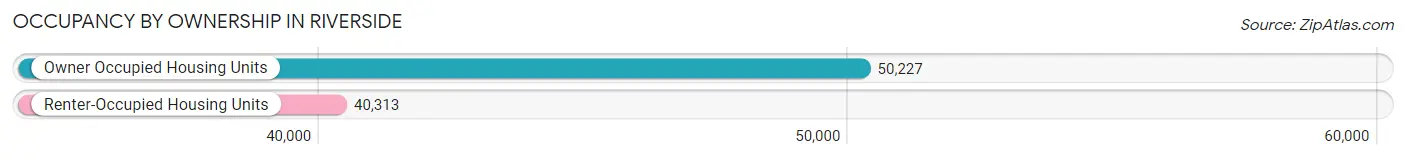
| Occupancy | # Housing Units | % Housing Units |
| Owner Occupied Housing Units | 50,227 | 55.5% |
| Renter-Occupied Housing Units | 40,313 | 44.5% |
| Total Occupied Housing Units | 90,540 | 100.0% |
Occupancy by Household Size in Riverside
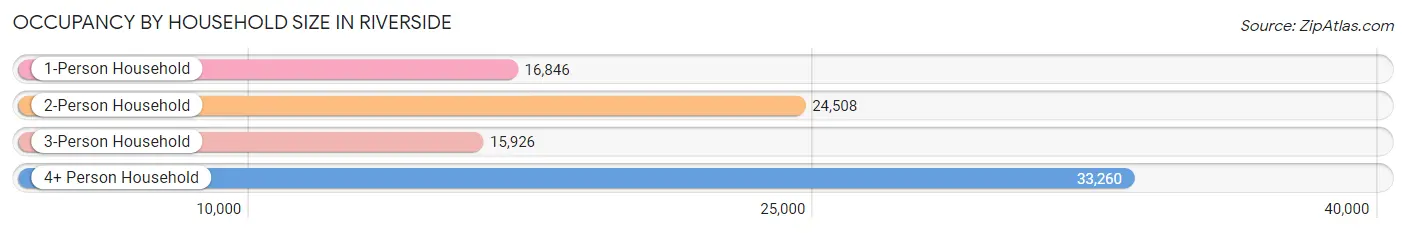
| Household Size | # Housing Units | % Housing Units |
| 1-Person Household | 16,846 | 18.6% |
| 2-Person Household | 24,508 | 27.1% |
| 3-Person Household | 15,926 | 17.6% |
| 4+ Person Household | 33,260 | 36.7% |
| Total Housing Units | 90,540 | 100.0% |
Occupancy by Ownership by Household Size in Riverside
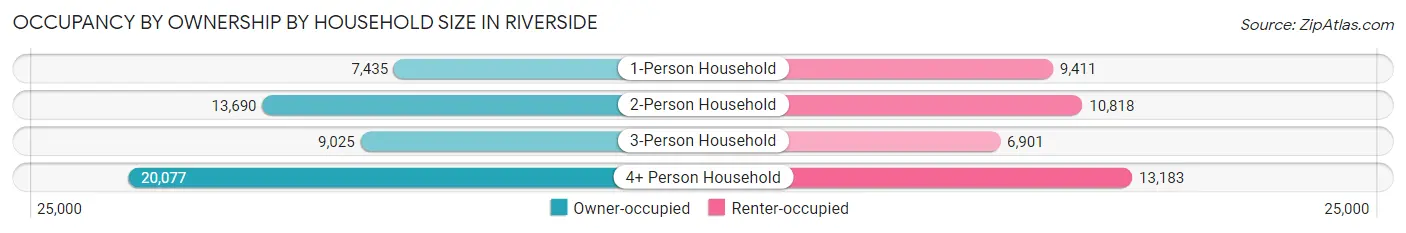
| Household Size | Owner-occupied | Renter-occupied |
| 1-Person Household | 7,435 (44.1%) | 9,411 (55.9%) |
| 2-Person Household | 13,690 (55.9%) | 10,818 (44.1%) |
| 3-Person Household | 9,025 (56.7%) | 6,901 (43.3%) |
| 4+ Person Household | 20,077 (60.4%) | 13,183 (39.6%) |
| Total Housing Units | 50,227 (55.5%) | 40,313 (44.5%) |
Occupancy by Educational Attainment in Riverside
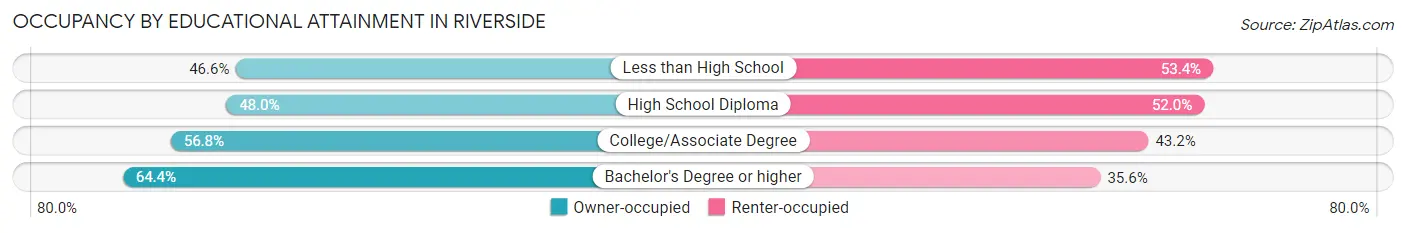
| Household Size | Owner-occupied | Renter-occupied |
| Less than High School | 6,060 (46.6%) | 6,947 (53.4%) |
| High School Diploma | 10,171 (48.0%) | 11,012 (52.0%) |
| College/Associate Degree | 17,220 (56.8%) | 13,089 (43.2%) |
| Bachelor's Degree or higher | 16,776 (64.4%) | 9,265 (35.6%) |
Occupancy by Age of Householder in Riverside
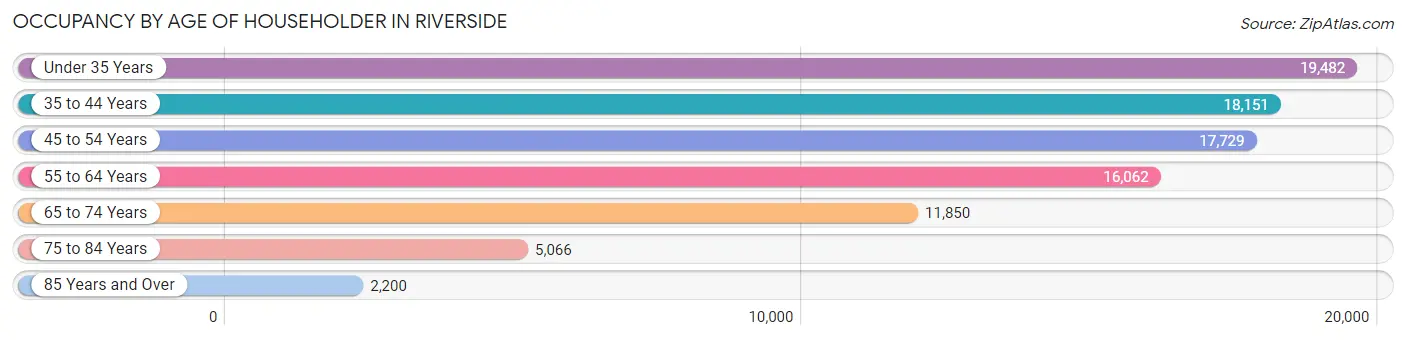
| Age Bracket | # Households | % Households |
| Under 35 Years | 19,482 | 21.5% |
| 35 to 44 Years | 18,151 | 20.1% |
| 45 to 54 Years | 17,729 | 19.6% |
| 55 to 64 Years | 16,062 | 17.7% |
| 65 to 74 Years | 11,850 | 13.1% |
| 75 to 84 Years | 5,066 | 5.6% |
| 85 Years and Over | 2,200 | 2.4% |
| Total | 90,540 | 100.0% |
Housing Finances in Riverside
Median Income by Occupancy in Riverside
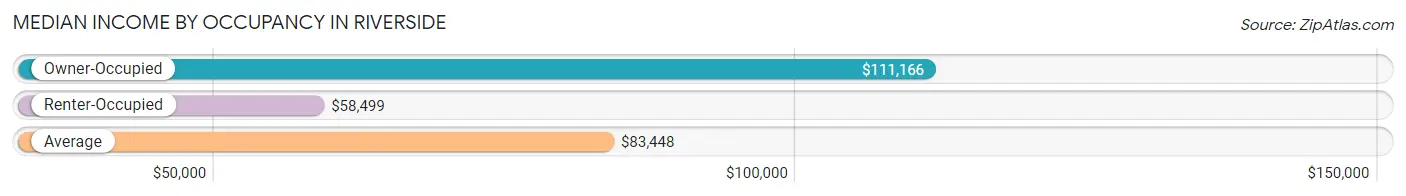
| Occupancy Type | # Households | Median Income |
| Owner-Occupied | 50,227 (55.5%) | $111,166 |
| Renter-Occupied | 40,313 (44.5%) | $58,499 |
| Average | 90,540 (100.0%) | $83,448 |
Occupancy by Householder Income Bracket in Riverside
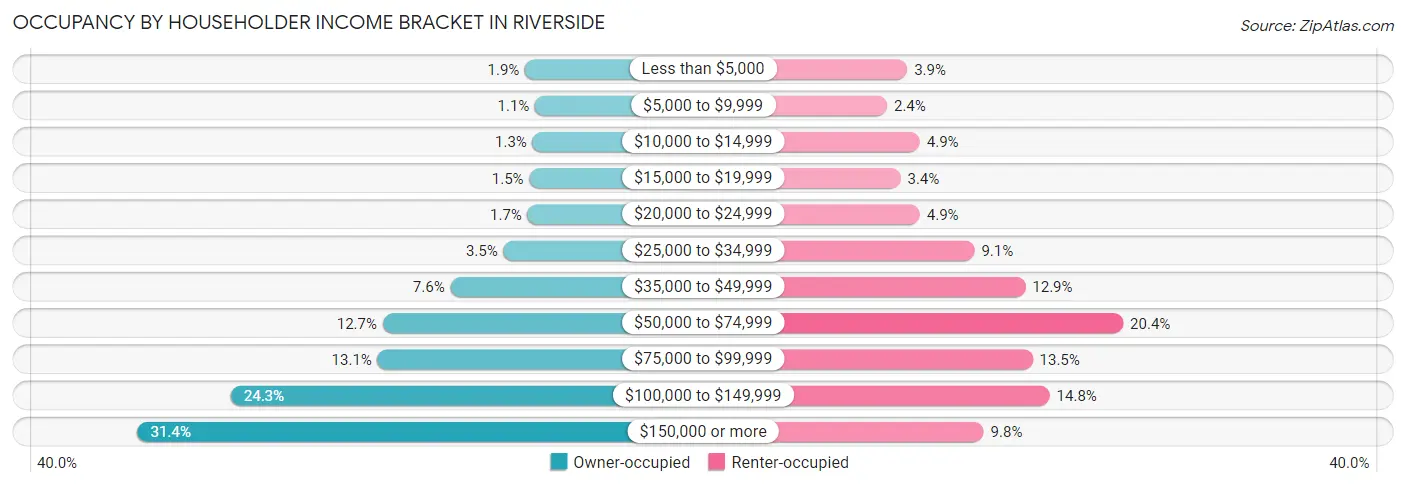
| Income Bracket | Owner-occupied | Renter-occupied |
| Less than $5,000 | 934 (1.9%) | 1,587 (3.9%) |
| $5,000 to $9,999 | 550 (1.1%) | 966 (2.4%) |
| $10,000 to $14,999 | 646 (1.3%) | 1,977 (4.9%) |
| $15,000 to $19,999 | 775 (1.5%) | 1,383 (3.4%) |
| $20,000 to $24,999 | 838 (1.7%) | 1,974 (4.9%) |
| $25,000 to $34,999 | 1,765 (3.5%) | 3,652 (9.1%) |
| $35,000 to $49,999 | 3,793 (7.5%) | 5,218 (12.9%) |
| $50,000 to $74,999 | 6,386 (12.7%) | 8,221 (20.4%) |
| $75,000 to $99,999 | 6,582 (13.1%) | 5,437 (13.5%) |
| $100,000 to $149,999 | 12,194 (24.3%) | 5,964 (14.8%) |
| $150,000 or more | 15,764 (31.4%) | 3,934 (9.8%) |
| Total | 50,227 (100.0%) | 40,313 (100.0%) |
Monthly Housing Cost Tiers in Riverside
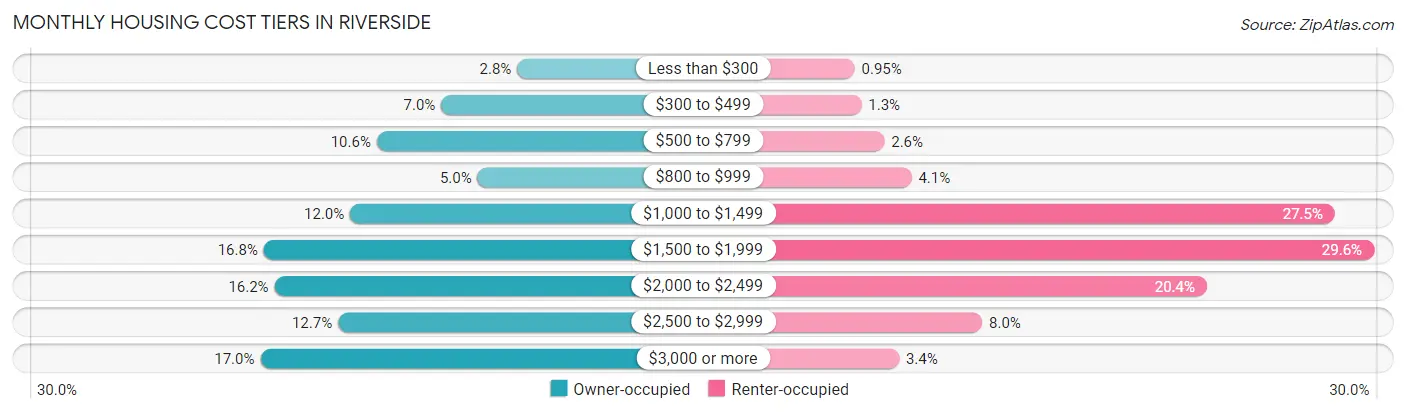
| Monthly Cost | Owner-occupied | Renter-occupied |
| Less than $300 | 1,402 (2.8%) | 381 (0.9%) |
| $300 to $499 | 3,512 (7.0%) | 534 (1.3%) |
| $500 to $799 | 5,297 (10.5%) | 1,046 (2.6%) |
| $800 to $999 | 2,503 (5.0%) | 1,650 (4.1%) |
| $1,000 to $1,499 | 6,039 (12.0%) | 11,074 (27.5%) |
| $1,500 to $1,999 | 8,435 (16.8%) | 11,944 (29.6%) |
| $2,000 to $2,499 | 8,136 (16.2%) | 8,223 (20.4%) |
| $2,500 to $2,999 | 6,372 (12.7%) | 3,219 (8.0%) |
| $3,000 or more | 8,531 (17.0%) | 1,372 (3.4%) |
| Total | 50,227 (100.0%) | 40,313 (100.0%) |
Physical Housing Characteristics in Riverside
Housing Structures in Riverside
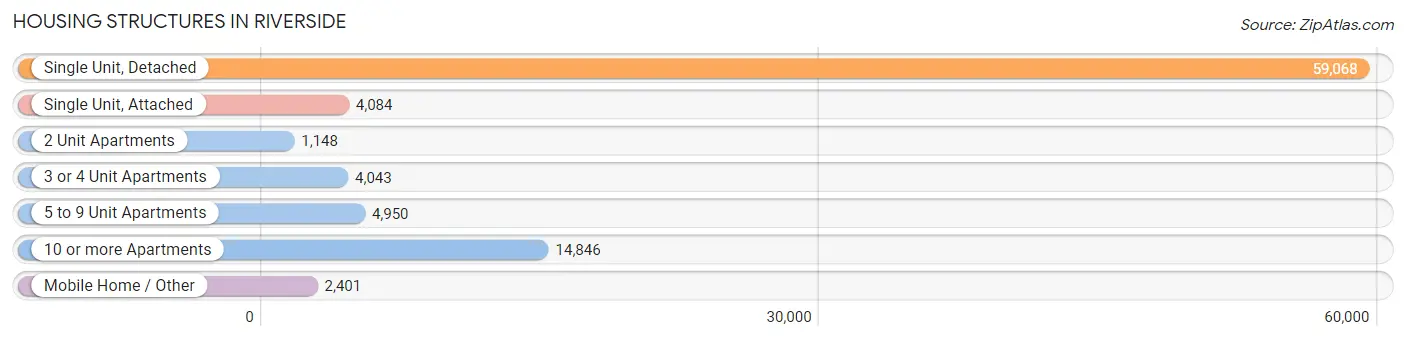
| Structure Type | # Housing Units | % Housing Units |
| Single Unit, Detached | 59,068 | 65.2% |
| Single Unit, Attached | 4,084 | 4.5% |
| 2 Unit Apartments | 1,148 | 1.3% |
| 3 or 4 Unit Apartments | 4,043 | 4.5% |
| 5 to 9 Unit Apartments | 4,950 | 5.5% |
| 10 or more Apartments | 14,846 | 16.4% |
| Mobile Home / Other | 2,401 | 2.6% |
| Total | 90,540 | 100.0% |
Housing Structures by Occupancy in Riverside
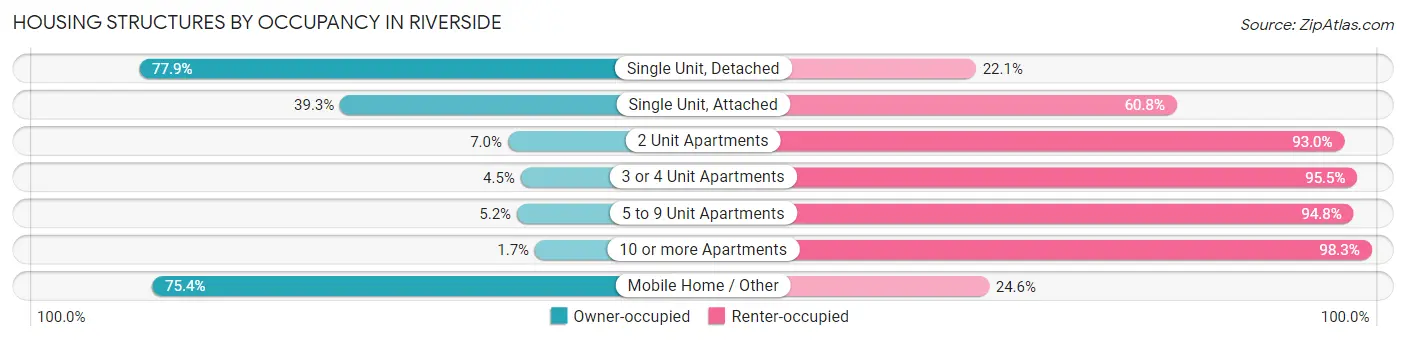
| Structure Type | Owner-occupied | Renter-occupied |
| Single Unit, Detached | 46,035 (77.9%) | 13,033 (22.1%) |
| Single Unit, Attached | 1,603 (39.3%) | 2,481 (60.8%) |
| 2 Unit Apartments | 80 (7.0%) | 1,068 (93.0%) |
| 3 or 4 Unit Apartments | 181 (4.5%) | 3,862 (95.5%) |
| 5 to 9 Unit Apartments | 258 (5.2%) | 4,692 (94.8%) |
| 10 or more Apartments | 259 (1.7%) | 14,587 (98.3%) |
| Mobile Home / Other | 1,811 (75.4%) | 590 (24.6%) |
| Total | 50,227 (55.5%) | 40,313 (44.5%) |
Housing Structures by Number of Rooms in Riverside
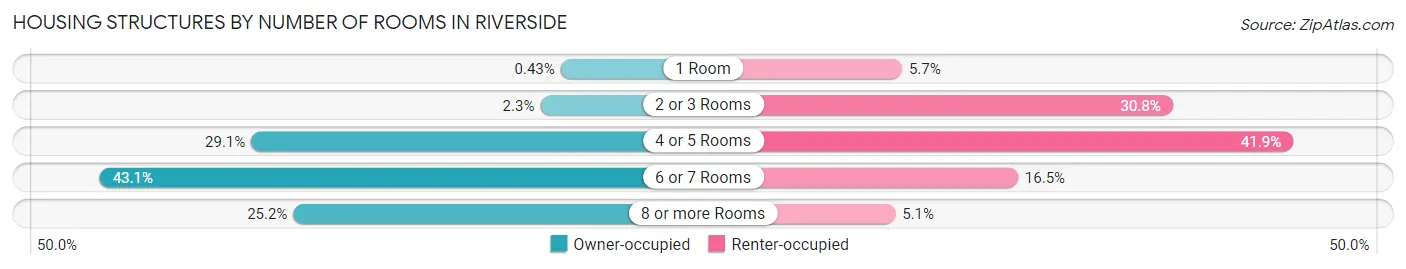
| Number of Rooms | Owner-occupied | Renter-occupied |
| 1 Room | 216 (0.4%) | 2,314 (5.7%) |
| 2 or 3 Rooms | 1,160 (2.3%) | 12,405 (30.8%) |
| 4 or 5 Rooms | 14,590 (29.0%) | 16,894 (41.9%) |
| 6 or 7 Rooms | 21,625 (43.0%) | 6,635 (16.5%) |
| 8 or more Rooms | 12,636 (25.2%) | 2,065 (5.1%) |
| Total | 50,227 (100.0%) | 40,313 (100.0%) |
Housing Structure by Heating Type in Riverside
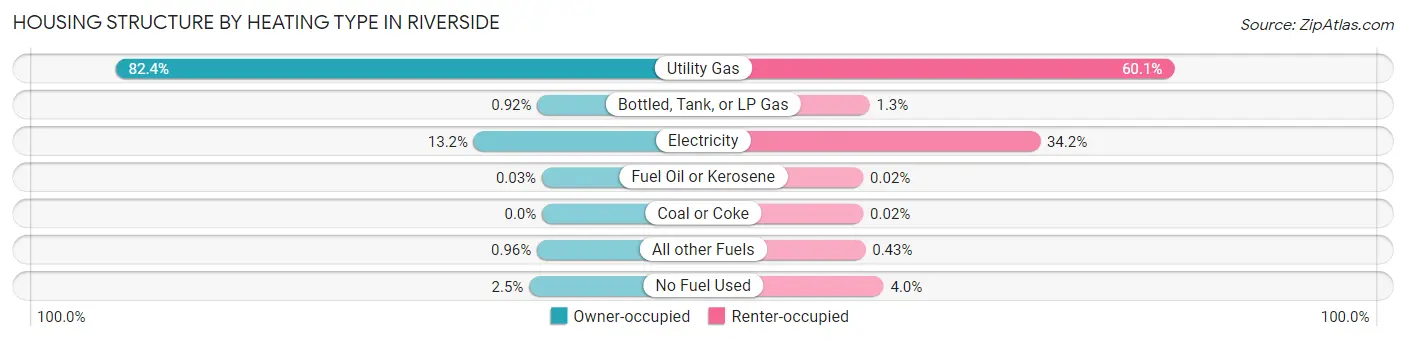
| Heating Type | Owner-occupied | Renter-occupied |
| Utility Gas | 41,386 (82.4%) | 24,237 (60.1%) |
| Bottled, Tank, or LP Gas | 463 (0.9%) | 509 (1.3%) |
| Electricity | 6,623 (13.2%) | 13,783 (34.2%) |
| Fuel Oil or Kerosene | 16 (0.0%) | 8 (0.0%) |
| Coal or Coke | 0 (0.0%) | 7 (0.0%) |
| All other Fuels | 483 (1.0%) | 172 (0.4%) |
| No Fuel Used | 1,256 (2.5%) | 1,597 (4.0%) |
| Total | 50,227 (100.0%) | 40,313 (100.0%) |
Household Vehicle Usage in Riverside
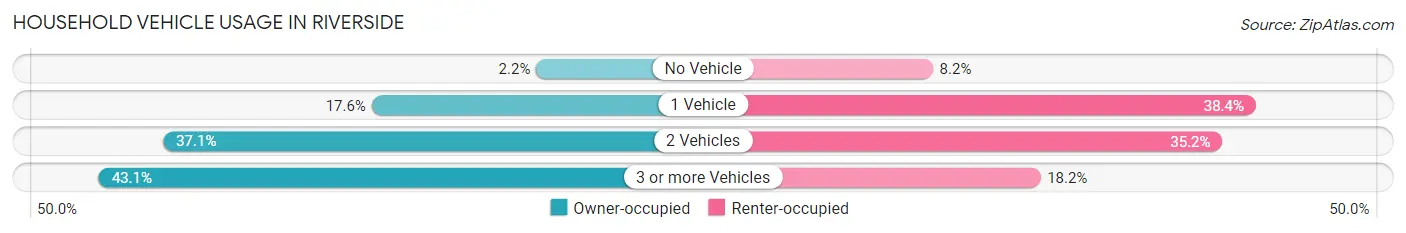
| Vehicles per Household | Owner-occupied | Renter-occupied |
| No Vehicle | 1,125 (2.2%) | 3,303 (8.2%) |
| 1 Vehicle | 8,838 (17.6%) | 15,459 (38.4%) |
| 2 Vehicles | 18,626 (37.1%) | 14,201 (35.2%) |
| 3 or more Vehicles | 21,638 (43.1%) | 7,350 (18.2%) |
| Total | 50,227 (100.0%) | 40,313 (100.0%) |
Real Estate & Mortgages in Riverside
Real Estate and Mortgage Overview in Riverside
| Characteristic | Without Mortgage | With Mortgage |
| Housing Units | 13,322 | 36,905 |
| Median Property Value | $444,700 | $496,100 |
| Median Household Income | $80,988 | $12,961 |
| Monthly Housing Costs | $600 | $8,452 |
| Real Estate Taxes | $2,400 | $773 |
Property Value by Mortgage Status in Riverside
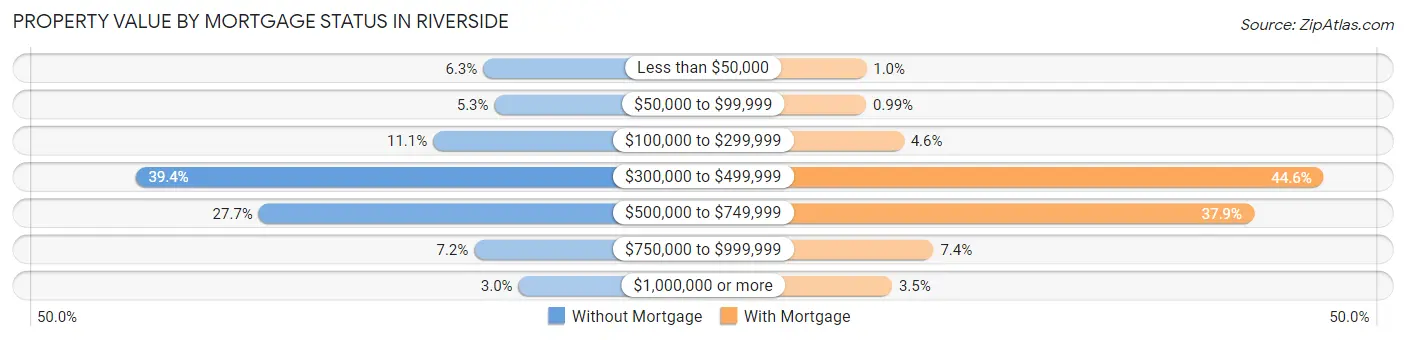
| Property Value | Without Mortgage | With Mortgage |
| Less than $50,000 | 843 (6.3%) | 377 (1.0%) |
| $50,000 to $99,999 | 701 (5.3%) | 366 (1.0%) |
| $100,000 to $299,999 | 1,479 (11.1%) | 1,695 (4.6%) |
| $300,000 to $499,999 | 5,254 (39.4%) | 16,451 (44.6%) |
| $500,000 to $749,999 | 3,691 (27.7%) | 13,997 (37.9%) |
| $750,000 to $999,999 | 958 (7.2%) | 2,739 (7.4%) |
| $1,000,000 or more | 396 (3.0%) | 1,280 (3.5%) |
| Total | 13,322 (100.0%) | 36,905 (100.0%) |
Household Income by Mortgage Status in Riverside
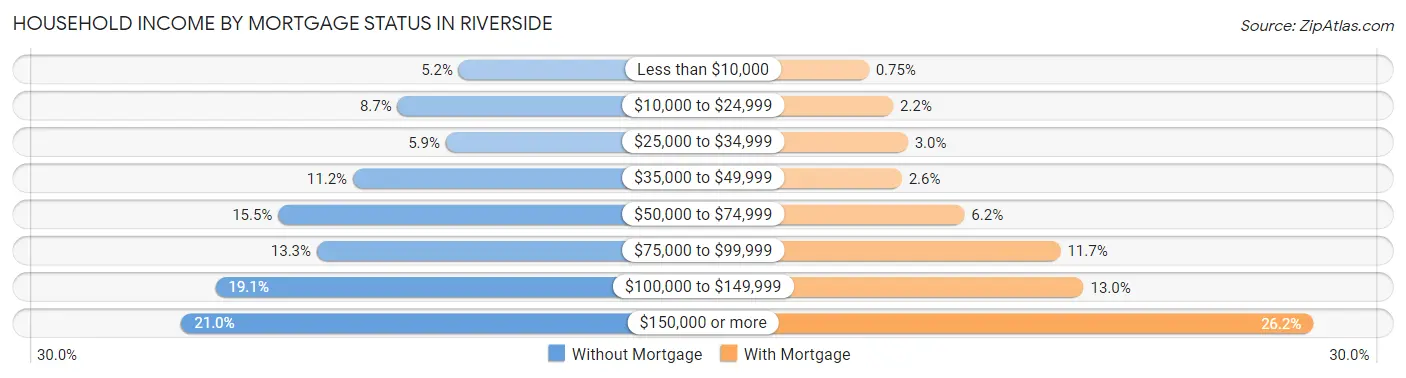
| Household Income | Without Mortgage | With Mortgage |
| Less than $10,000 | 692 (5.2%) | 275 (0.7%) |
| $10,000 to $24,999 | 1,158 (8.7%) | 792 (2.1%) |
| $25,000 to $34,999 | 790 (5.9%) | 1,101 (3.0%) |
| $35,000 to $49,999 | 1,498 (11.2%) | 975 (2.6%) |
| $50,000 to $74,999 | 2,066 (15.5%) | 2,295 (6.2%) |
| $75,000 to $99,999 | 1,772 (13.3%) | 4,320 (11.7%) |
| $100,000 to $149,999 | 2,543 (19.1%) | 4,810 (13.0%) |
| $150,000 or more | 2,803 (21.0%) | 9,651 (26.2%) |
| Total | 13,322 (100.0%) | 36,905 (100.0%) |
Property Value to Household Income Ratio in Riverside
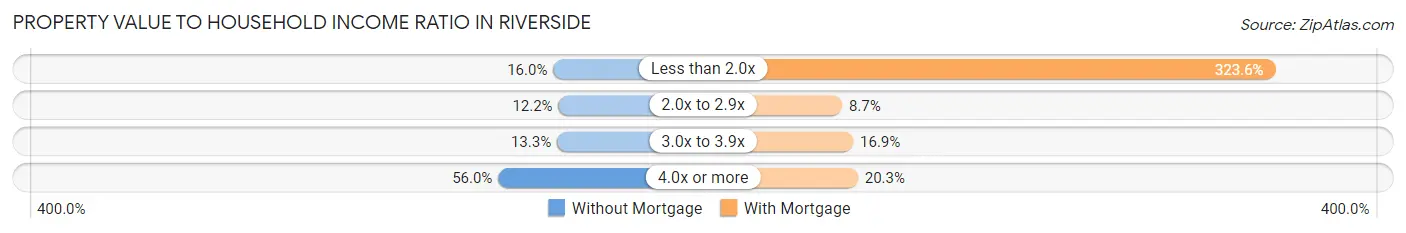
| Value-to-Income Ratio | Without Mortgage | With Mortgage |
| Less than 2.0x | 2,129 (16.0%) | 119,434 (323.6%) |
| 2.0x to 2.9x | 1,622 (12.2%) | 3,221 (8.7%) |
| 3.0x to 3.9x | 1,766 (13.3%) | 6,227 (16.9%) |
| 4.0x or more | 7,454 (55.9%) | 7,481 (20.3%) |
| Total | 13,322 (100.0%) | 36,905 (100.0%) |
Real Estate Taxes by Mortgage Status in Riverside
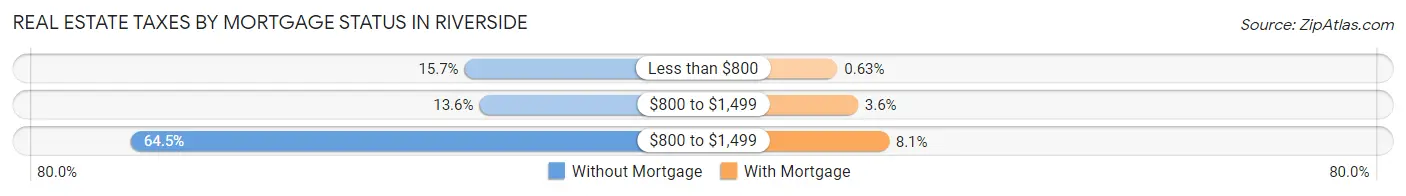
| Property Taxes | Without Mortgage | With Mortgage |
| Less than $800 | 2,096 (15.7%) | 233 (0.6%) |
| $800 to $1,499 | 1,806 (13.6%) | 1,339 (3.6%) |
| $800 to $1,499 | 8,588 (64.5%) | 3,004 (8.1%) |
| Total | 13,322 (100.0%) | 36,905 (100.0%) |
Health & Disability in Riverside
Health Insurance Coverage by Age in Riverside
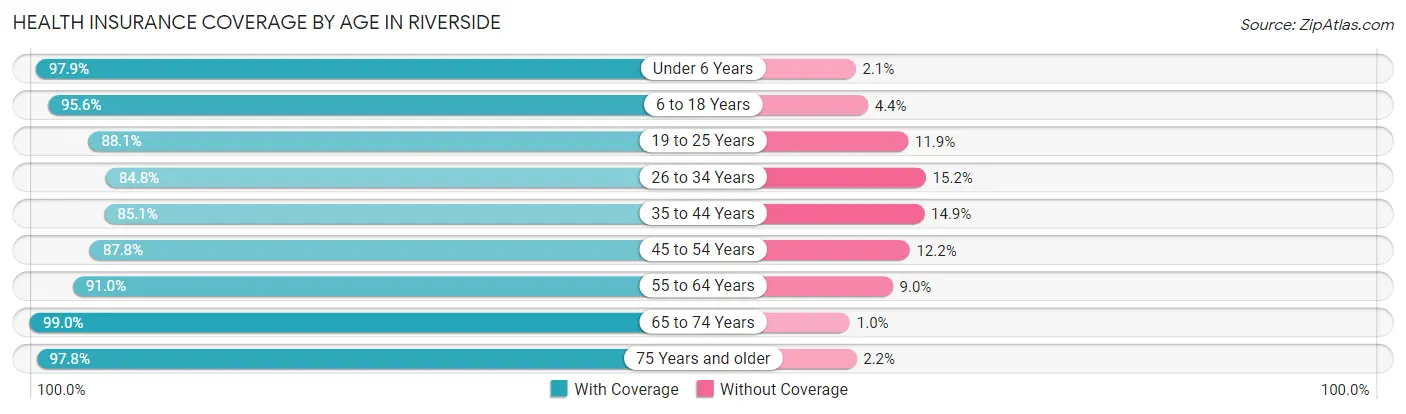
| Age Bracket | With Coverage | Without Coverage |
| Under 6 Years | 22,084 (97.9%) | 472 (2.1%) |
| 6 to 18 Years | 56,696 (95.6%) | 2,594 (4.4%) |
| 19 to 25 Years | 37,772 (88.1%) | 5,095 (11.9%) |
| 26 to 34 Years | 37,331 (84.8%) | 6,678 (15.2%) |
| 35 to 44 Years | 36,244 (85.1%) | 6,337 (14.9%) |
| 45 to 54 Years | 32,234 (87.8%) | 4,464 (12.2%) |
| 55 to 64 Years | 28,368 (91.0%) | 2,810 (9.0%) |
| 65 to 74 Years | 21,349 (99.0%) | 225 (1.0%) |
| 75 Years and older | 12,776 (97.8%) | 292 (2.2%) |
| Total | 284,854 (90.8%) | 28,967 (9.2%) |
Health Insurance Coverage by Citizenship Status in Riverside
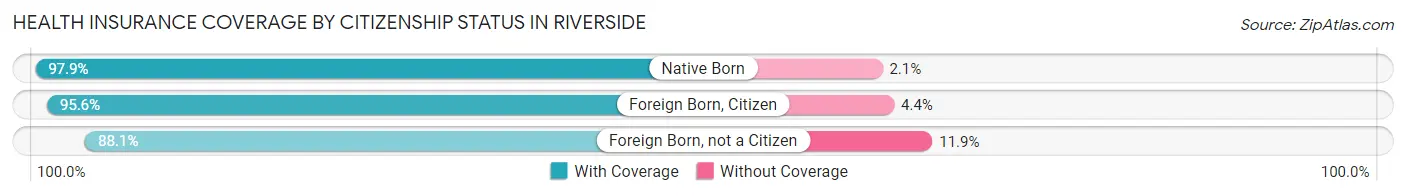
| Citizenship Status | With Coverage | Without Coverage |
| Native Born | 22,084 (97.9%) | 472 (2.1%) |
| Foreign Born, Citizen | 56,696 (95.6%) | 2,594 (4.4%) |
| Foreign Born, not a Citizen | 37,772 (88.1%) | 5,095 (11.9%) |
Health Insurance Coverage by Household Income in Riverside
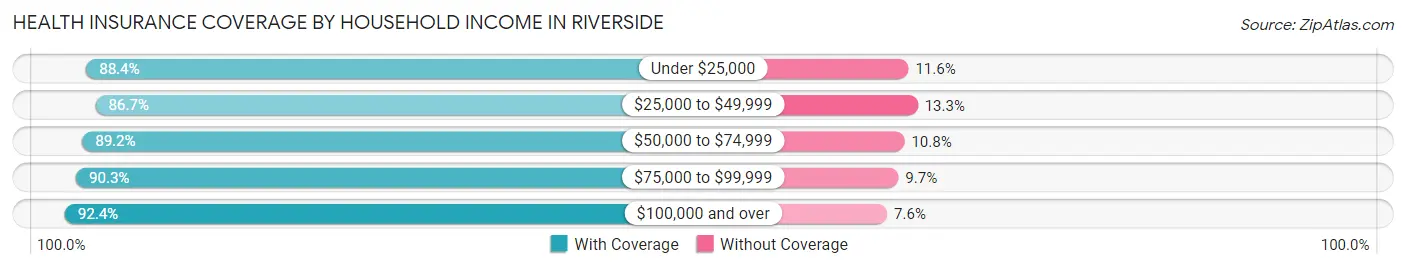
| Household Income | With Coverage | Without Coverage |
| Under $25,000 | 21,933 (88.4%) | 2,868 (11.6%) |
| $25,000 to $49,999 | 34,896 (86.7%) | 5,350 (13.3%) |
| $50,000 to $74,999 | 41,104 (89.2%) | 4,984 (10.8%) |
| $75,000 to $99,999 | 37,484 (90.3%) | 4,012 (9.7%) |
| $100,000 and over | 136,309 (92.4%) | 11,153 (7.6%) |
Public vs Private Health Insurance Coverage by Age in Riverside
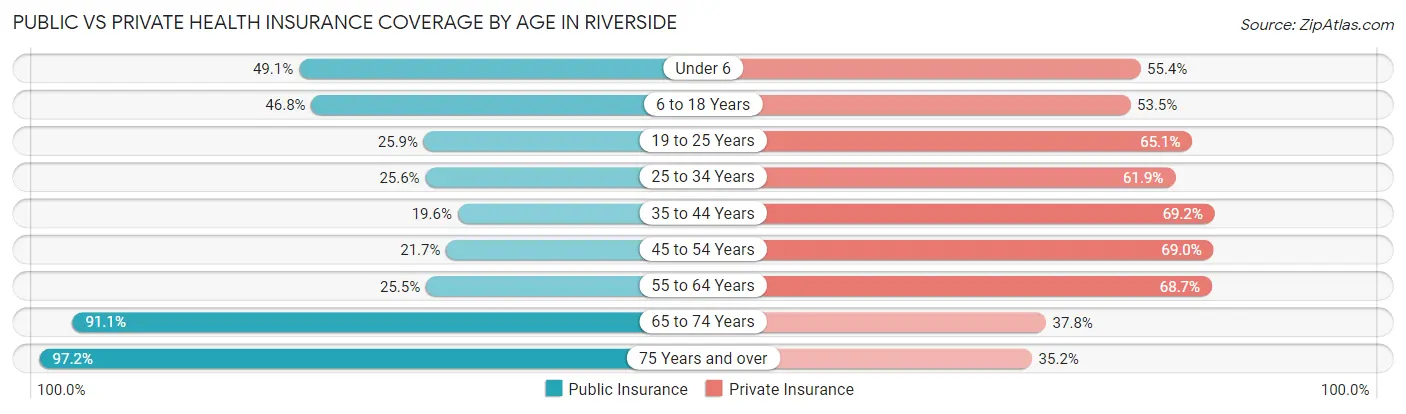
| Age Bracket | Public Insurance | Private Insurance |
| Under 6 | 11,068 (49.1%) | 12,489 (55.4%) |
| 6 to 18 Years | 27,723 (46.8%) | 31,732 (53.5%) |
| 19 to 25 Years | 11,099 (25.9%) | 27,886 (65.0%) |
| 25 to 34 Years | 11,268 (25.6%) | 27,228 (61.9%) |
| 35 to 44 Years | 8,347 (19.6%) | 29,475 (69.2%) |
| 45 to 54 Years | 7,976 (21.7%) | 25,327 (69.0%) |
| 55 to 64 Years | 7,946 (25.5%) | 21,414 (68.7%) |
| 65 to 74 Years | 19,654 (91.1%) | 8,164 (37.8%) |
| 75 Years and over | 12,703 (97.2%) | 4,605 (35.2%) |
| Total | 117,784 (37.5%) | 188,320 (60.0%) |
Disability Status by Sex by Age in Riverside
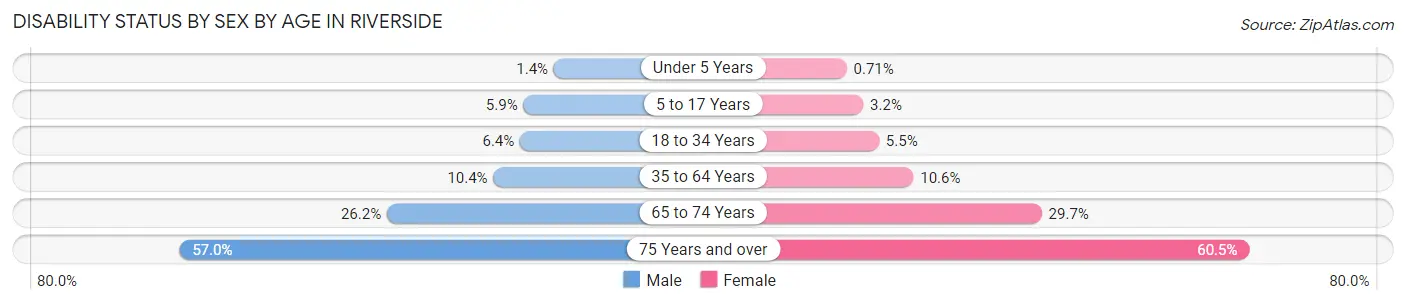
| Age Bracket | Male | Female |
| Under 5 Years | 132 (1.4%) | 64 (0.7%) |
| 5 to 17 Years | 1,756 (5.9%) | 839 (3.2%) |
| 18 to 34 Years | 3,044 (6.4%) | 2,576 (5.5%) |
| 35 to 64 Years | 5,760 (10.4%) | 5,839 (10.6%) |
| 65 to 74 Years | 2,457 (26.2%) | 3,618 (29.7%) |
| 75 Years and over | 2,771 (57.0%) | 4,968 (60.5%) |
Disability Class by Sex by Age in Riverside
Disability Class: Hearing Difficulty
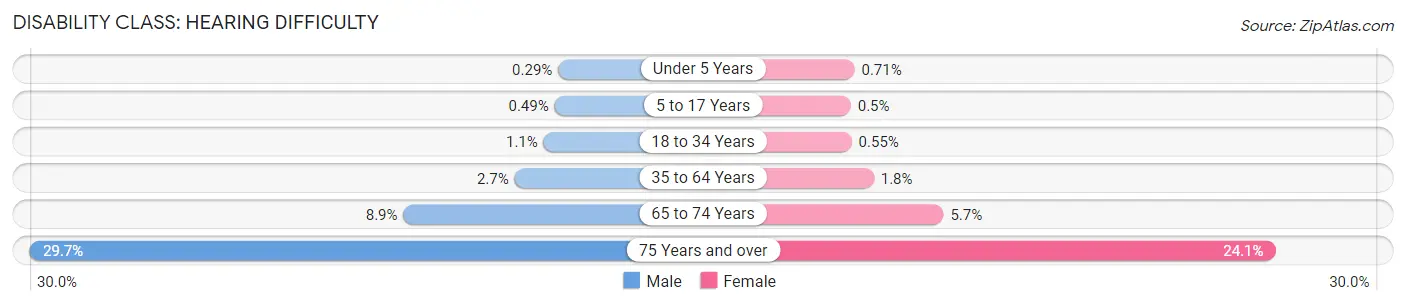
| Age Bracket | Male | Female |
| Under 5 Years | 27 (0.3%) | 64 (0.7%) |
| 5 to 17 Years | 144 (0.5%) | 131 (0.5%) |
| 18 to 34 Years | 524 (1.1%) | 257 (0.5%) |
| 35 to 64 Years | 1,509 (2.7%) | 978 (1.8%) |
| 65 to 74 Years | 836 (8.9%) | 690 (5.7%) |
| 75 Years and over | 1,443 (29.7%) | 1,982 (24.1%) |
Disability Class: Vision Difficulty
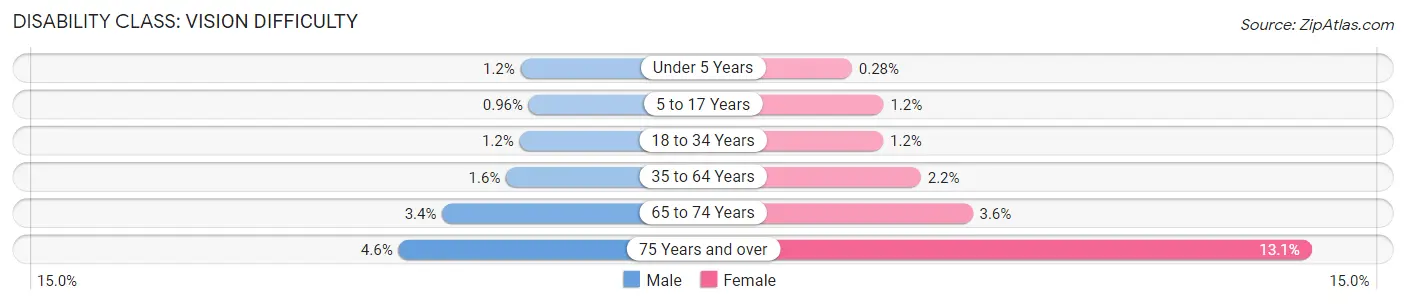
| Age Bracket | Male | Female |
| Under 5 Years | 113 (1.2%) | 25 (0.3%) |
| 5 to 17 Years | 285 (1.0%) | 307 (1.2%) |
| 18 to 34 Years | 580 (1.2%) | 538 (1.1%) |
| 35 to 64 Years | 882 (1.6%) | 1,212 (2.2%) |
| 65 to 74 Years | 316 (3.4%) | 444 (3.6%) |
| 75 Years and over | 223 (4.6%) | 1,074 (13.1%) |
Disability Class: Cognitive Difficulty
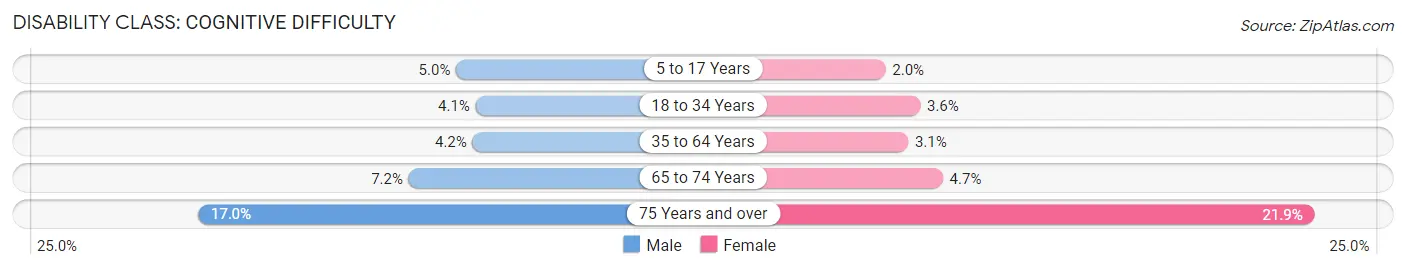
| Age Bracket | Male | Female |
| 5 to 17 Years | 1,475 (5.0%) | 535 (2.0%) |
| 18 to 34 Years | 1,932 (4.1%) | 1,698 (3.6%) |
| 35 to 64 Years | 2,334 (4.2%) | 1,690 (3.1%) |
| 65 to 74 Years | 673 (7.2%) | 570 (4.7%) |
| 75 Years and over | 824 (17.0%) | 1,801 (21.9%) |
Disability Class: Ambulatory Difficulty

| Age Bracket | Male | Female |
| 5 to 17 Years | 117 (0.4%) | 73 (0.3%) |
| 18 to 34 Years | 761 (1.6%) | 308 (0.7%) |
| 35 to 64 Years | 2,922 (5.3%) | 3,157 (5.7%) |
| 65 to 74 Years | 1,568 (16.7%) | 2,655 (21.8%) |
| 75 Years and over | 1,714 (35.3%) | 3,655 (44.5%) |
Disability Class: Self-Care Difficulty
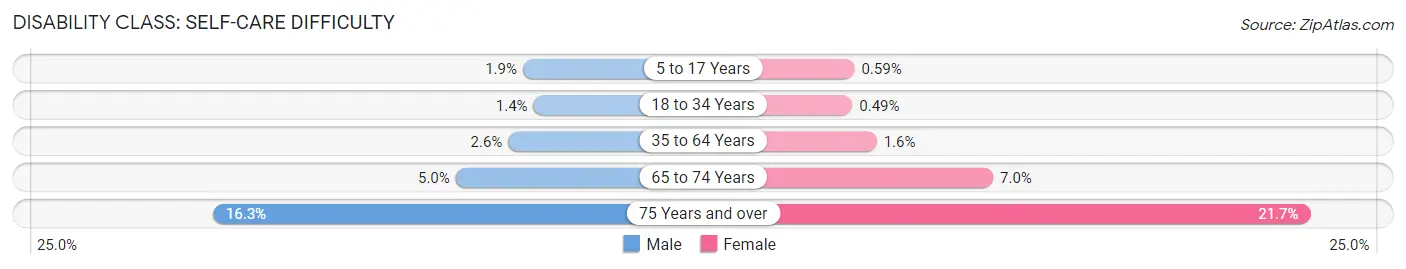
| Age Bracket | Male | Female |
| 5 to 17 Years | 557 (1.9%) | 157 (0.6%) |
| 18 to 34 Years | 661 (1.4%) | 230 (0.5%) |
| 35 to 64 Years | 1,418 (2.6%) | 893 (1.6%) |
| 65 to 74 Years | 469 (5.0%) | 856 (7.0%) |
| 75 Years and over | 790 (16.3%) | 1,785 (21.7%) |
Technology Access in Riverside
Computing Device Access in Riverside
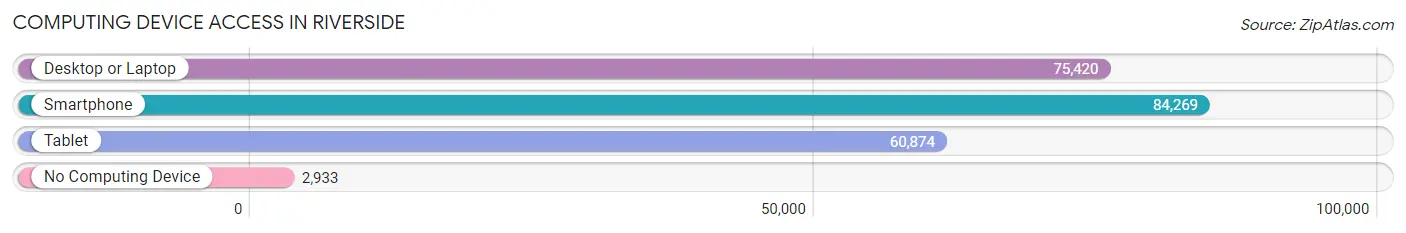
| Device Type | # Households | % Households |
| Desktop or Laptop | 75,420 | 83.3% |
| Smartphone | 84,269 | 93.1% |
| Tablet | 60,874 | 67.2% |
| No Computing Device | 2,933 | 3.2% |
| Total | 90,540 | 100.0% |
Internet Access in Riverside
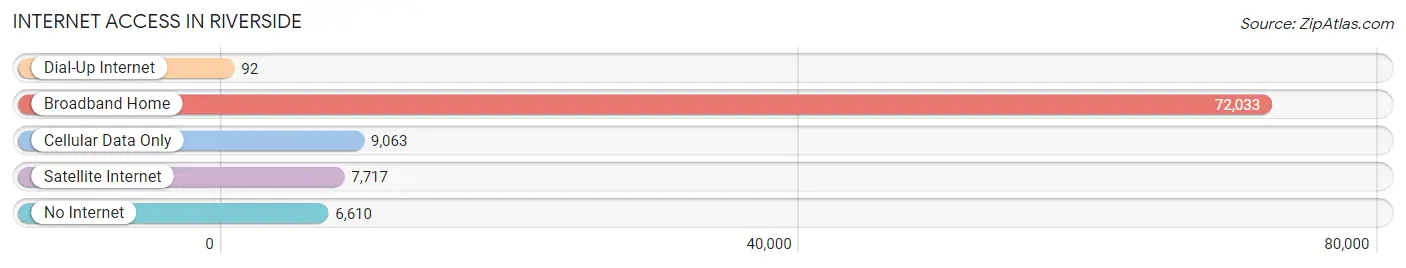
| Internet Type | # Households | % Households |
| Dial-Up Internet | 92 | 0.1% |
| Broadband Home | 72,033 | 79.6% |
| Cellular Data Only | 9,063 | 10.0% |
| Satellite Internet | 7,717 | 8.5% |
| No Internet | 6,610 | 7.3% |
| Total | 90,540 | 100.0% |
Riverside Summary
Riverside, California is a city located in Riverside County, California, United States. It is the county seat of Riverside County and is located in the Inland Empire metropolitan area. The city is situated in the eastern part of the county, approximately 60 miles east of Los Angeles. Riverside is the 12th most populous city in California and the 59th most populous city in the United States, with a population of 303,871 as of the 2010 census.
Geography
Riverside is located in the Inland Empire region of Southern California, approximately 60 miles east of Los Angeles. The city is situated in the eastern part of Riverside County, at the base of the San Jacinto Mountains. The city is bordered by the cities of Moreno Valley to the south, Corona to the west, and Jurupa Valley to the north. The Santa Ana River flows through the city, and the city is located in the Santa Ana River Valley.
Riverside has a total area of 81.4 square miles, of which 81.2 square miles is land and 0.2 square miles is water. The city is located at an elevation of 860 feet above sea level.
History
Riverside was founded in 1870 by John W. North and a group of businessmen and land speculators. The city was named for its location on the Santa Ana River. The city was incorporated in 1883 and became the county seat of Riverside County in 1893.
Riverside experienced rapid growth in the late 19th and early 20th centuries, due to its proximity to Los Angeles and the development of the citrus industry. The city was a major center for the citrus industry, and was home to several large packing houses. The city also became a major center for the defense industry during World War II, with the establishment of the March Air Force Base.
Economy
Riverside is a major economic center in the Inland Empire region of Southern California. The city is home to several major employers, including the University of California, Riverside, the March Air Reserve Base, and the Riverside County Regional Medical Center. The city is also home to several major corporations, including the Frito-Lay Company, the Procter & Gamble Company, and the Nestle Corporation.
The city's economy is also supported by a strong tourism industry. Riverside is home to several popular attractions, including the Mission Inn, the Riverside Metropolitan Museum, and the Fox Performing Arts Center. The city is also home to several popular annual events, including the Riverside International Film Festival and the Riverside Dickens Festival.
Demographics
As of the 2010 census, Riverside had a population of 303,871. The racial makeup of the city was 57.2% White, 8.2% African American, 1.2% Native American, 11.2% Asian, 0.3% Pacific Islander, 17.7% from other races, and 4.2% from two or more races. Hispanic or Latino of any race were 37.2% of the population.
The median household income in Riverside was $50,867, and the median family income was $60,879. The per capita income in Riverside was $24,845. About 15.2% of the population was below the poverty line.
Riverside is served by the Riverside Unified School District, which operates over 50 elementary, middle, and high schools. The city is also home to several higher education institutions, including the University of California, Riverside, California Baptist University, and La Sierra University.
Common Questions
What is Per Capita Income in Riverside?
Per Capita income in Riverside is $31,632.
What is the Median Family Income in Riverside?
Median Family Income in Riverside is $95,041.
What is the Median Household income in Riverside?
Median Household Income in Riverside is $83,448.
What is Income or Wage Gap in Riverside?
Income or Wage Gap in Riverside is 24.0%.
Women in Riverside earn 76.0 cents for every dollar earned by a man.
What is Family Income Deficit in Riverside?
Family Income Deficit in Riverside is $10,990.
Families that are below poverty line in Riverside earn $10,990 less on average than the poverty threshold level.
What is Inequality or Gini Index in Riverside?
Inequality or Gini Index in Riverside is 0.42.
What is the Total Population of Riverside?
Total Population of Riverside is 316,076.
What is the Total Male Population of Riverside?
Total Male Population of Riverside is 157,363.
What is the Total Female Population of Riverside?
Total Female Population of Riverside is 158,713.
What is the Ratio of Males per 100 Females in Riverside?
There are 99.15 Males per 100 Females in Riverside.
What is the Ratio of Females per 100 Males in Riverside?
There are 100.86 Females per 100 Males in Riverside.
What is the Median Population Age in Riverside?
Median Population Age in Riverside is 32.4 Years.
What is the Average Family Size in Riverside
Average Family Size in Riverside is 3.8 People.
What is the Average Household Size in Riverside
Average Household Size in Riverside is 3.3 People.
How Large is the Labor Force in Riverside?
There are 160,182 People in the Labor Forcein in Riverside.
What is the Percentage of People in the Labor Force in Riverside?
64.0% of People are in the Labor Force in Riverside.
What is the Unemployment Rate in Riverside?
Unemployment Rate in Riverside is 6.1%.