Temecula, CA Map & Demographics
Temecula Map
Temecula Overview
$42,562
PER CAPITA INCOME
$118,519
AVG FAMILY INCOME
$111,881
AVG HOUSEHOLD INCOME
45.7%
WAGE / INCOME GAP [ % ]
54.3¢/ $1
WAGE / INCOME GAP [ $ ]
$13,701
FAMILY INCOME DEFICIT
0.39
INEQUALITY / GINI INDEX
110,114
TOTAL POPULATION
54,432
MALE POPULATION
55,682
FEMALE POPULATION
97.76
MALES / 100 FEMALES
102.30
FEMALES / 100 MALES
36.2
MEDIAN AGE
3.5
AVG FAMILY SIZE
3.1
AVG HOUSEHOLD SIZE
54,016
LABOR FORCE [ PEOPLE ]
65.0%
PERCENT IN LABOR FORCE
5.8%
UNEMPLOYMENT RATE
Income in Temecula
Income Overview in Temecula
Per Capita Income in Temecula is $42,562, while median incomes of families and households are $118,519 and $111,881 respectively.
| Characteristic | Number | Measure |
| Per Capita Income | 110,114 | $42,562 |
| Median Family Income | 28,108 | $118,519 |
| Mean Family Income | 28,108 | $137,702 |
| Median Household Income | 35,012 | $111,881 |
| Mean Household Income | 35,012 | $129,959 |
| Income Deficit | 28,108 | $13,701 |
| Wage / Income Gap (%) | 110,114 | 45.75% |
| Wage / Income Gap ($) | 110,114 | 54.25¢ per $1 |
| Gini / Inequality Index | 110,114 | 0.39 |
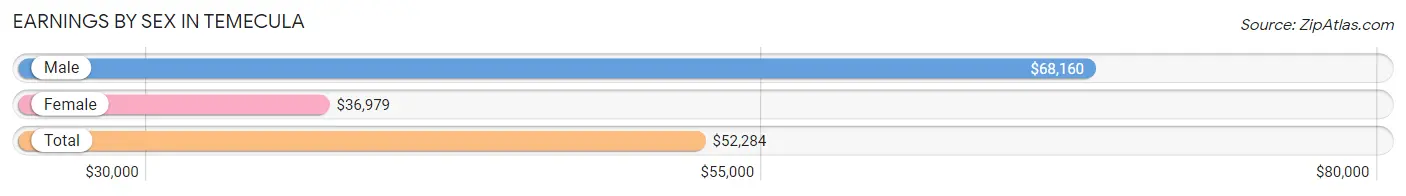
Earnings by Sex in Temecula
Average Earnings in Temecula are $52,284, $68,160 for men and $36,979 for women, a difference of 45.8%.
| Sex | Number | Average Earnings |
| Male | 30,457 (54.9%) | $68,160 |
| Female | 25,026 (45.1%) | $36,979 |
| Total | 55,483 (100.0%) | $52,284 |
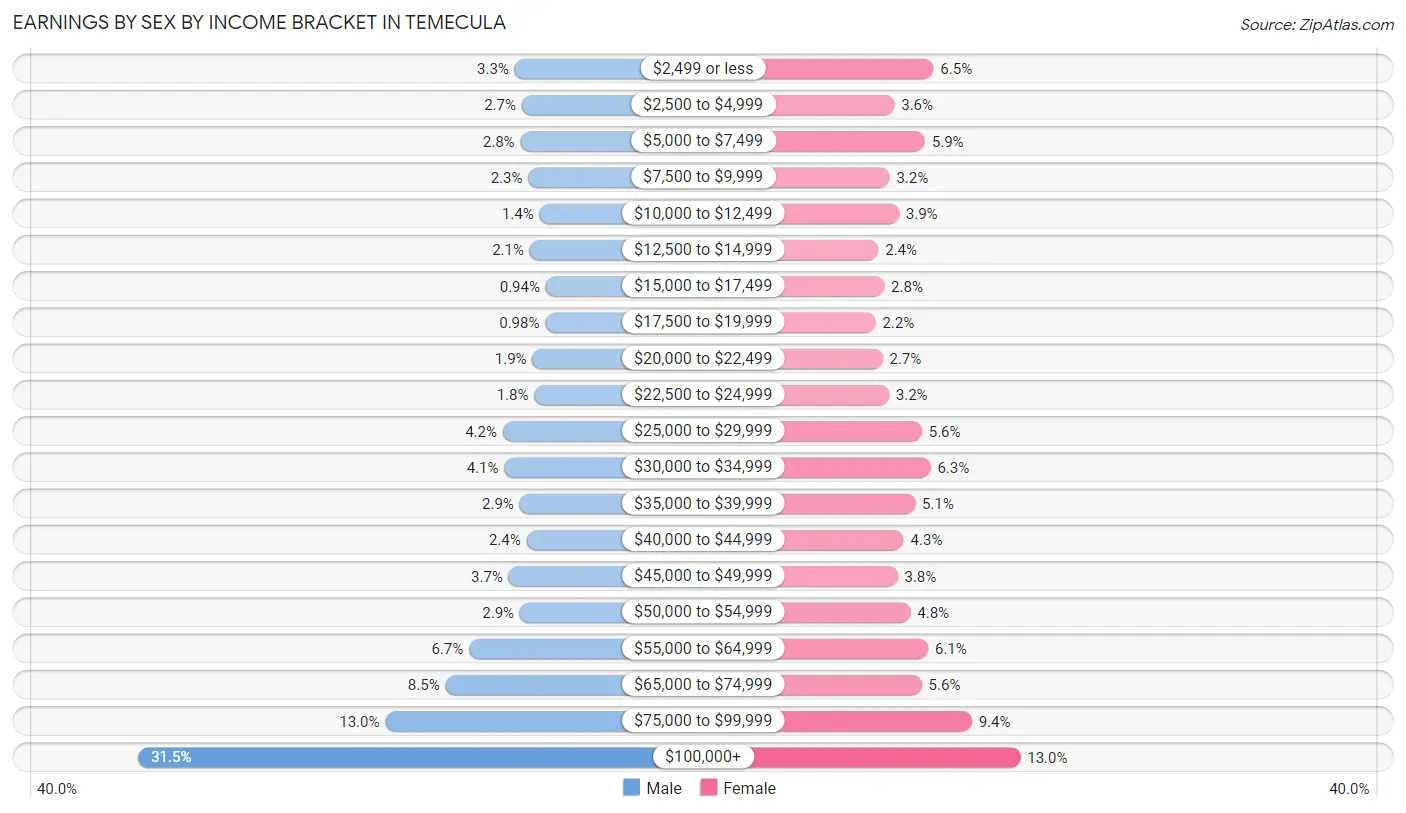
Earnings by Sex by Income Bracket in Temecula
The most common earnings brackets in Temecula are $100,000+ for men (9,595 | 31.5%) and $100,000+ for women (3,253 | 13.0%).
| Income | Male | Female |
| $2,499 or less | 995 (3.3%) | 1,625 (6.5%) |
| $2,500 to $4,999 | 833 (2.7%) | 890 (3.6%) |
| $5,000 to $7,499 | 866 (2.8%) | 1,463 (5.9%) |
| $7,500 to $9,999 | 684 (2.2%) | 802 (3.2%) |
| $10,000 to $12,499 | 429 (1.4%) | 976 (3.9%) |
| $12,500 to $14,999 | 652 (2.1%) | 591 (2.4%) |
| $15,000 to $17,499 | 286 (0.9%) | 700 (2.8%) |
| $17,500 to $19,999 | 299 (1.0%) | 539 (2.1%) |
| $20,000 to $22,499 | 590 (1.9%) | 667 (2.7%) |
| $22,500 to $24,999 | 549 (1.8%) | 788 (3.2%) |
| $25,000 to $29,999 | 1,267 (4.2%) | 1,406 (5.6%) |
| $30,000 to $34,999 | 1,234 (4.1%) | 1,569 (6.3%) |
| $35,000 to $39,999 | 882 (2.9%) | 1,279 (5.1%) |
| $40,000 to $44,999 | 724 (2.4%) | 1,066 (4.3%) |
| $45,000 to $49,999 | 1,132 (3.7%) | 950 (3.8%) |
| $50,000 to $54,999 | 876 (2.9%) | 1,191 (4.8%) |
| $55,000 to $64,999 | 2,038 (6.7%) | 1,523 (6.1%) |
| $65,000 to $74,999 | 2,577 (8.5%) | 1,405 (5.6%) |
| $75,000 to $99,999 | 3,949 (13.0%) | 2,343 (9.4%) |
| $100,000+ | 9,595 (31.5%) | 3,253 (13.0%) |
| Total | 30,457 (100.0%) | 25,026 (100.0%) |
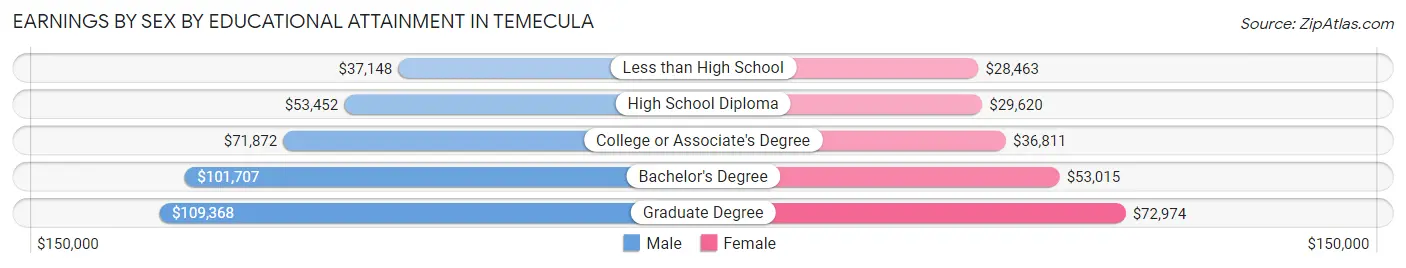
Earnings by Sex by Educational Attainment in Temecula
Average earnings in Temecula are $74,635 for men and $42,726 for women, a difference of 42.7%. Men with an educational attainment of graduate degree enjoy the highest average annual earnings of $109,368, while those with less than high school education earn the least with $37,148. Women with an educational attainment of graduate degree earn the most with the average annual earnings of $72,974, while those with less than high school education have the smallest earnings of $28,463.
| Educational Attainment | Male Income | Female Income |
| Less than High School | $37,148 | $28,463 |
| High School Diploma | $53,452 | $29,620 |
| College or Associate's Degree | $71,872 | $36,811 |
| Bachelor's Degree | $101,707 | $53,015 |
| Graduate Degree | $109,368 | $72,974 |
| Total | $74,635 | $42,726 |
Family Income in Temecula
Family Income Brackets in Temecula
According to the Temecula family income data, there are 6,886 families falling into the $100,000 to $149,999 income range, which is the most common income bracket and makes up 24.5% of all families. Conversely, the $10,000 to $14,999 income bracket is the least frequent group with only 253 families (0.9%) belonging to this category.
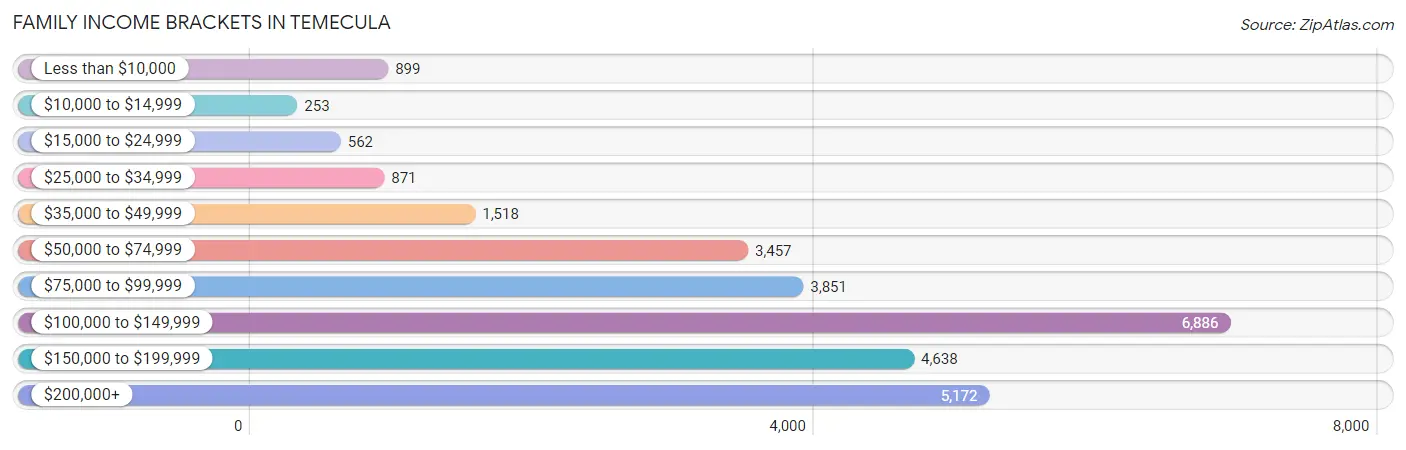
| Income Bracket | # Families | % Families |
| Less than $10,000 | 899 | 3.2% |
| $10,000 to $14,999 | 253 | 0.9% |
| $15,000 to $24,999 | 562 | 2.0% |
| $25,000 to $34,999 | 871 | 3.1% |
| $35,000 to $49,999 | 1,518 | 5.4% |
| $50,000 to $74,999 | 3,457 | 12.3% |
| $75,000 to $99,999 | 3,851 | 13.7% |
| $100,000 to $149,999 | 6,886 | 24.5% |
| $150,000 to $199,999 | 4,638 | 16.5% |
| $200,000+ | 5,172 | 18.4% |
Family Income by Famaliy Size in Temecula
7+ person families (438 | 1.6%) account for the highest median family income in Temecula with $138,148 per family, while 2-person families (10,005 | 35.6%) have the highest median income of $50,975 per family member.
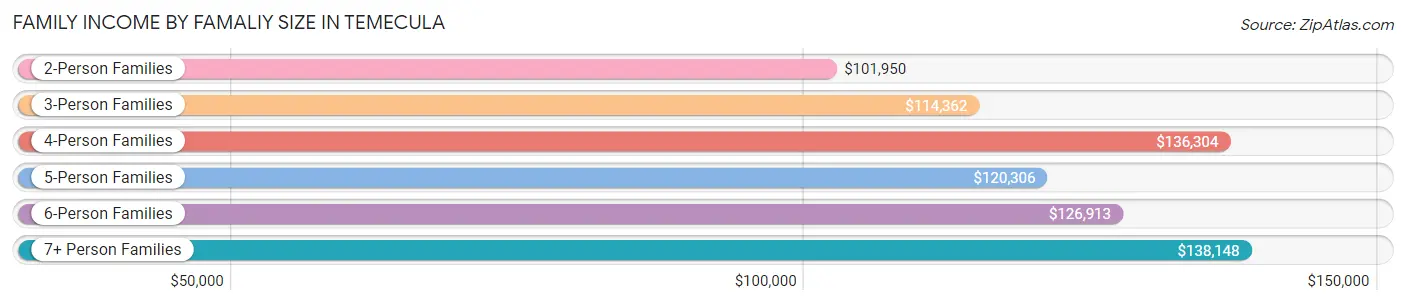
| Income Bracket | # Families | Median Income |
| 2-Person Families | 10,005 (35.6%) | $101,950 |
| 3-Person Families | 6,605 (23.5%) | $114,362 |
| 4-Person Families | 6,994 (24.9%) | $136,304 |
| 5-Person Families | 2,757 (9.8%) | $120,306 |
| 6-Person Families | 1,309 (4.7%) | $126,913 |
| 7+ Person Families | 438 (1.6%) | $138,148 |
| Total | 28,108 (100.0%) | $118,519 |
Family Income by Number of Earners in Temecula
The median family income in Temecula is $118,519, with families comprising 3+ earners (3,736) having the highest median family income of $155,488, while families with no earners (3,001) have the lowest median family income of $59,543, accounting for 13.3% and 10.7% of families, respectively.
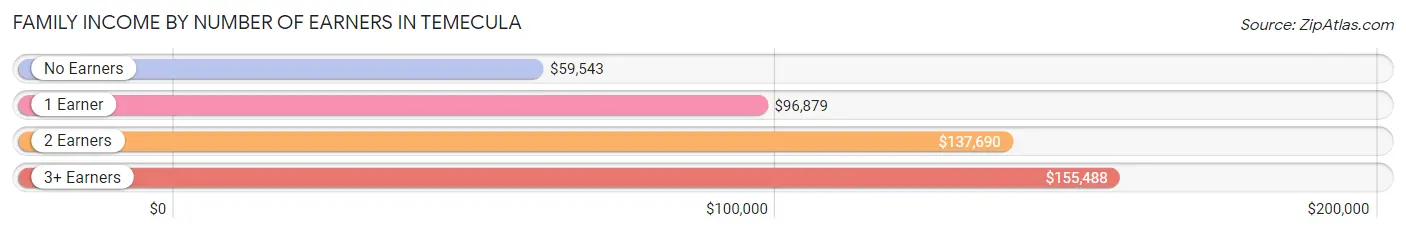
| Number of Earners | # Families | Median Income |
| No Earners | 3,001 (10.7%) | $59,543 |
| 1 Earner | 10,029 (35.7%) | $96,879 |
| 2 Earners | 11,342 (40.4%) | $137,690 |
| 3+ Earners | 3,736 (13.3%) | $155,488 |
| Total | 28,108 (100.0%) | $118,519 |
Household Income in Temecula
Household Income Brackets in Temecula
With 8,333 households falling in the category, the $100,000 to $149,999 income range is the most frequent in Temecula, accounting for 23.8% of all households. In contrast, only 630 households (1.8%) fall into the $10,000 to $14,999 income bracket, making it the least populous group.
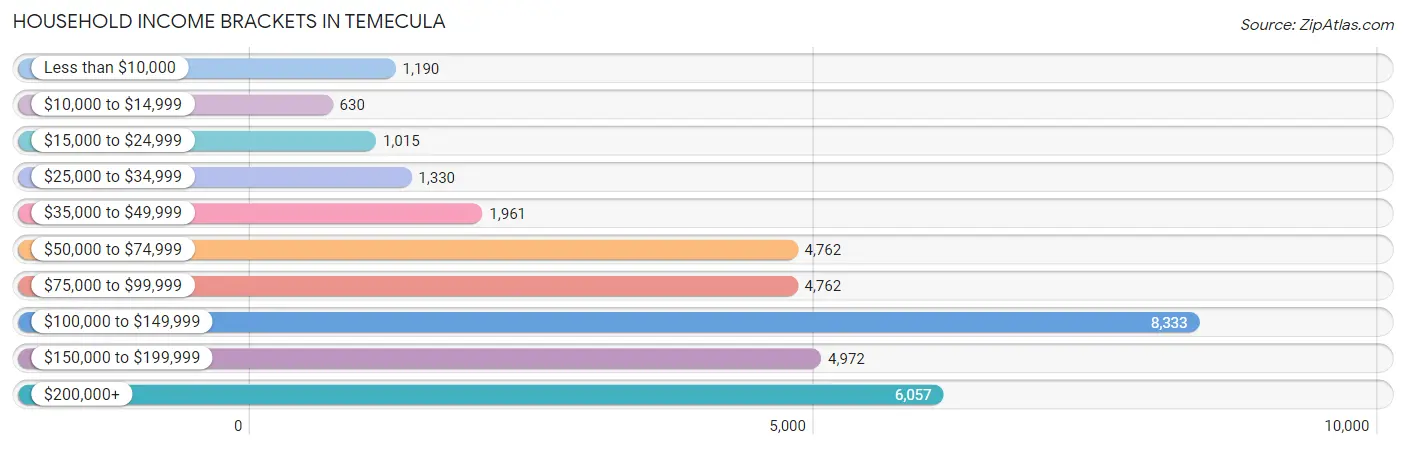
| Income Bracket | # Households | % Households |
| Less than $10,000 | 1,190 | 3.4% |
| $10,000 to $14,999 | 630 | 1.8% |
| $15,000 to $24,999 | 1,015 | 2.9% |
| $25,000 to $34,999 | 1,330 | 3.8% |
| $35,000 to $49,999 | 1,961 | 5.6% |
| $50,000 to $74,999 | 4,762 | 13.6% |
| $75,000 to $99,999 | 4,762 | 13.6% |
| $100,000 to $149,999 | 8,333 | 23.8% |
| $150,000 to $199,999 | 4,972 | 14.2% |
| $200,000+ | 6,057 | 17.3% |
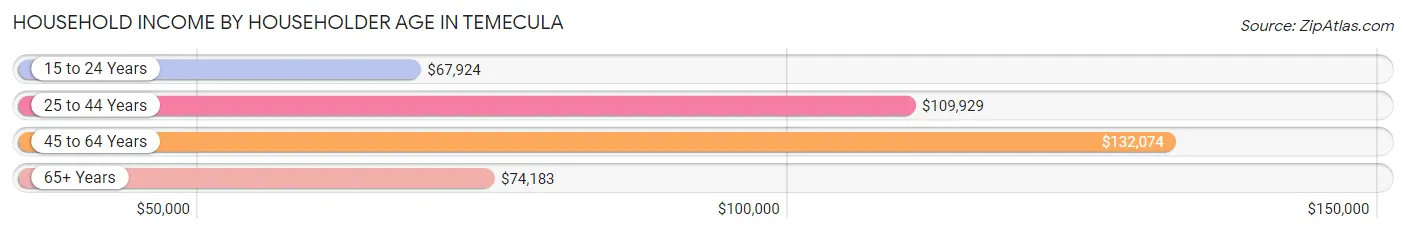
Household Income by Householder Age in Temecula
The median household income in Temecula is $111,881, with the highest median household income of $132,074 found in the 45 to 64 years age bracket for the primary householder. A total of 14,671 households (41.9%) fall into this category. Meanwhile, the 15 to 24 years age bracket for the primary householder has the lowest median household income of $67,924, with 651 households (1.9%) in this group.
| Income Bracket | # Households | Median Income |
| 15 to 24 Years | 651 (1.9%) | $67,924 |
| 25 to 44 Years | 12,616 (36.0%) | $109,929 |
| 45 to 64 Years | 14,671 (41.9%) | $132,074 |
| 65+ Years | 7,074 (20.2%) | $74,183 |
| Total | 35,012 (100.0%) | $111,881 |
Poverty in Temecula
Income Below Poverty by Sex and Age in Temecula
With 6.8% poverty level for males and 8.8% for females among the residents of Temecula, 15 year old males and 15 year old females are the most vulnerable to poverty, with 175 males (22.0%) and 185 females (20.6%) in their respective age groups living below the poverty level.
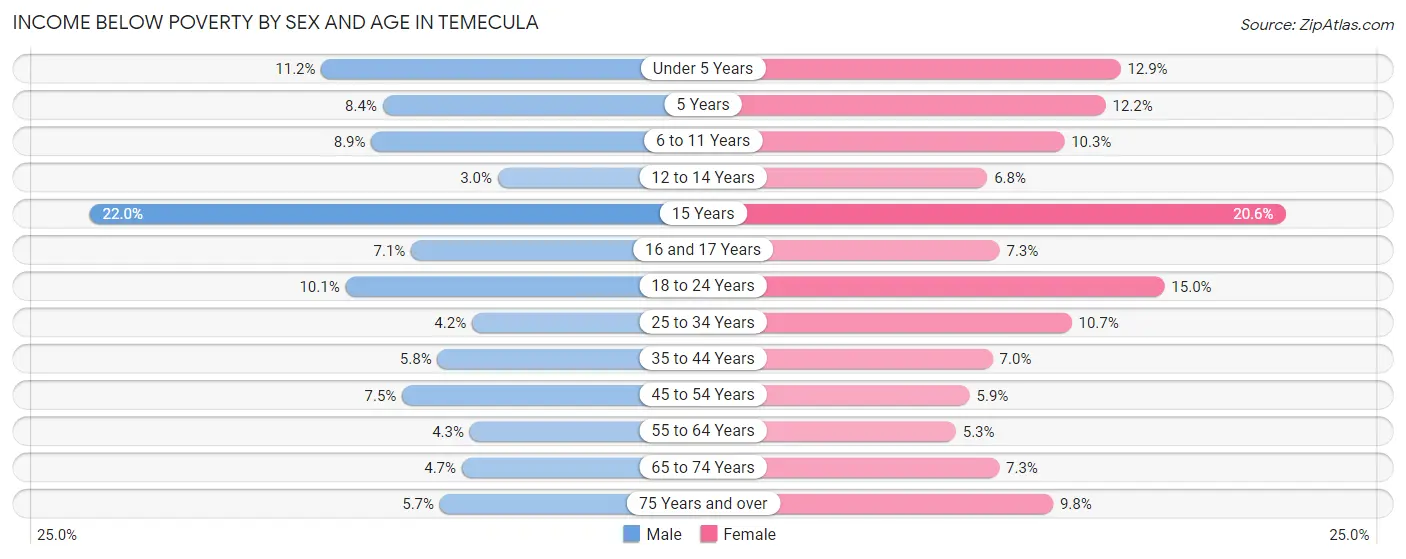
| Age Bracket | Male | Female |
| Under 5 Years | 368 (11.2%) | 502 (12.9%) |
| 5 Years | 87 (8.4%) | 104 (12.2%) |
| 6 to 11 Years | 502 (8.9%) | 455 (10.3%) |
| 12 to 14 Years | 87 (3.0%) | 196 (6.8%) |
| 15 Years | 175 (22.0%) | 185 (20.6%) |
| 16 and 17 Years | 121 (7.1%) | 138 (7.3%) |
| 18 to 24 Years | 442 (10.1%) | 590 (15.0%) |
| 25 to 34 Years | 279 (4.2%) | 771 (10.7%) |
| 35 to 44 Years | 460 (5.8%) | 562 (7.0%) |
| 45 to 54 Years | 554 (7.5%) | 409 (5.9%) |
| 55 to 64 Years | 313 (4.3%) | 375 (5.3%) |
| 65 to 74 Years | 163 (4.7%) | 323 (7.3%) |
| 75 Years and over | 112 (5.7%) | 292 (9.8%) |
| Total | 3,663 (6.8%) | 4,902 (8.8%) |
Income Above Poverty by Sex and Age in Temecula
According to the poverty statistics in Temecula, males aged 12 to 14 years and females aged 55 to 64 years are the age groups that are most secure financially, with 97.0% of males and 94.7% of females in these age groups living above the poverty line.
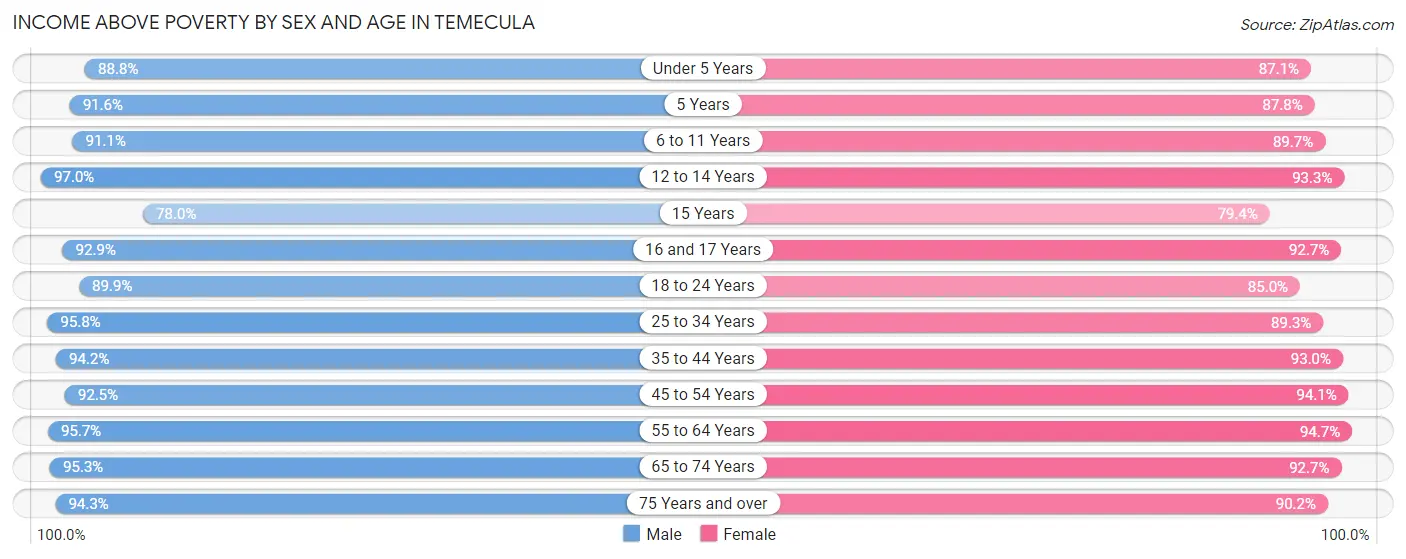
| Age Bracket | Male | Female |
| Under 5 Years | 2,910 (88.8%) | 3,380 (87.1%) |
| 5 Years | 951 (91.6%) | 746 (87.8%) |
| 6 to 11 Years | 5,131 (91.1%) | 3,954 (89.7%) |
| 12 to 14 Years | 2,771 (97.0%) | 2,709 (93.2%) |
| 15 Years | 621 (78.0%) | 714 (79.4%) |
| 16 and 17 Years | 1,593 (92.9%) | 1,747 (92.7%) |
| 18 to 24 Years | 3,929 (89.9%) | 3,352 (85.0%) |
| 25 to 34 Years | 6,304 (95.8%) | 6,465 (89.3%) |
| 35 to 44 Years | 7,413 (94.2%) | 7,470 (93.0%) |
| 45 to 54 Years | 6,857 (92.5%) | 6,488 (94.1%) |
| 55 to 64 Years | 6,905 (95.7%) | 6,717 (94.7%) |
| 65 to 74 Years | 3,297 (95.3%) | 4,102 (92.7%) |
| 75 Years and over | 1,842 (94.3%) | 2,688 (90.2%) |
| Total | 50,524 (93.2%) | 50,532 (91.2%) |
Income Below Poverty Among Married-Couple Families in Temecula
The poverty statistics for married-couple families in Temecula show that 3.6% or 807 of the total 22,512 families live below the poverty line. Families with 5 or more children have the highest poverty rate of 20.0%, comprising of 18 families. On the other hand, families with 1 or 2 children have the lowest poverty rate of 2.1%, which includes 192 families.
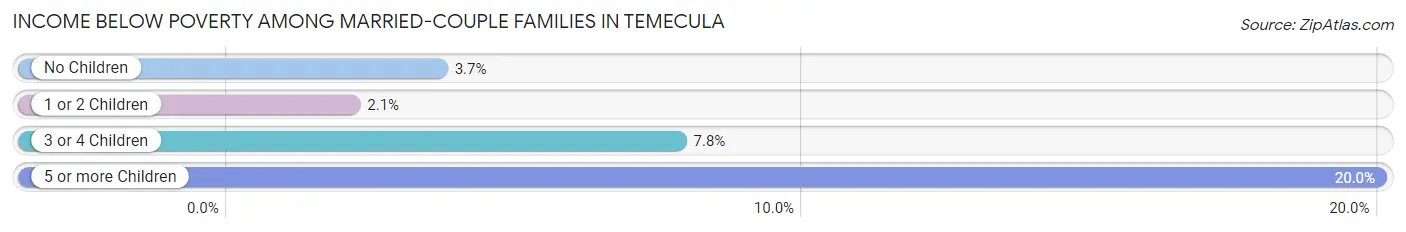
| Children | Above Poverty | Below Poverty |
| No Children | 10,422 (96.4%) | 395 (3.6%) |
| 1 or 2 Children | 8,827 (97.9%) | 192 (2.1%) |
| 3 or 4 Children | 2,384 (92.2%) | 202 (7.8%) |
| 5 or more Children | 72 (80.0%) | 18 (20.0%) |
| Total | 21,705 (96.4%) | 807 (3.6%) |
Income Below Poverty Among Single-Parent Households in Temecula
According to the poverty data in Temecula, 6.5% or 104 single-father households and 18.5% or 741 single-mother households are living below the poverty line. Among single-father households, those with 1 or 2 children have the highest poverty rate, with 69 households (9.8%) experiencing poverty. Likewise, among single-mother households, those with 3 or 4 children have the highest poverty rate, with 166 households (49.4%) falling below the poverty line.
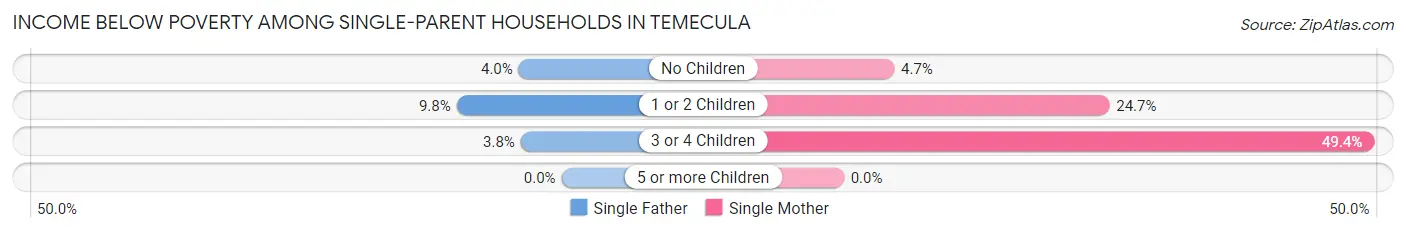
| Children | Single Father | Single Mother |
| No Children | 28 (4.0%) | 78 (4.7%) |
| 1 or 2 Children | 69 (9.8%) | 497 (24.7%) |
| 3 or 4 Children | 7 (3.8%) | 166 (49.4%) |
| 5 or more Children | 0 (0.0%) | 0 (0.0%) |
| Total | 104 (6.5%) | 741 (18.5%) |
Income Below Poverty Among Married-Couple vs Single-Parent Households in Temecula
The poverty data for Temecula shows that 807 of the married-couple family households (3.6%) and 845 of the single-parent households (15.1%) are living below the poverty level. Within the married-couple family households, those with 5 or more children have the highest poverty rate, with 18 households (20.0%) falling below the poverty line. Among the single-parent households, those with 3 or 4 children have the highest poverty rate, with 173 household (33.3%) living below poverty.
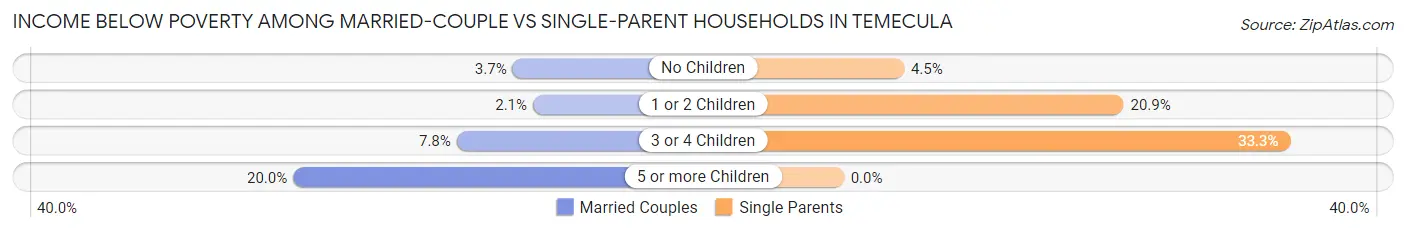
| Children | Married-Couple Families | Single-Parent Households |
| No Children | 395 (3.6%) | 106 (4.5%) |
| 1 or 2 Children | 192 (2.1%) | 566 (20.8%) |
| 3 or 4 Children | 202 (7.8%) | 173 (33.3%) |
| 5 or more Children | 18 (20.0%) | 0 (0.0%) |
| Total | 807 (3.6%) | 845 (15.1%) |
Race in Temecula
The most populous races in Temecula are White / Caucasian (66,807 | 60.7%), Hispanic or Latino (31,478 | 28.6%), and Two or more Races (15,443 | 14.0%).
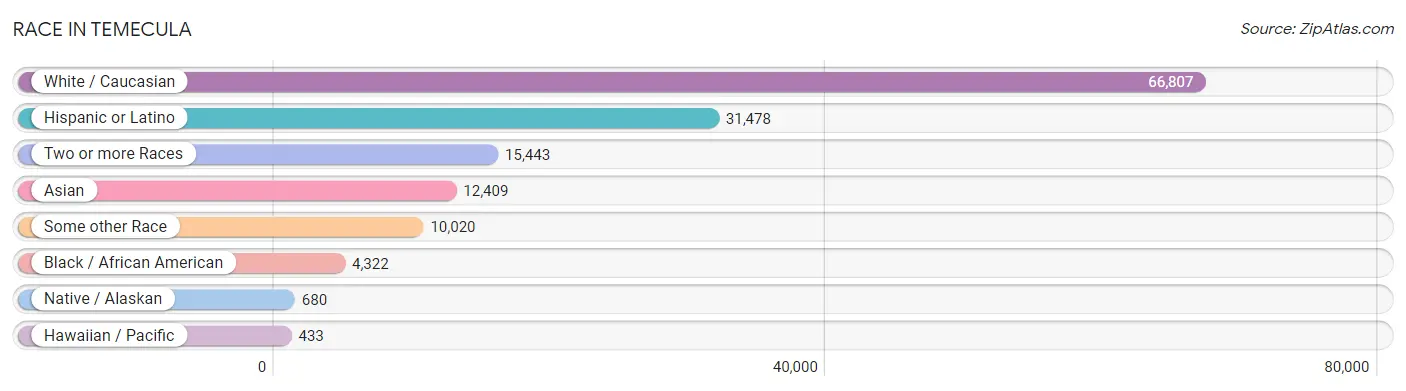
| Race | # Population | % Population |
| Asian | 12,409 | 11.3% |
| Black / African American | 4,322 | 3.9% |
| Hawaiian / Pacific | 433 | 0.4% |
| Hispanic or Latino | 31,478 | 28.6% |
| Native / Alaskan | 680 | 0.6% |
| White / Caucasian | 66,807 | 60.7% |
| Two or more Races | 15,443 | 14.0% |
| Some other Race | 10,020 | 9.1% |
| Total | 110,114 | 100.0% |
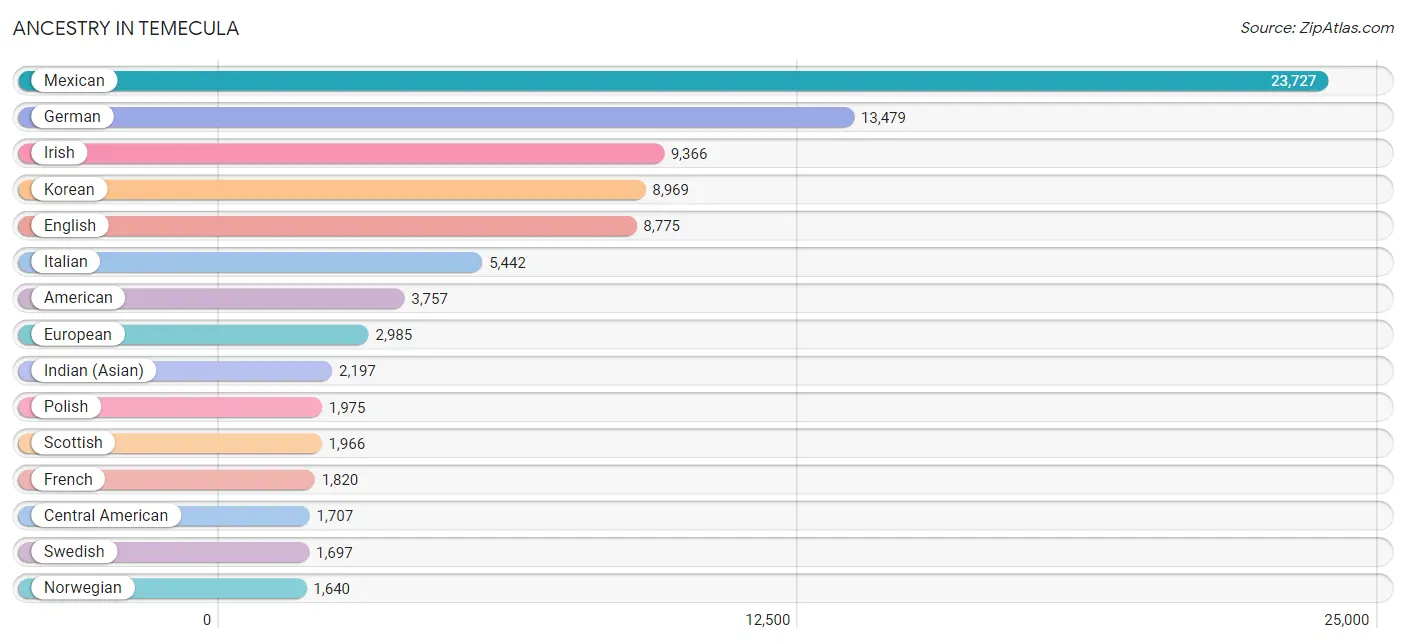
Ancestry in Temecula
The most populous ancestries reported in Temecula are Mexican (23,727 | 21.5%), German (13,479 | 12.2%), Irish (9,366 | 8.5%), Korean (8,969 | 8.2%), and English (8,775 | 8.0%), together accounting for 58.4% of all Temecula residents.
| Ancestry | # Population | % Population |
| Afghan | 327 | 0.3% |
| African | 240 | 0.2% |
| American | 3,757 | 3.4% |
| Apache | 86 | 0.1% |
| Arab | 778 | 0.7% |
| Argentinean | 211 | 0.2% |
| Armenian | 103 | 0.1% |
| Assyrian / Chaldean / Syriac | 91 | 0.1% |
| Australian | 14 | 0.0% |
| Austrian | 250 | 0.2% |
| Bangladeshi | 204 | 0.2% |
| Barbadian | 10 | 0.0% |
| Basque | 14 | 0.0% |
| Belgian | 23 | 0.0% |
| Belizean | 96 | 0.1% |
| Bhutanese | 1,127 | 1.0% |
| Blackfeet | 110 | 0.1% |
| Brazilian | 62 | 0.1% |
| British | 994 | 0.9% |
| Bulgarian | 36 | 0.0% |
| Burmese | 1,090 | 1.0% |
| Canadian | 251 | 0.2% |
| Cape Verdean | 8 | 0.0% |
| Celtic | 7 | 0.0% |
| Central American | 1,707 | 1.5% |
| Central American Indian | 252 | 0.2% |
| Cherokee | 435 | 0.4% |
| Chickasaw | 7 | 0.0% |
| Chilean | 138 | 0.1% |
| Choctaw | 16 | 0.0% |
| Colombian | 777 | 0.7% |
| Costa Rican | 139 | 0.1% |
| Croatian | 215 | 0.2% |
| Cuban | 719 | 0.6% |
| Czech | 532 | 0.5% |
| Czechoslovakian | 234 | 0.2% |
| Danish | 516 | 0.5% |
| Delaware | 6 | 0.0% |
| Dominican | 108 | 0.1% |
| Dutch | 742 | 0.7% |
| Eastern European | 321 | 0.3% |
| Ecuadorian | 164 | 0.2% |
| Egyptian | 192 | 0.2% |
| English | 8,775 | 8.0% |
| European | 2,985 | 2.7% |
| Filipino | 159 | 0.1% |
| Finnish | 253 | 0.2% |
| French | 1,820 | 1.7% |
| French American Indian | 20 | 0.0% |
| French Canadian | 362 | 0.3% |
| German | 13,479 | 12.2% |
| Ghanaian | 9 | 0.0% |
| Greek | 492 | 0.4% |
| Guamanian / Chamorro | 228 | 0.2% |
| Guatemalan | 714 | 0.6% |
| Guyanese | 134 | 0.1% |
| Honduran | 44 | 0.0% |
| Hungarian | 121 | 0.1% |
| Indian (Asian) | 2,197 | 2.0% |
| Indonesian | 6 | 0.0% |
| Iranian | 473 | 0.4% |
| Iraqi | 77 | 0.1% |
| Irish | 9,366 | 8.5% |
| Iroquois | 6 | 0.0% |
| Italian | 5,442 | 4.9% |
| Jamaican | 12 | 0.0% |
| Japanese | 270 | 0.3% |
| Korean | 8,969 | 8.2% |
| Laotian | 282 | 0.3% |
| Latvian | 21 | 0.0% |
| Lebanese | 221 | 0.2% |
| Liberian | 14 | 0.0% |
| Lithuanian | 38 | 0.0% |
| Luxembourger | 6 | 0.0% |
| Malaysian | 278 | 0.3% |
| Maltese | 67 | 0.1% |
| Mexican | 23,727 | 21.5% |
| Mexican American Indian | 547 | 0.5% |
| Mongolian | 20 | 0.0% |
| Moroccan | 24 | 0.0% |
| Native Hawaiian | 379 | 0.3% |
| Navajo | 11 | 0.0% |
| Nepalese | 27 | 0.0% |
| Nicaraguan | 158 | 0.1% |
| Nigerian | 45 | 0.0% |
| Northern European | 284 | 0.3% |
| Norwegian | 1,640 | 1.5% |
| Osage | 18 | 0.0% |
| Pakistani | 215 | 0.2% |
| Palestinian | 50 | 0.1% |
| Panamanian | 123 | 0.1% |
| Pennsylvania German | 12 | 0.0% |
| Peruvian | 99 | 0.1% |
| Pima | 45 | 0.0% |
| Polish | 1,975 | 1.8% |
| Portuguese | 365 | 0.3% |
| Pueblo | 454 | 0.4% |
| Puerto Rican | 1,130 | 1.0% |
| Puget Sound Salish | 11 | 0.0% |
| Romanian | 93 | 0.1% |
| Russian | 1,330 | 1.2% |
| Salvadoran | 514 | 0.5% |
| Samoan | 256 | 0.2% |
| Scandinavian | 829 | 0.7% |
| Scotch-Irish | 458 | 0.4% |
| Scottish | 1,966 | 1.8% |
| Serbian | 57 | 0.1% |
| Sioux | 31 | 0.0% |
| Slavic | 112 | 0.1% |
| Slovak | 94 | 0.1% |
| Slovene | 34 | 0.0% |
| South African | 14 | 0.0% |
| South American | 1,562 | 1.4% |
| Spaniard | 523 | 0.5% |
| Spanish | 733 | 0.7% |
| Spanish American | 2 | 0.0% |
| Sri Lankan | 828 | 0.7% |
| Subsaharan African | 331 | 0.3% |
| Swedish | 1,697 | 1.5% |
| Swiss | 145 | 0.1% |
| Syrian | 130 | 0.1% |
| Thai | 1,161 | 1.1% |
| Tongan | 274 | 0.3% |
| Trinidadian and Tobagonian | 128 | 0.1% |
| Turkish | 46 | 0.0% |
| Ukrainian | 228 | 0.2% |
| Uruguayan | 57 | 0.1% |
| Venezuelan | 13 | 0.0% |
| Welsh | 555 | 0.5% |
| Yaqui | 81 | 0.1% |
| Yugoslavian | 28 | 0.0% | View All 131 Rows |
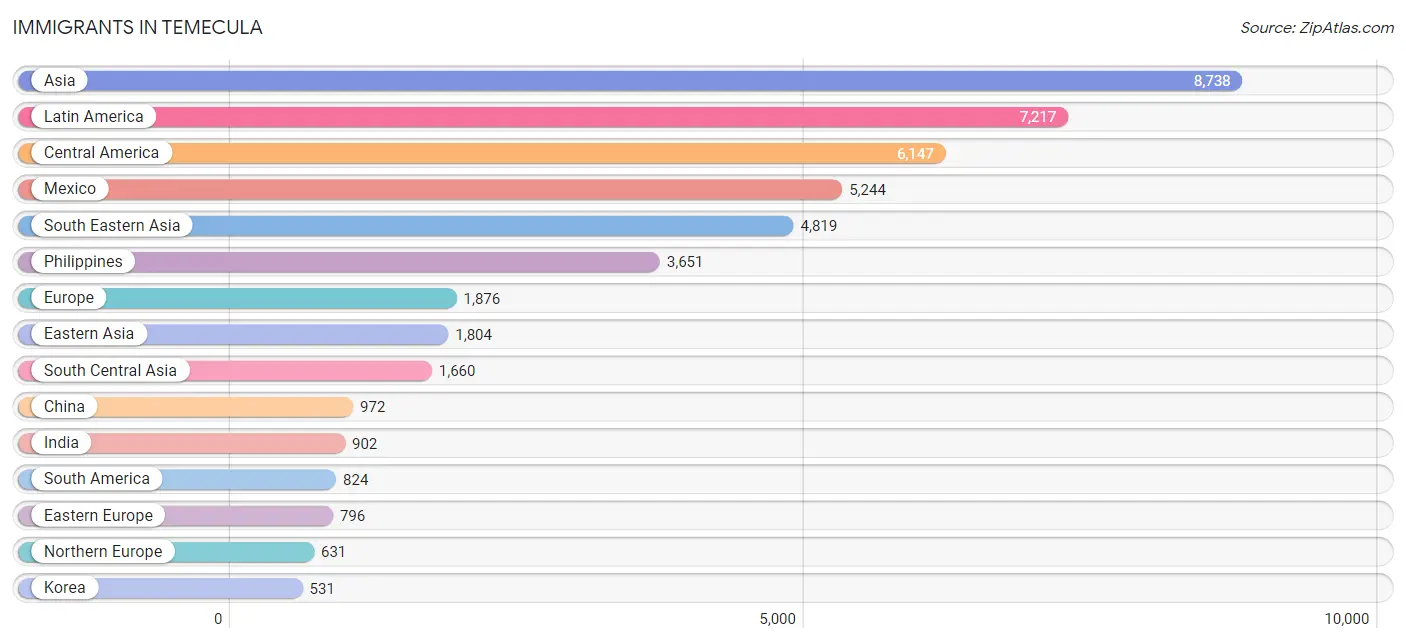
Immigrants in Temecula
The most numerous immigrant groups reported in Temecula came from Asia (8,738 | 7.9%), Latin America (7,217 | 6.6%), Central America (6,147 | 5.6%), Mexico (5,244 | 4.8%), and South Eastern Asia (4,819 | 4.4%), together accounting for 29.2% of all Temecula residents.
| Immigration Origin | # Population | % Population |
| Afghanistan | 192 | 0.2% |
| Africa | 320 | 0.3% |
| Argentina | 204 | 0.2% |
| Asia | 8,738 | 7.9% |
| Australia | 9 | 0.0% |
| Austria | 48 | 0.0% |
| Bangladesh | 49 | 0.0% |
| Barbados | 10 | 0.0% |
| Belize | 76 | 0.1% |
| Brazil | 84 | 0.1% |
| Bulgaria | 66 | 0.1% |
| Cambodia | 145 | 0.1% |
| Canada | 350 | 0.3% |
| Caribbean | 246 | 0.2% |
| Central America | 6,147 | 5.6% |
| Chile | 26 | 0.0% |
| China | 972 | 0.9% |
| Colombia | 189 | 0.2% |
| Costa Rica | 52 | 0.1% |
| Croatia | 6 | 0.0% |
| Cuba | 190 | 0.2% |
| Czechoslovakia | 97 | 0.1% |
| Denmark | 28 | 0.0% |
| Eastern Africa | 71 | 0.1% |
| Eastern Asia | 1,804 | 1.6% |
| Eastern Europe | 796 | 0.7% |
| Ecuador | 76 | 0.1% |
| Egypt | 132 | 0.1% |
| El Salvador | 238 | 0.2% |
| England | 201 | 0.2% |
| Europe | 1,876 | 1.7% |
| France | 24 | 0.0% |
| Germany | 219 | 0.2% |
| Ghana | 9 | 0.0% |
| Greece | 18 | 0.0% |
| Guatemala | 397 | 0.4% |
| Guyana | 80 | 0.1% |
| Honduras | 15 | 0.0% |
| Hong Kong | 22 | 0.0% |
| Hungary | 19 | 0.0% |
| India | 902 | 0.8% |
| Indonesia | 71 | 0.1% |
| Iran | 441 | 0.4% |
| Iraq | 262 | 0.2% |
| Ireland | 89 | 0.1% |
| Italy | 36 | 0.0% |
| Japan | 301 | 0.3% |
| Kazakhstan | 20 | 0.0% |
| Kenya | 63 | 0.1% |
| Korea | 531 | 0.5% |
| Laos | 181 | 0.2% |
| Latin America | 7,217 | 6.6% |
| Latvia | 6 | 0.0% |
| Lebanon | 54 | 0.1% |
| Liberia | 14 | 0.0% |
| Malaysia | 31 | 0.0% |
| Mexico | 5,244 | 4.8% |
| Moldova | 13 | 0.0% |
| Morocco | 16 | 0.0% |
| Netherlands | 47 | 0.0% |
| Nicaragua | 101 | 0.1% |
| Nigeria | 15 | 0.0% |
| Northern Africa | 148 | 0.1% |
| Northern Europe | 631 | 0.6% |
| Norway | 14 | 0.0% |
| Oceania | 73 | 0.1% |
| Pakistan | 31 | 0.0% |
| Panama | 16 | 0.0% |
| Peru | 95 | 0.1% |
| Philippines | 3,651 | 3.3% |
| Poland | 37 | 0.0% |
| Portugal | 20 | 0.0% |
| Romania | 43 | 0.0% |
| Russia | 368 | 0.3% |
| Saudi Arabia | 48 | 0.0% |
| Scotland | 161 | 0.2% |
| Singapore | 28 | 0.0% |
| South Africa | 14 | 0.0% |
| South America | 824 | 0.7% |
| South Central Asia | 1,660 | 1.5% |
| South Eastern Asia | 4,819 | 4.4% |
| Southern Europe | 95 | 0.1% |
| Spain | 16 | 0.0% |
| Sweden | 19 | 0.0% |
| Switzerland | 16 | 0.0% |
| Syria | 77 | 0.1% |
| Taiwan | 178 | 0.2% |
| Thailand | 187 | 0.2% |
| Trinidad and Tobago | 46 | 0.0% |
| Turkey | 14 | 0.0% |
| Ukraine | 91 | 0.1% |
| Uruguay | 57 | 0.1% |
| Uzbekistan | 25 | 0.0% |
| Venezuela | 13 | 0.0% |
| Vietnam | 519 | 0.5% |
| Western Africa | 38 | 0.0% |
| Western Asia | 455 | 0.4% |
| Western Europe | 354 | 0.3% | View All 98 Rows |
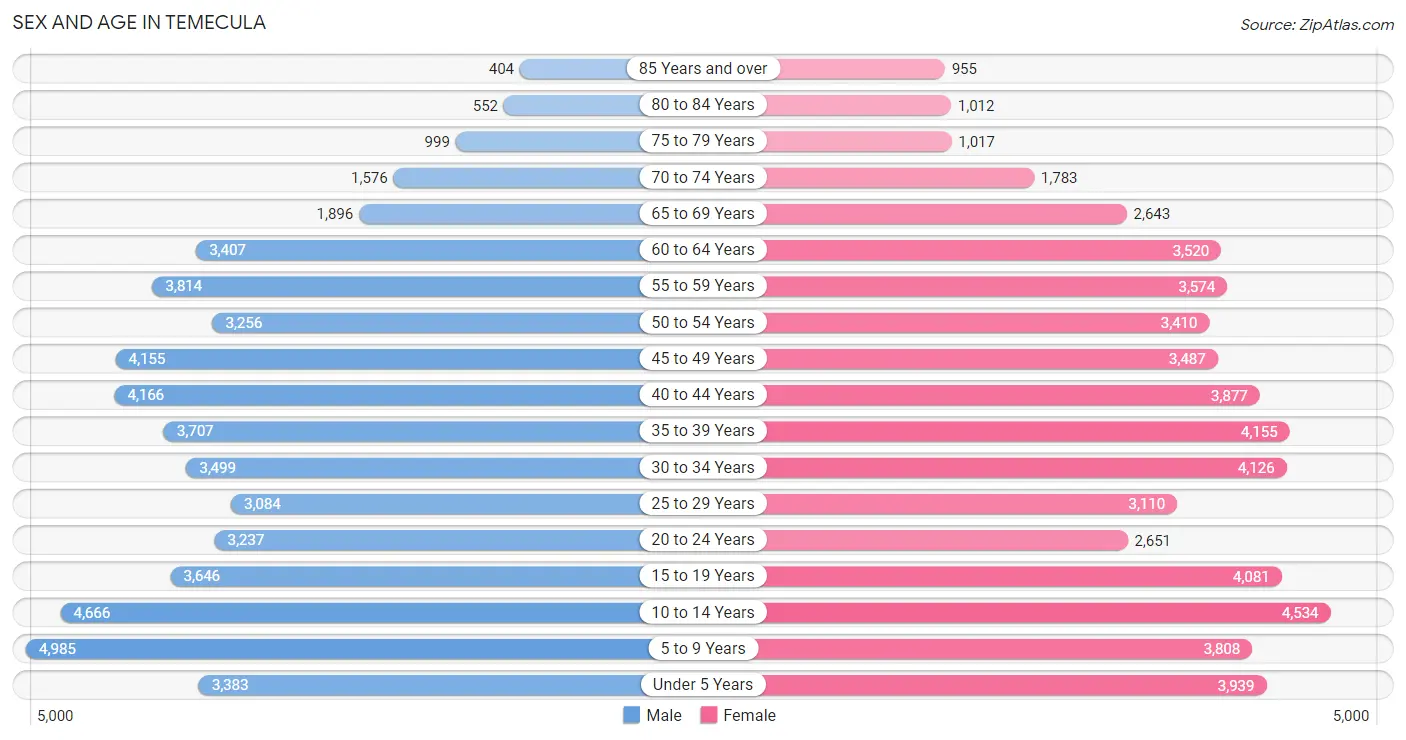
Sex and Age in Temecula
Sex and Age in Temecula
The most populous age groups in Temecula are 5 to 9 Years (4,985 | 9.2%) for men and 10 to 14 Years (4,534 | 8.1%) for women.
| Age Bracket | Male | Female |
| Under 5 Years | 3,383 (6.2%) | 3,939 (7.1%) |
| 5 to 9 Years | 4,985 (9.2%) | 3,808 (6.8%) |
| 10 to 14 Years | 4,666 (8.6%) | 4,534 (8.1%) |
| 15 to 19 Years | 3,646 (6.7%) | 4,081 (7.3%) |
| 20 to 24 Years | 3,237 (5.9%) | 2,651 (4.8%) |
| 25 to 29 Years | 3,084 (5.7%) | 3,110 (5.6%) |
| 30 to 34 Years | 3,499 (6.4%) | 4,126 (7.4%) |
| 35 to 39 Years | 3,707 (6.8%) | 4,155 (7.5%) |
| 40 to 44 Years | 4,166 (7.6%) | 3,877 (7.0%) |
| 45 to 49 Years | 4,155 (7.6%) | 3,487 (6.3%) |
| 50 to 54 Years | 3,256 (6.0%) | 3,410 (6.1%) |
| 55 to 59 Years | 3,814 (7.0%) | 3,574 (6.4%) |
| 60 to 64 Years | 3,407 (6.3%) | 3,520 (6.3%) |
| 65 to 69 Years | 1,896 (3.5%) | 2,643 (4.8%) |
| 70 to 74 Years | 1,576 (2.9%) | 1,783 (3.2%) |
| 75 to 79 Years | 999 (1.8%) | 1,017 (1.8%) |
| 80 to 84 Years | 552 (1.0%) | 1,012 (1.8%) |
| 85 Years and over | 404 (0.7%) | 955 (1.7%) |
| Total | 54,432 (100.0%) | 55,682 (100.0%) |
Families and Households in Temecula
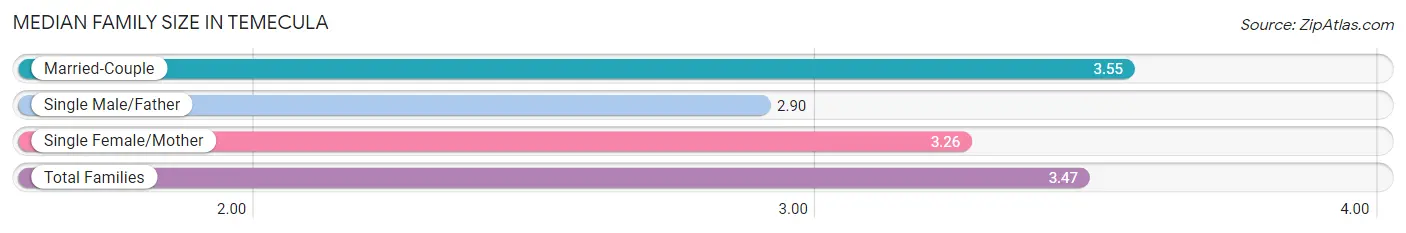
Median Family Size in Temecula
The median family size in Temecula is 3.47 persons per family, with married-couple families (22,512 | 80.1%) accounting for the largest median family size of 3.55 persons per family. On the other hand, single male/father families (1,591 | 5.7%) represent the smallest median family size with 2.90 persons per family.
| Family Type | # Families | Family Size |
| Married-Couple | 22,512 (80.1%) | 3.55 |
| Single Male/Father | 1,591 (5.7%) | 2.90 |
| Single Female/Mother | 4,005 (14.2%) | 3.26 |
| Total Families | 28,108 (100.0%) | 3.47 |
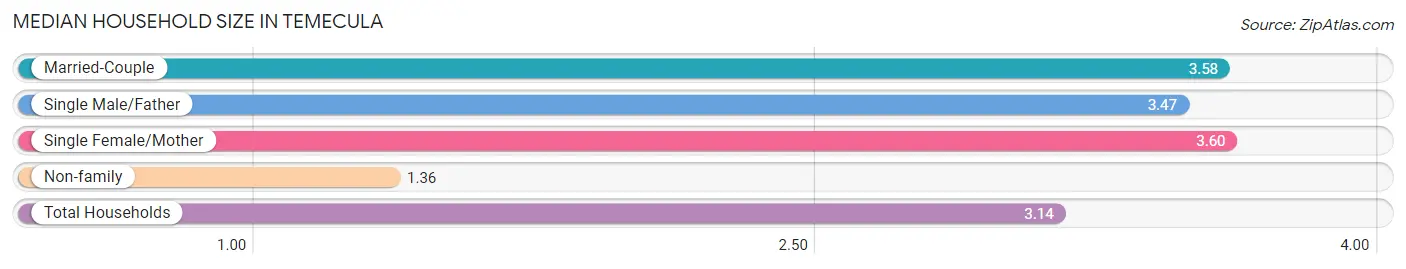
Median Household Size in Temecula
The median household size in Temecula is 3.14 persons per household, with single female/mother households (4,005 | 11.4%) accounting for the largest median household size of 3.6 persons per household. non-family households (6,904 | 19.7%) represent the smallest median household size with 1.36 persons per household.
| Household Type | # Households | Household Size |
| Married-Couple | 22,512 (64.3%) | 3.58 |
| Single Male/Father | 1,591 (4.5%) | 3.47 |
| Single Female/Mother | 4,005 (11.4%) | 3.60 |
| Non-family | 6,904 (19.7%) | 1.36 |
| Total Households | 35,012 (100.0%) | 3.14 |
Household Size by Marriage Status in Temecula
Out of a total of 35,012 households in Temecula, 28,108 (80.3%) are family households, while 6,904 (19.7%) are nonfamily households. The most numerous type of family households are 2-person households, comprising 9,101, and the most common type of nonfamily households are 1-person households, comprising 5,250.
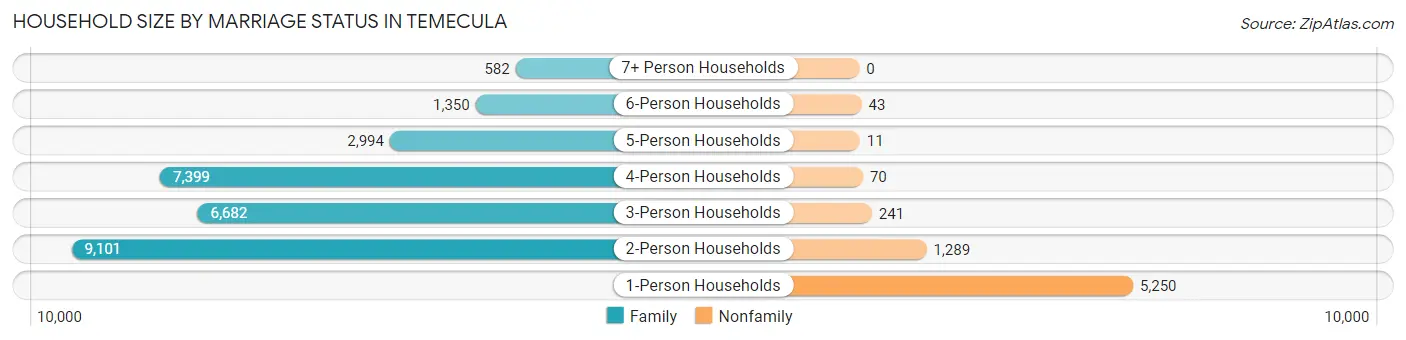
| Household Size | Family Households | Nonfamily Households |
| 1-Person Households | - | 5,250 (15.0%) |
| 2-Person Households | 9,101 (26.0%) | 1,289 (3.7%) |
| 3-Person Households | 6,682 (19.1%) | 241 (0.7%) |
| 4-Person Households | 7,399 (21.1%) | 70 (0.2%) |
| 5-Person Households | 2,994 (8.6%) | 11 (0.0%) |
| 6-Person Households | 1,350 (3.9%) | 43 (0.1%) |
| 7+ Person Households | 582 (1.7%) | 0 (0.0%) |
| Total | 28,108 (80.3%) | 6,904 (19.7%) |
Female Fertility in Temecula
Fertility by Age in Temecula
Average fertility rate in Temecula is 38.0 births per 1,000 women. Women in the age bracket of 20 to 34 years have the highest fertility rate with 71.0 births per 1,000 women. Women in the age bracket of 20 to 34 years acount for 71.4% of all women with births.
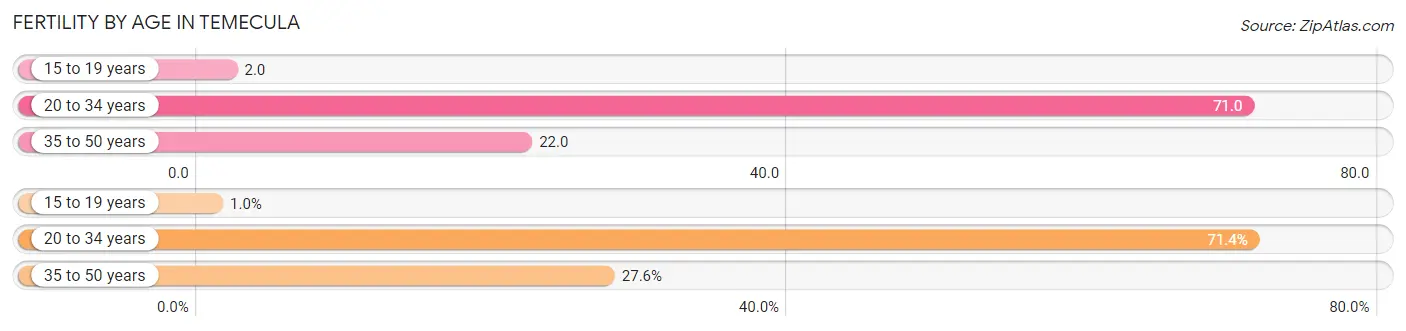
| Age Bracket | Women with Births | Births / 1,000 Women |
| 15 to 19 years | 10 (1.0%) | 2.0 |
| 20 to 34 years | 703 (71.4%) | 71.0 |
| 35 to 50 years | 272 (27.6%) | 22.0 |
| Total | 985 (100.0%) | 38.0 |
Fertility by Age by Marriage Status in Temecula
73.4% of women with births (985) in Temecula are married. The highest percentage of unmarried women with births falls into 15 to 19 years age bracket with 100.0% of them unmarried at the time of birth, while the lowest percentage of unmarried women with births belong to 20 to 34 years age bracket with 21.8% of them unmarried.
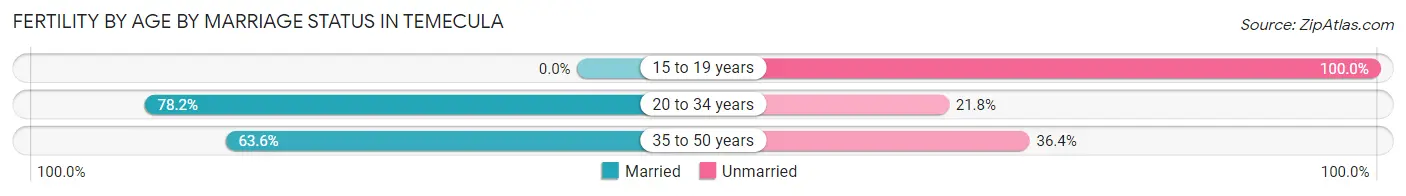
| Age Bracket | Married | Unmarried |
| 15 to 19 years | 0 (0.0%) | 10 (100.0%) |
| 20 to 34 years | 550 (78.2%) | 153 (21.8%) |
| 35 to 50 years | 173 (63.6%) | 99 (36.4%) |
| Total | 723 (73.4%) | 262 (26.6%) |
Fertility by Education in Temecula
Average fertility rate in Temecula is 38.0 births per 1,000 women. Women with the education attainment of college or associate's degree have the highest fertility rate of 51.0 births per 1,000 women, while women with the education attainment of less than high school have the lowest fertility at 12.0 births per 1,000 women. Women with the education attainment of college or associate's degree represent 46.0% of all women with births.
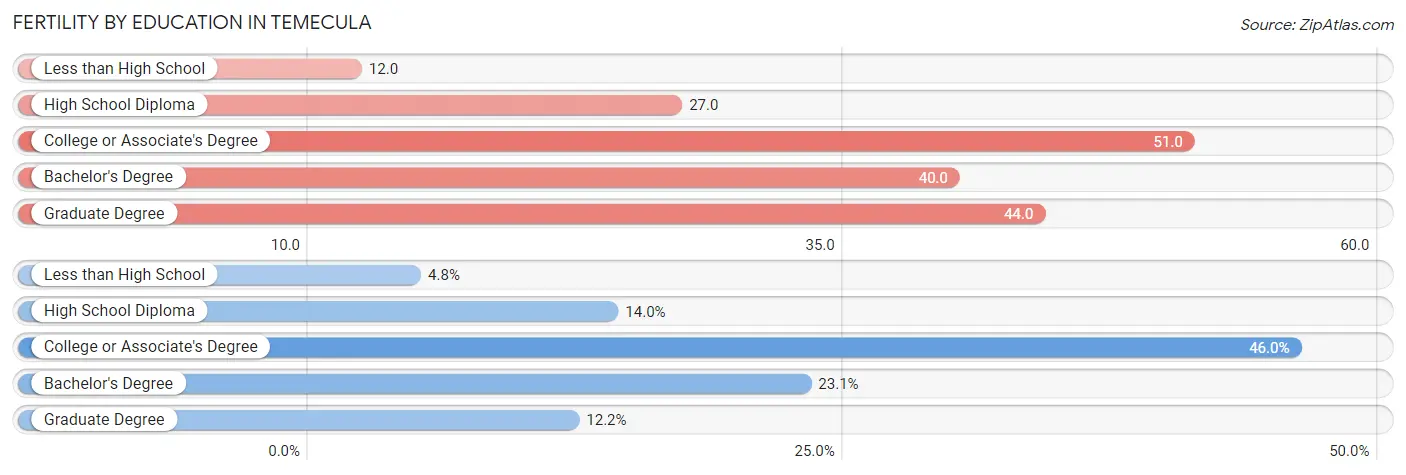
| Educational Attainment | Women with Births | Births / 1,000 Women |
| Less than High School | 47 (4.8%) | 12.0 |
| High School Diploma | 138 (14.0%) | 27.0 |
| College or Associate's Degree | 453 (46.0%) | 51.0 |
| Bachelor's Degree | 227 (23.1%) | 40.0 |
| Graduate Degree | 120 (12.2%) | 44.0 |
| Total | 985 (100.0%) | 38.0 |
Fertility by Education by Marriage Status in Temecula
26.6% of women with births in Temecula are unmarried. Women with the educational attainment of graduate degree are most likely to be married with 91.7% of them married at childbirth, while women with the educational attainment of college or associate's degree are least likely to be married with 37.5% of them unmarried at childbirth.
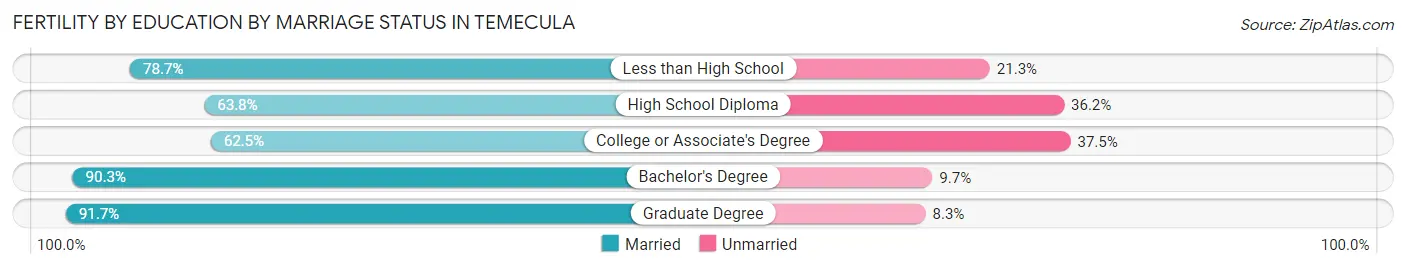
| Educational Attainment | Married | Unmarried |
| Less than High School | 37 (78.7%) | 10 (21.3%) |
| High School Diploma | 88 (63.8%) | 50 (36.2%) |
| College or Associate's Degree | 283 (62.5%) | 170 (37.5%) |
| Bachelor's Degree | 205 (90.3%) | 22 (9.7%) |
| Graduate Degree | 110 (91.7%) | 10 (8.3%) |
| Total | 723 (73.4%) | 262 (26.6%) |
Employment Characteristics in Temecula
Employment by Class of Employer in Temecula
Among the 49,864 employed individuals in Temecula, private company employees (31,721 | 63.6%), local government employees (5,109 | 10.2%), and self-employed (not incorporated) (3,392 | 6.8%) make up the most common classes of employment.
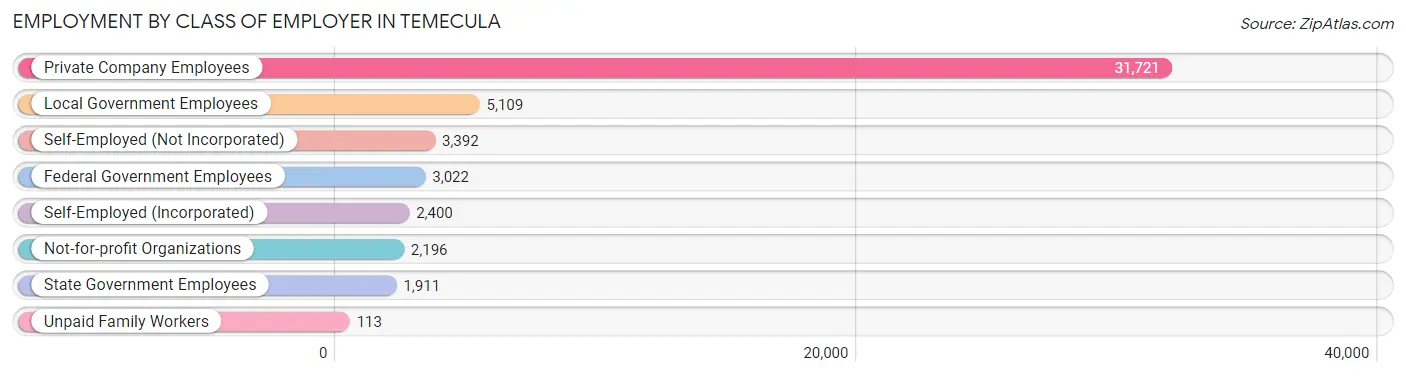
| Employer Class | # Employees | % Employees |
| Private Company Employees | 31,721 | 63.6% |
| Self-Employed (Incorporated) | 2,400 | 4.8% |
| Self-Employed (Not Incorporated) | 3,392 | 6.8% |
| Not-for-profit Organizations | 2,196 | 4.4% |
| Local Government Employees | 5,109 | 10.2% |
| State Government Employees | 1,911 | 3.8% |
| Federal Government Employees | 3,022 | 6.1% |
| Unpaid Family Workers | 113 | 0.2% |
| Total | 49,864 | 100.0% |
Employment Status by Age in Temecula
According to the labor force statistics for Temecula, out of the total population over 16 years of age (83,102), 65.0% or 54,016 individuals are in the labor force, with 5.8% or 3,133 of them unemployed. The age group with the highest labor force participation rate is 45 to 54 years, with 82.9% or 11,861 individuals in the labor force. Within the labor force, the 75 years and over age range has the highest percentage of unemployed individuals, with 27.2% or 81 of them being unemployed.
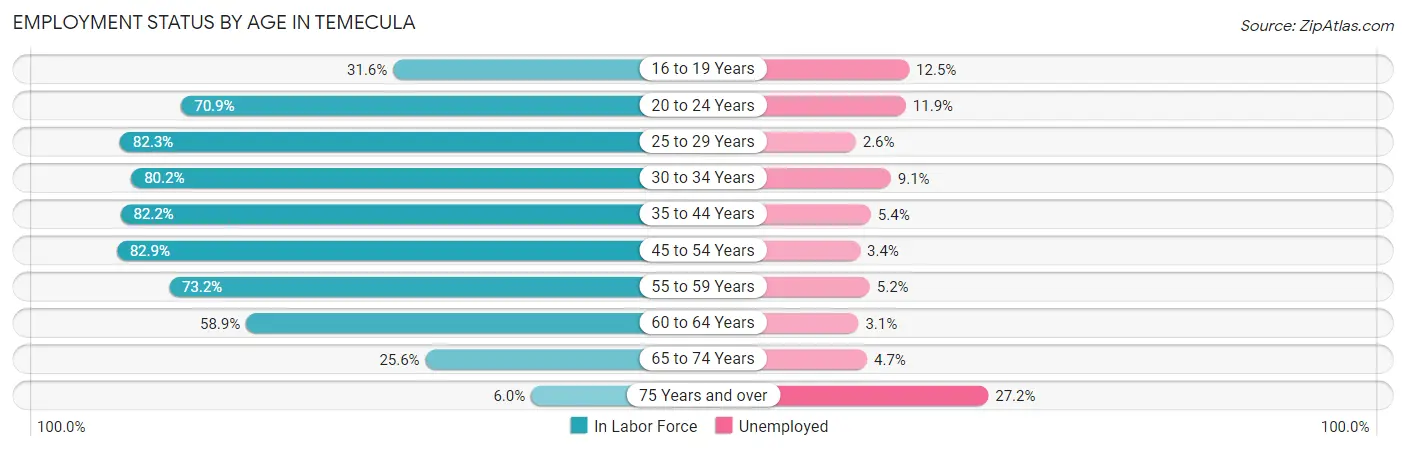
| Age Bracket | In Labor Force | Unemployed |
| 16 to 19 Years | 1,905 (31.6%) | 238 (12.5%) |
| 20 to 24 Years | 4,175 (70.9%) | 497 (11.9%) |
| 25 to 29 Years | 5,098 (82.3%) | 133 (2.6%) |
| 30 to 34 Years | 6,115 (80.2%) | 556 (9.1%) |
| 35 to 44 Years | 13,074 (82.2%) | 706 (5.4%) |
| 45 to 54 Years | 11,861 (82.9%) | 403 (3.4%) |
| 55 to 59 Years | 5,408 (73.2%) | 281 (5.2%) |
| 60 to 64 Years | 4,080 (58.9%) | 126 (3.1%) |
| 65 to 74 Years | 2,022 (25.6%) | 95 (4.7%) |
| 75 Years and over | 296 (6.0%) | 81 (27.2%) |
| Total | 54,016 (65.0%) | 3,133 (5.8%) |
Employment Status by Educational Attainment in Temecula
According to labor force statistics for Temecula, 78.2% of individuals (45,627) out of the total population between 25 and 64 years of age (58,347) are in the labor force, with 4.8% or 2,190 of them being unemployed. The group with the highest labor force participation rate are those with the educational attainment of bachelor's degree or higher, with 83.0% or 18,946 individuals in the labor force. Within the labor force, individuals with college / associate degree education have the highest percentage of unemployment, with 7.5% or 1,258 of them being unemployed.
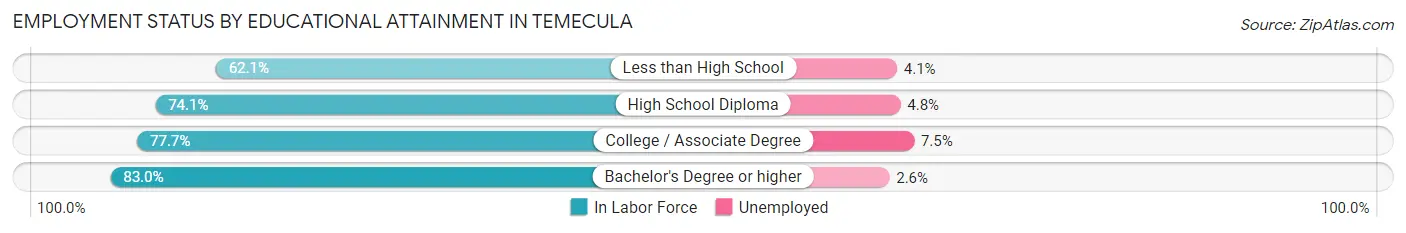
| Educational Attainment | In Labor Force | Unemployed |
| Less than High School | 2,202 (62.1%) | 145 (4.1%) |
| High School Diploma | 7,700 (74.1%) | 499 (4.8%) |
| College / Associate Degree | 16,769 (77.7%) | 1,619 (7.5%) |
| Bachelor's Degree or higher | 18,946 (83.0%) | 594 (2.6%) |
| Total | 45,627 (78.2%) | 2,801 (4.8%) |
Employment Occupations by Sex in Temecula
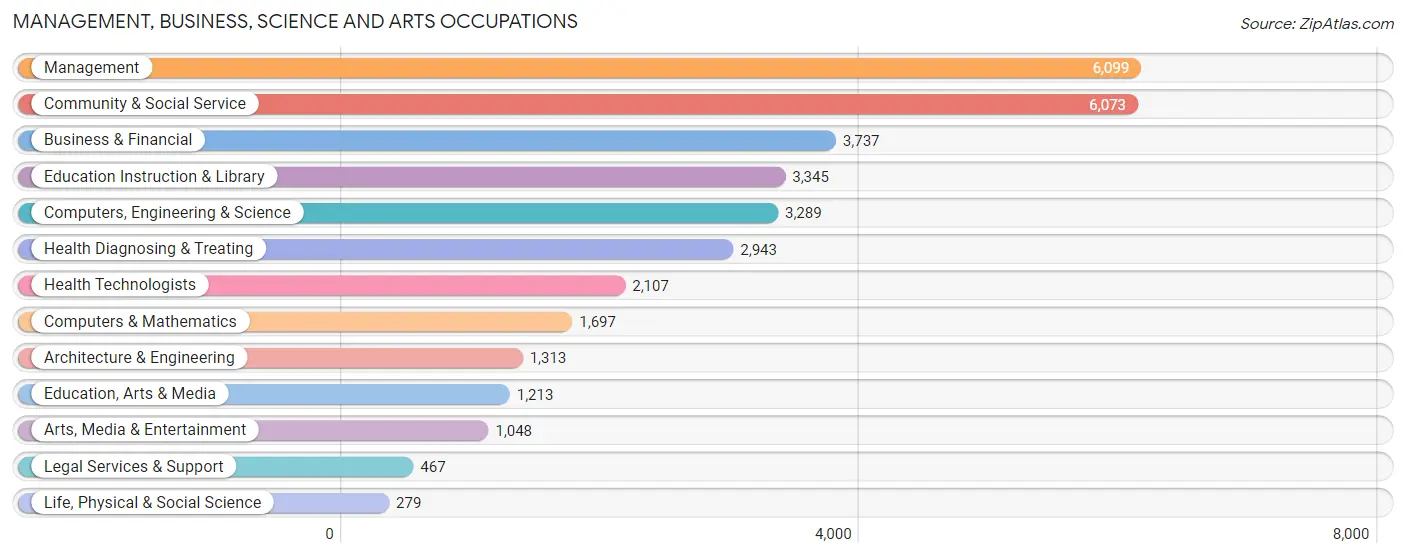
Management, Business, Science and Arts Occupations
The most common Management, Business, Science and Arts occupations in Temecula are Management (6,099 | 12.3%), Community & Social Service (6,073 | 12.2%), Business & Financial (3,737 | 7.5%), Education Instruction & Library (3,345 | 6.7%), and Computers, Engineering & Science (3,289 | 6.6%).
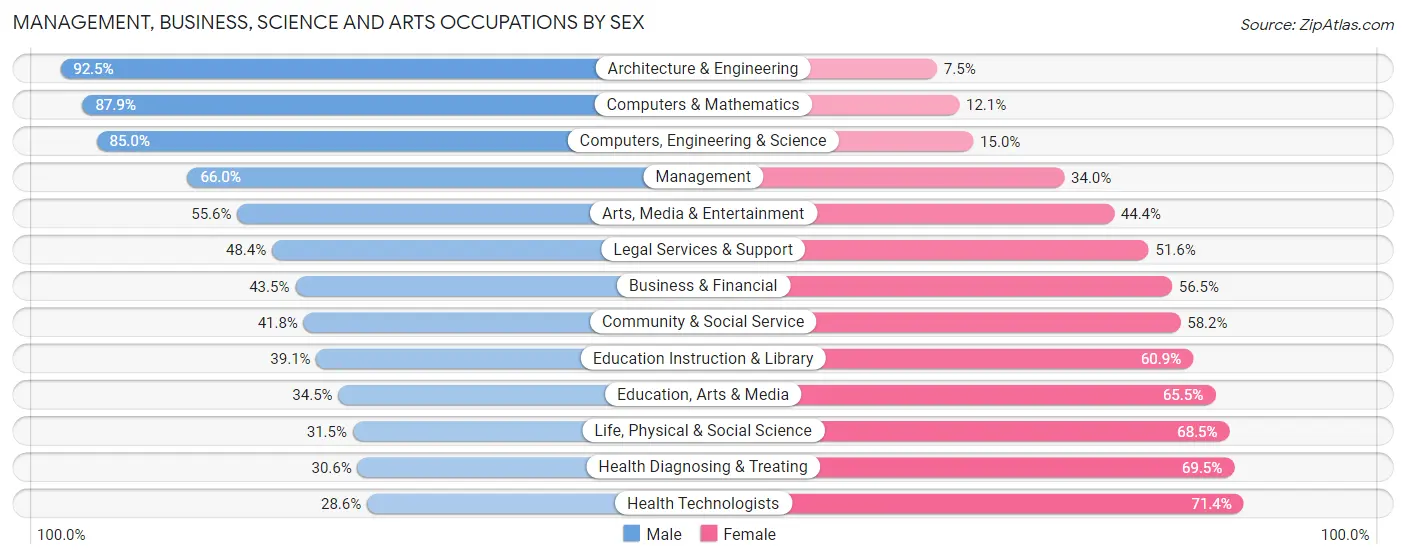
Management, Business, Science and Arts Occupations by Sex
Within the Management, Business, Science and Arts occupations in Temecula, the most male-oriented occupations are Architecture & Engineering (92.5%), Computers & Mathematics (87.9%), and Computers, Engineering & Science (85.0%), while the most female-oriented occupations are Health Technologists (71.4%), Health Diagnosing & Treating (69.5%), and Life, Physical & Social Science (68.5%).
| Occupation | Male | Female |
| Management | 4,026 (66.0%) | 2,073 (34.0%) |
| Business & Financial | 1,627 (43.5%) | 2,110 (56.5%) |
| Computers, Engineering & Science | 2,795 (85.0%) | 494 (15.0%) |
| Computers & Mathematics | 1,492 (87.9%) | 205 (12.1%) |
| Architecture & Engineering | 1,215 (92.5%) | 98 (7.5%) |
| Life, Physical & Social Science | 88 (31.5%) | 191 (68.5%) |
| Community & Social Service | 2,537 (41.8%) | 3,536 (58.2%) |
| Education, Arts & Media | 419 (34.5%) | 794 (65.5%) |
| Legal Services & Support | 226 (48.4%) | 241 (51.6%) |
| Education Instruction & Library | 1,309 (39.1%) | 2,036 (60.9%) |
| Arts, Media & Entertainment | 583 (55.6%) | 465 (44.4%) |
| Health Diagnosing & Treating | 899 (30.5%) | 2,044 (69.5%) |
| Health Technologists | 602 (28.6%) | 1,505 (71.4%) |
| Total (Category) | 11,884 (53.7%) | 10,257 (46.3%) |
| Total (Overall) | 27,234 (54.8%) | 22,433 (45.2%) |
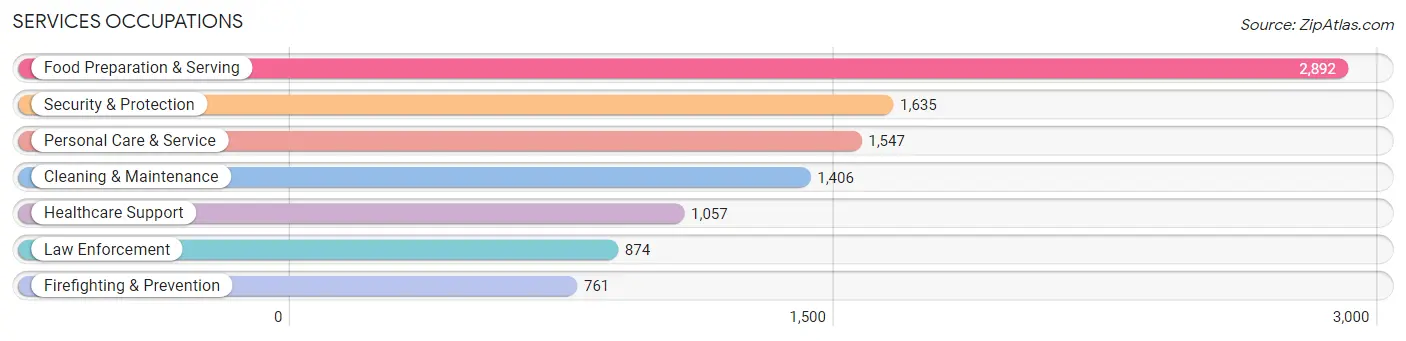
Services Occupations
The most common Services occupations in Temecula are Food Preparation & Serving (2,892 | 5.8%), Security & Protection (1,635 | 3.3%), Personal Care & Service (1,547 | 3.1%), Cleaning & Maintenance (1,406 | 2.8%), and Healthcare Support (1,057 | 2.1%).
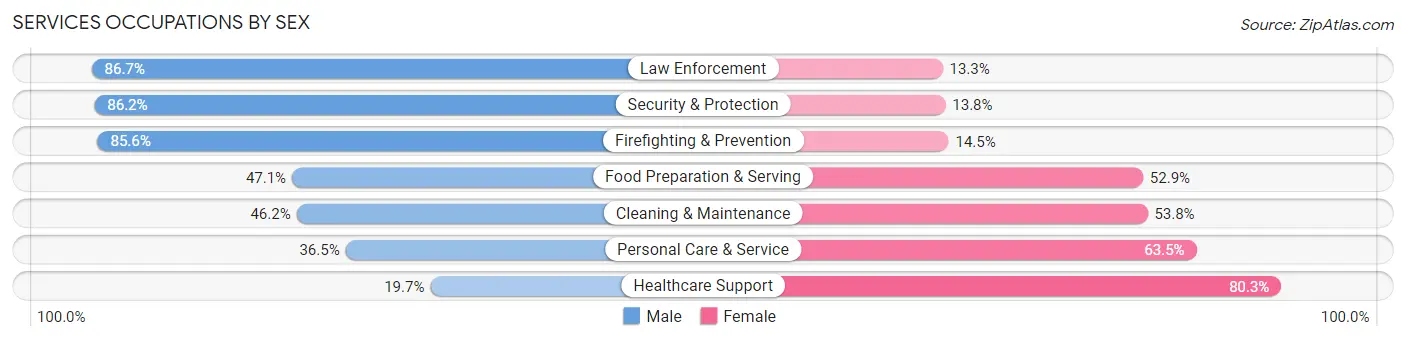
Services Occupations by Sex
Within the Services occupations in Temecula, the most male-oriented occupations are Law Enforcement (86.7%), Security & Protection (86.2%), and Firefighting & Prevention (85.6%), while the most female-oriented occupations are Healthcare Support (80.3%), Personal Care & Service (63.5%), and Cleaning & Maintenance (53.8%).
| Occupation | Male | Female |
| Healthcare Support | 208 (19.7%) | 849 (80.3%) |
| Security & Protection | 1,409 (86.2%) | 226 (13.8%) |
| Firefighting & Prevention | 651 (85.6%) | 110 (14.4%) |
| Law Enforcement | 758 (86.7%) | 116 (13.3%) |
| Food Preparation & Serving | 1,361 (47.1%) | 1,531 (52.9%) |
| Cleaning & Maintenance | 649 (46.2%) | 757 (53.8%) |
| Personal Care & Service | 564 (36.5%) | 983 (63.5%) |
| Total (Category) | 4,191 (49.1%) | 4,346 (50.9%) |
| Total (Overall) | 27,234 (54.8%) | 22,433 (45.2%) |
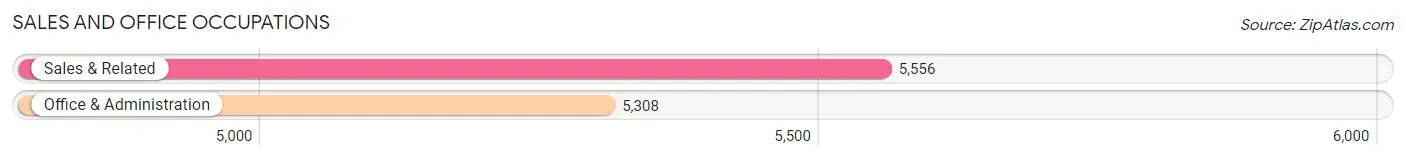
Sales and Office Occupations
The most common Sales and Office occupations in Temecula are Sales & Related (5,556 | 11.2%), and Office & Administration (5,308 | 10.7%).
Sales and Office Occupations by Sex
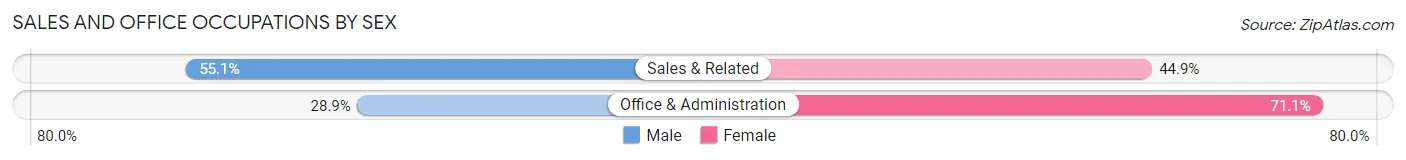
| Occupation | Male | Female |
| Sales & Related | 3,063 (55.1%) | 2,493 (44.9%) |
| Office & Administration | 1,535 (28.9%) | 3,773 (71.1%) |
| Total (Category) | 4,598 (42.3%) | 6,266 (57.7%) |
| Total (Overall) | 27,234 (54.8%) | 22,433 (45.2%) |
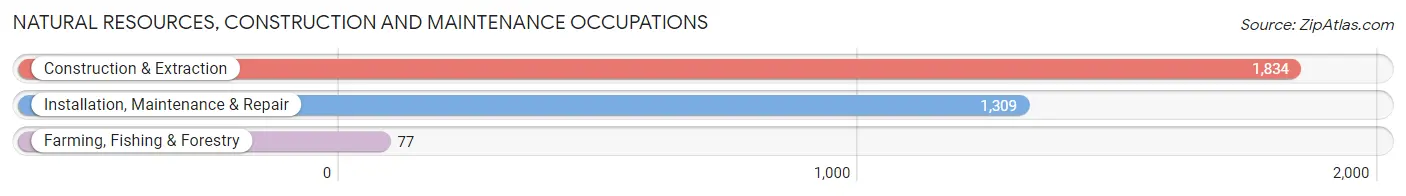
Natural Resources, Construction and Maintenance Occupations
The most common Natural Resources, Construction and Maintenance occupations in Temecula are Construction & Extraction (1,834 | 3.7%), Installation, Maintenance & Repair (1,309 | 2.6%), and Farming, Fishing & Forestry (77 | 0.2%).
Natural Resources, Construction and Maintenance Occupations by Sex
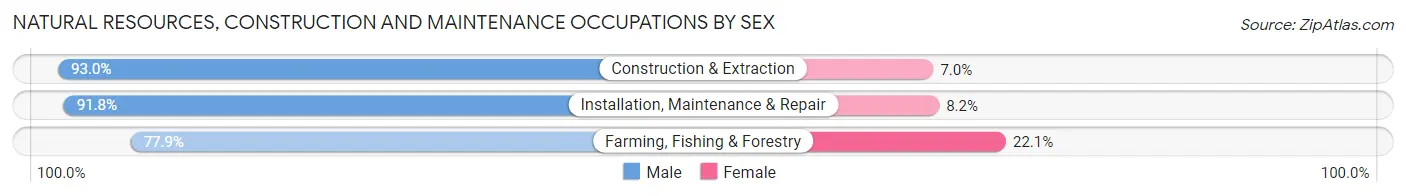
| Occupation | Male | Female |
| Farming, Fishing & Forestry | 60 (77.9%) | 17 (22.1%) |
| Construction & Extraction | 1,706 (93.0%) | 128 (7.0%) |
| Installation, Maintenance & Repair | 1,202 (91.8%) | 107 (8.2%) |
| Total (Category) | 2,968 (92.2%) | 252 (7.8%) |
| Total (Overall) | 27,234 (54.8%) | 22,433 (45.2%) |
Production, Transportation and Moving Occupations
The most common Production, Transportation and Moving occupations in Temecula are Production (1,735 | 3.5%), Material Moving (1,707 | 3.4%), and Transportation (1,463 | 2.9%).
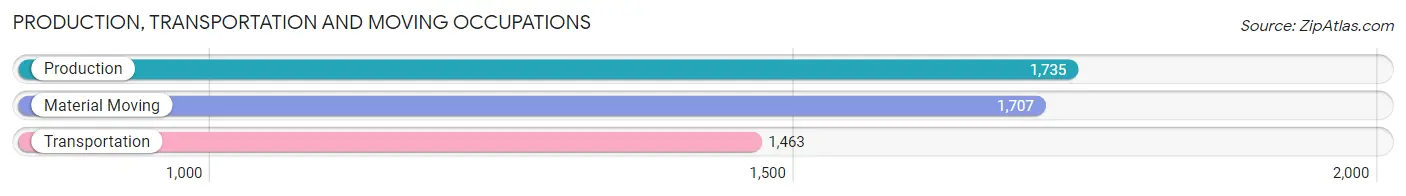
Production, Transportation and Moving Occupations by Sex
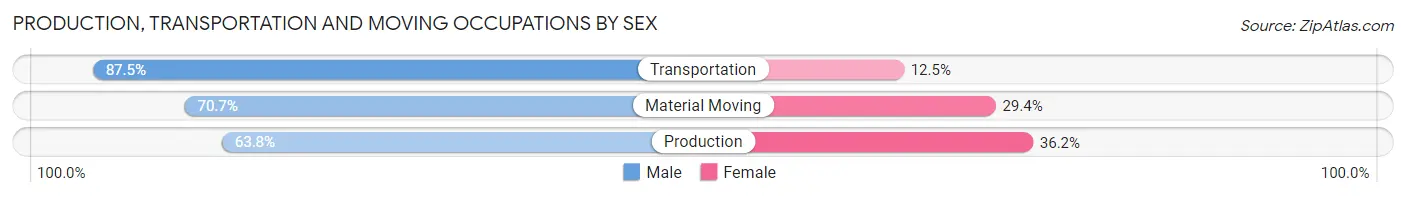
| Occupation | Male | Female |
| Production | 1,107 (63.8%) | 628 (36.2%) |
| Transportation | 1,280 (87.5%) | 183 (12.5%) |
| Material Moving | 1,206 (70.7%) | 501 (29.3%) |
| Total (Category) | 3,593 (73.3%) | 1,312 (26.8%) |
| Total (Overall) | 27,234 (54.8%) | 22,433 (45.2%) |
Employment Industries by Sex in Temecula
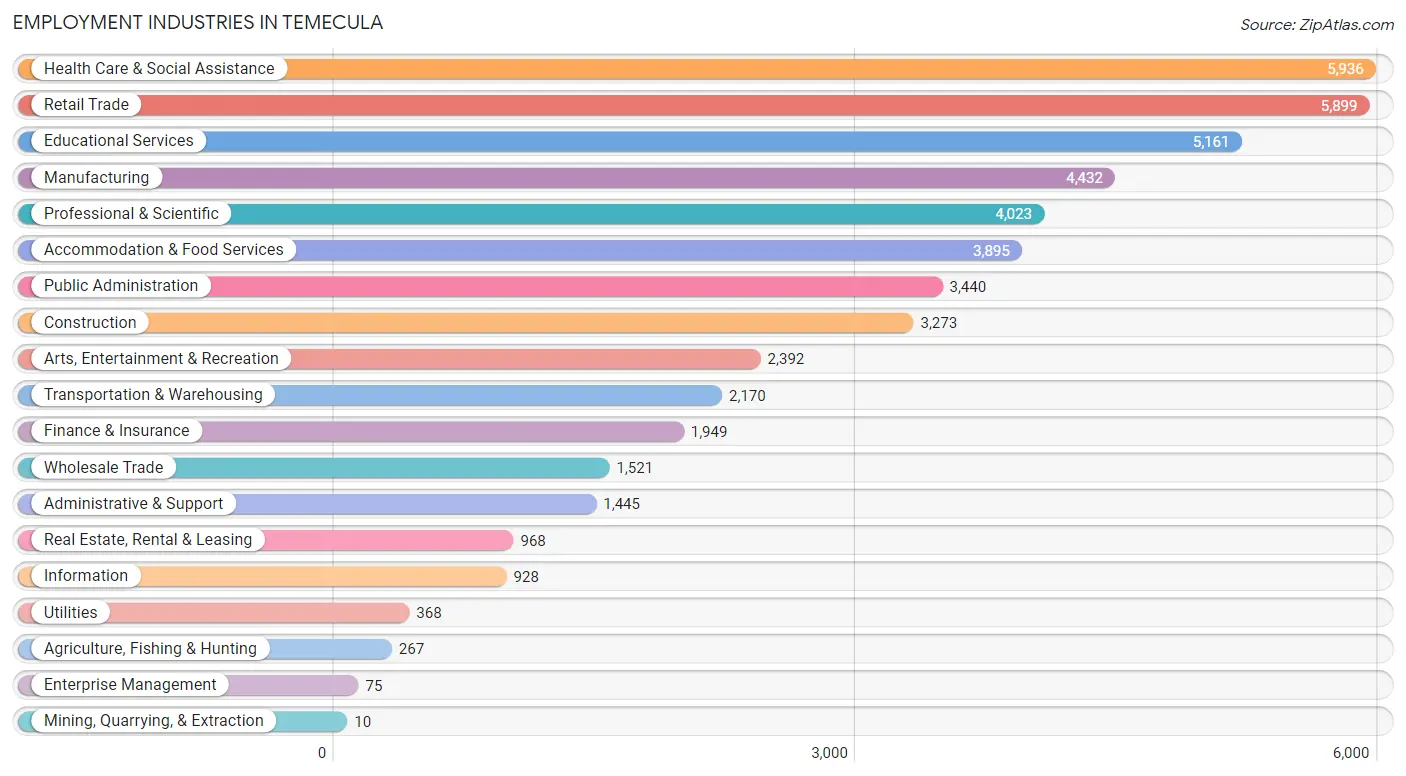
Employment Industries in Temecula
The major employment industries in Temecula include Health Care & Social Assistance (5,936 | 11.9%), Retail Trade (5,899 | 11.9%), Educational Services (5,161 | 10.4%), Manufacturing (4,432 | 8.9%), and Professional & Scientific (4,023 | 8.1%).
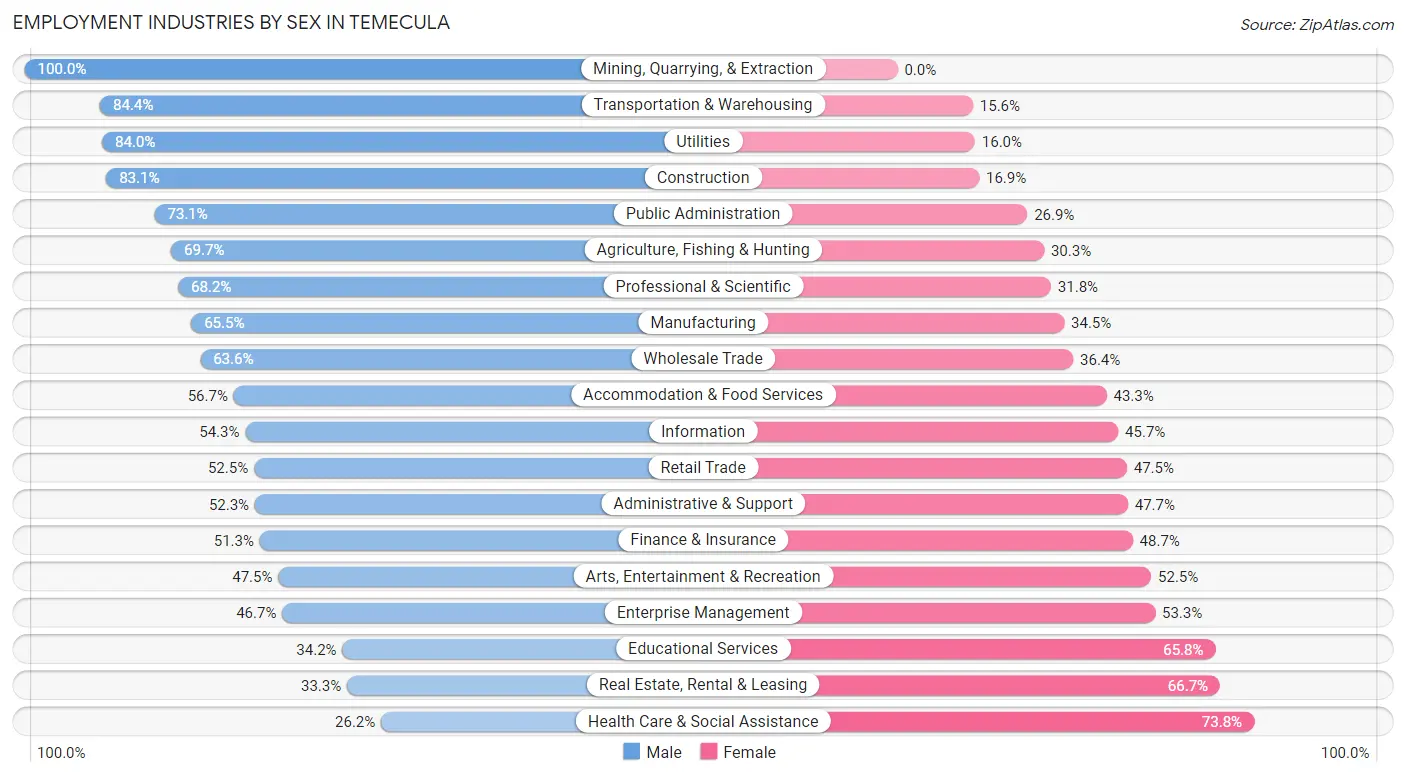
Employment Industries by Sex in Temecula
The Temecula industries that see more men than women are Mining, Quarrying, & Extraction (100.0%), Transportation & Warehousing (84.4%), and Utilities (84.0%), whereas the industries that tend to have a higher number of women are Health Care & Social Assistance (73.8%), Real Estate, Rental & Leasing (66.7%), and Educational Services (65.8%).
| Industry | Male | Female |
| Agriculture, Fishing & Hunting | 186 (69.7%) | 81 (30.3%) |
| Mining, Quarrying, & Extraction | 10 (100.0%) | 0 (0.0%) |
| Construction | 2,720 (83.1%) | 553 (16.9%) |
| Manufacturing | 2,903 (65.5%) | 1,529 (34.5%) |
| Wholesale Trade | 968 (63.6%) | 553 (36.4%) |
| Retail Trade | 3,098 (52.5%) | 2,801 (47.5%) |
| Transportation & Warehousing | 1,831 (84.4%) | 339 (15.6%) |
| Utilities | 309 (84.0%) | 59 (16.0%) |
| Information | 504 (54.3%) | 424 (45.7%) |
| Finance & Insurance | 1,000 (51.3%) | 949 (48.7%) |
| Real Estate, Rental & Leasing | 322 (33.3%) | 646 (66.7%) |
| Professional & Scientific | 2,745 (68.2%) | 1,278 (31.8%) |
| Enterprise Management | 35 (46.7%) | 40 (53.3%) |
| Administrative & Support | 756 (52.3%) | 689 (47.7%) |
| Educational Services | 1,766 (34.2%) | 3,395 (65.8%) |
| Health Care & Social Assistance | 1,556 (26.2%) | 4,380 (73.8%) |
| Arts, Entertainment & Recreation | 1,136 (47.5%) | 1,256 (52.5%) |
| Accommodation & Food Services | 2,209 (56.7%) | 1,686 (43.3%) |
| Public Administration | 2,516 (73.1%) | 924 (26.9%) |
| Total | 27,234 (54.8%) | 22,433 (45.2%) |
Education in Temecula
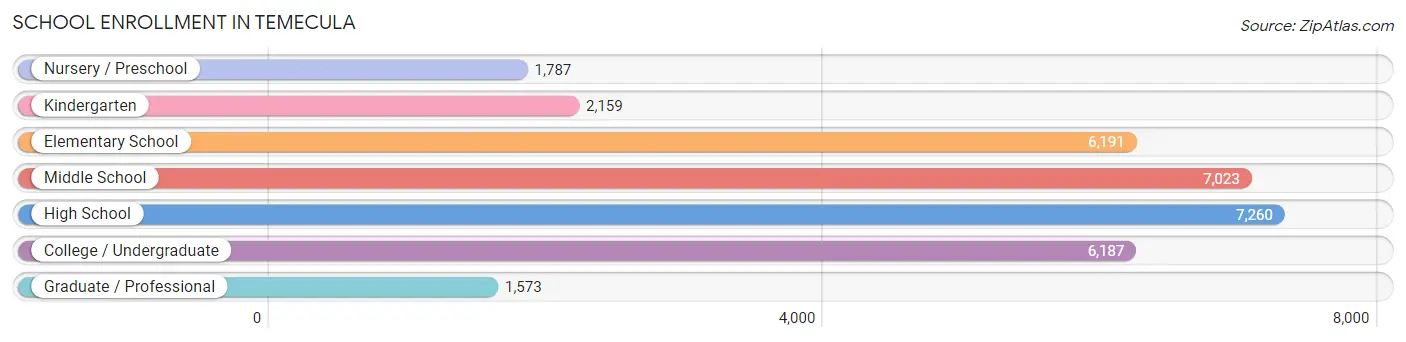
School Enrollment in Temecula
The most common levels of schooling among the 32,180 students in Temecula are high school (7,260 | 22.6%), middle school (7,023 | 21.8%), and elementary school (6,191 | 19.2%).
| School Level | # Students | % Students |
| Nursery / Preschool | 1,787 | 5.6% |
| Kindergarten | 2,159 | 6.7% |
| Elementary School | 6,191 | 19.2% |
| Middle School | 7,023 | 21.8% |
| High School | 7,260 | 22.6% |
| College / Undergraduate | 6,187 | 19.2% |
| Graduate / Professional | 1,573 | 4.9% |
| Total | 32,180 | 100.0% |
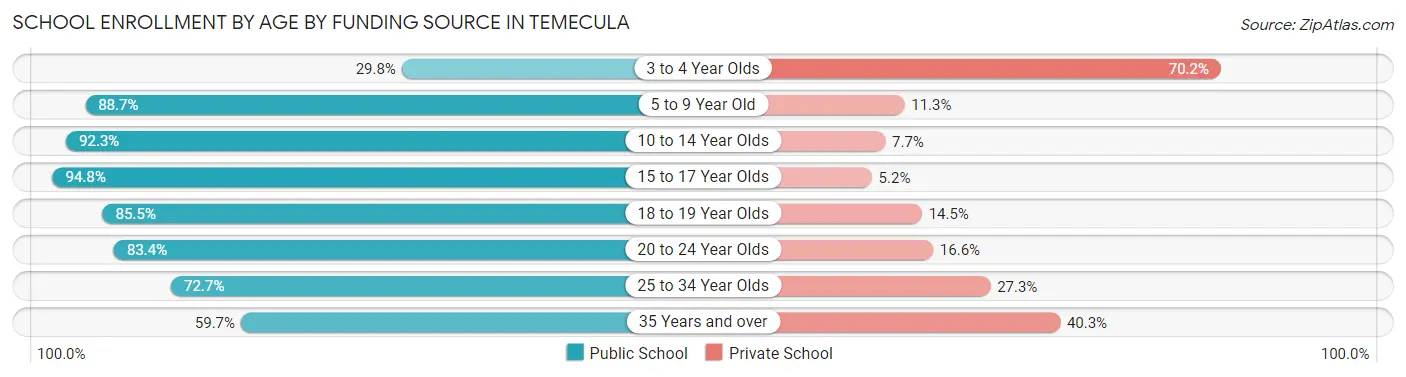
School Enrollment by Age by Funding Source in Temecula
Out of a total of 32,180 students who are enrolled in schools in Temecula, 4,859 (15.1%) attend a private institution, while the remaining 27,321 (84.9%) are enrolled in public schools. The age group of 3 to 4 year olds has the highest likelihood of being enrolled in private schools, with 951 (70.2% in the age bracket) enrolled. Conversely, the age group of 15 to 17 year olds has the lowest likelihood of being enrolled in a private school, with 5,003 (94.8% in the age bracket) attending a public institution.
| Age Bracket | Public School | Private School |
| 3 to 4 Year Olds | 403 (29.8%) | 951 (70.2%) |
| 5 to 9 Year Old | 7,059 (88.7%) | 898 (11.3%) |
| 10 to 14 Year Olds | 8,292 (92.3%) | 693 (7.7%) |
| 15 to 17 Year Olds | 5,003 (94.8%) | 275 (5.2%) |
| 18 to 19 Year Olds | 1,594 (85.5%) | 271 (14.5%) |
| 20 to 24 Year Olds | 2,317 (83.4%) | 462 (16.6%) |
| 25 to 34 Year Olds | 1,601 (72.7%) | 601 (27.3%) |
| 35 Years and over | 1,051 (59.7%) | 709 (40.3%) |
| Total | 27,321 (84.9%) | 4,859 (15.1%) |
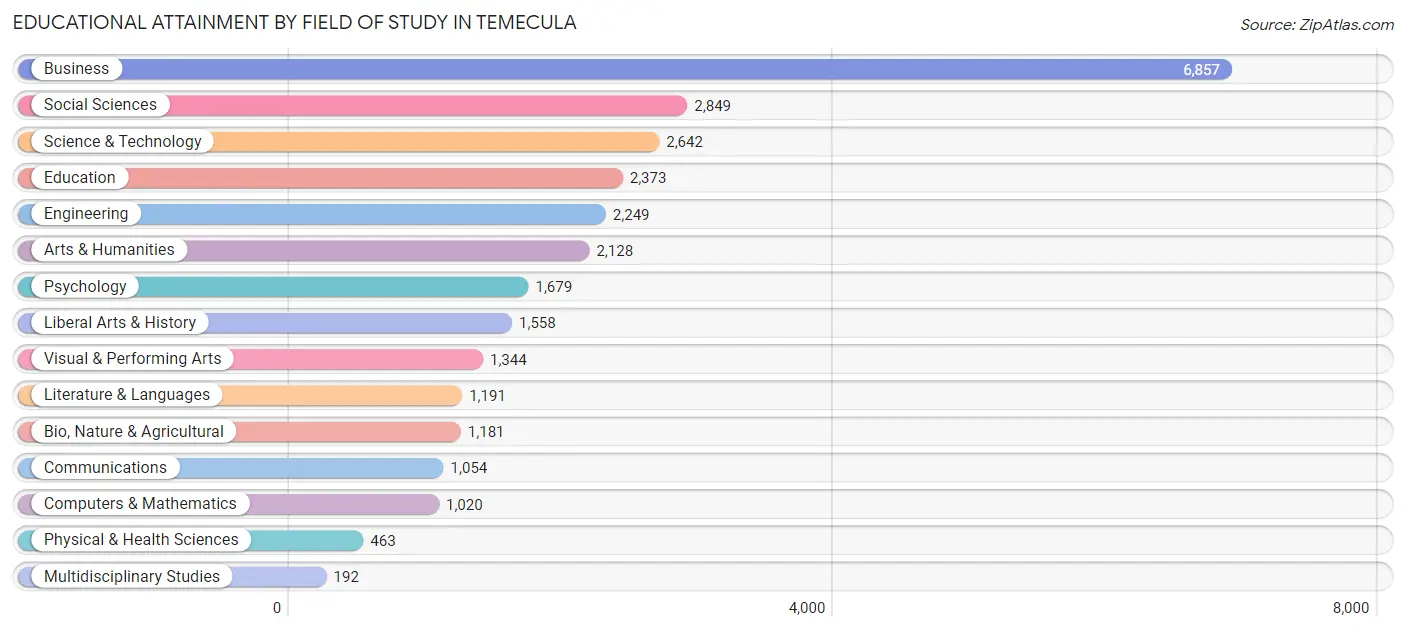
Educational Attainment by Field of Study in Temecula
Business (6,857 | 23.8%), social sciences (2,849 | 9.9%), science & technology (2,642 | 9.2%), education (2,373 | 8.3%), and engineering (2,249 | 7.8%) are the most common fields of study among 28,780 individuals in Temecula who have obtained a bachelor's degree or higher.
| Field of Study | # Graduates | % Graduates |
| Computers & Mathematics | 1,020 | 3.5% |
| Bio, Nature & Agricultural | 1,181 | 4.1% |
| Physical & Health Sciences | 463 | 1.6% |
| Psychology | 1,679 | 5.8% |
| Social Sciences | 2,849 | 9.9% |
| Engineering | 2,249 | 7.8% |
| Multidisciplinary Studies | 192 | 0.7% |
| Science & Technology | 2,642 | 9.2% |
| Business | 6,857 | 23.8% |
| Education | 2,373 | 8.3% |
| Literature & Languages | 1,191 | 4.1% |
| Liberal Arts & History | 1,558 | 5.4% |
| Visual & Performing Arts | 1,344 | 4.7% |
| Communications | 1,054 | 3.7% |
| Arts & Humanities | 2,128 | 7.4% |
| Total | 28,780 | 100.0% |
Transportation & Commute in Temecula
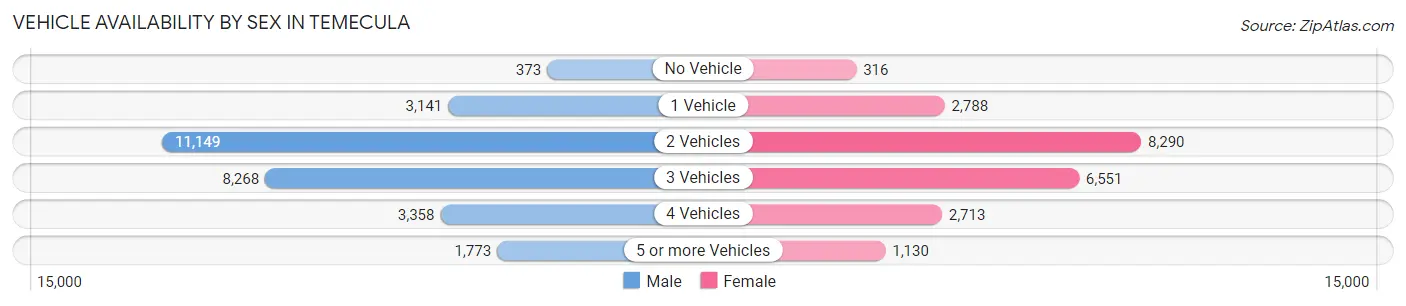
Vehicle Availability by Sex in Temecula
The most prevalent vehicle ownership categories in Temecula are males with 2 vehicles (11,149, accounting for 39.7%) and females with 2 vehicles (8,290, making up 51.2%).
| Vehicles Available | Male | Female |
| No Vehicle | 373 (1.3%) | 316 (1.5%) |
| 1 Vehicle | 3,141 (11.2%) | 2,788 (12.8%) |
| 2 Vehicles | 11,149 (39.7%) | 8,290 (38.1%) |
| 3 Vehicles | 8,268 (29.5%) | 6,551 (30.1%) |
| 4 Vehicles | 3,358 (12.0%) | 2,713 (12.4%) |
| 5 or more Vehicles | 1,773 (6.3%) | 1,130 (5.2%) |
| Total | 28,062 (100.0%) | 21,788 (100.0%) |
Commute Time in Temecula
The most frequently occuring commute durations in Temecula are 60 to 89 minutes (7,571 commuters, 17.7%), 15 to 19 minutes (6,489 commuters, 15.2%), and 10 to 14 minutes (5,813 commuters, 13.6%).
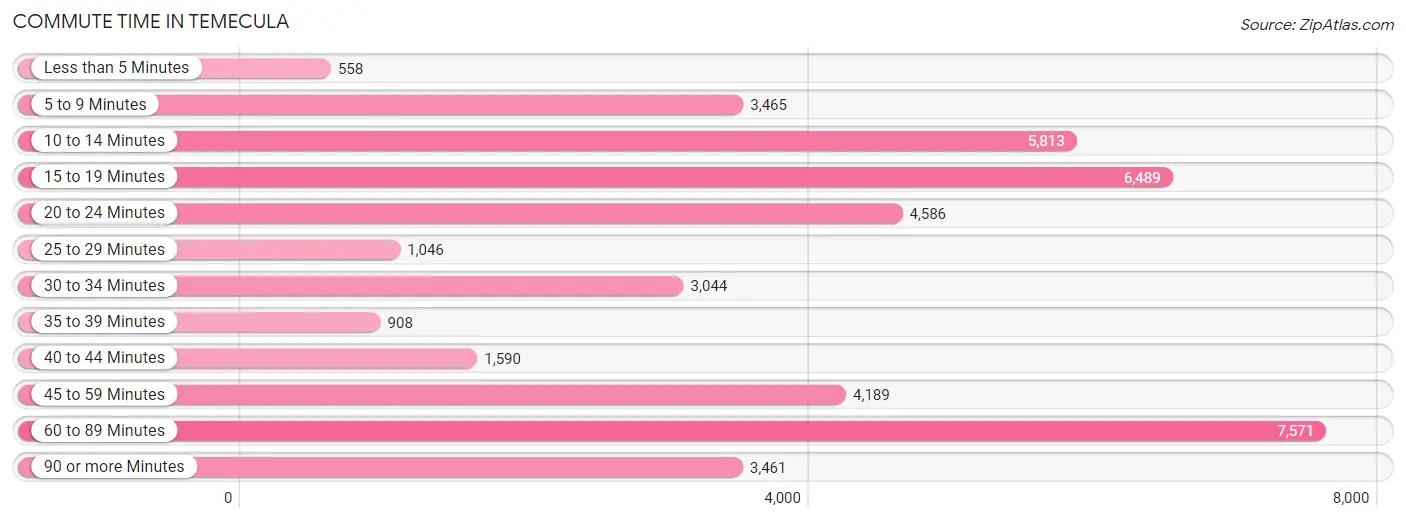
| Commute Time | # Commuters | % Commuters |
| Less than 5 Minutes | 558 | 1.3% |
| 5 to 9 Minutes | 3,465 | 8.1% |
| 10 to 14 Minutes | 5,813 | 13.6% |
| 15 to 19 Minutes | 6,489 | 15.2% |
| 20 to 24 Minutes | 4,586 | 10.7% |
| 25 to 29 Minutes | 1,046 | 2.5% |
| 30 to 34 Minutes | 3,044 | 7.1% |
| 35 to 39 Minutes | 908 | 2.1% |
| 40 to 44 Minutes | 1,590 | 3.7% |
| 45 to 59 Minutes | 4,189 | 9.8% |
| 60 to 89 Minutes | 7,571 | 17.7% |
| 90 or more Minutes | 3,461 | 8.1% |
Commute Time by Sex in Temecula
The most common commute times in Temecula are 60 to 89 minutes (5,250 commuters, 22.0%) for males and 15 to 19 minutes (3,205 commuters, 17.0%) for females.
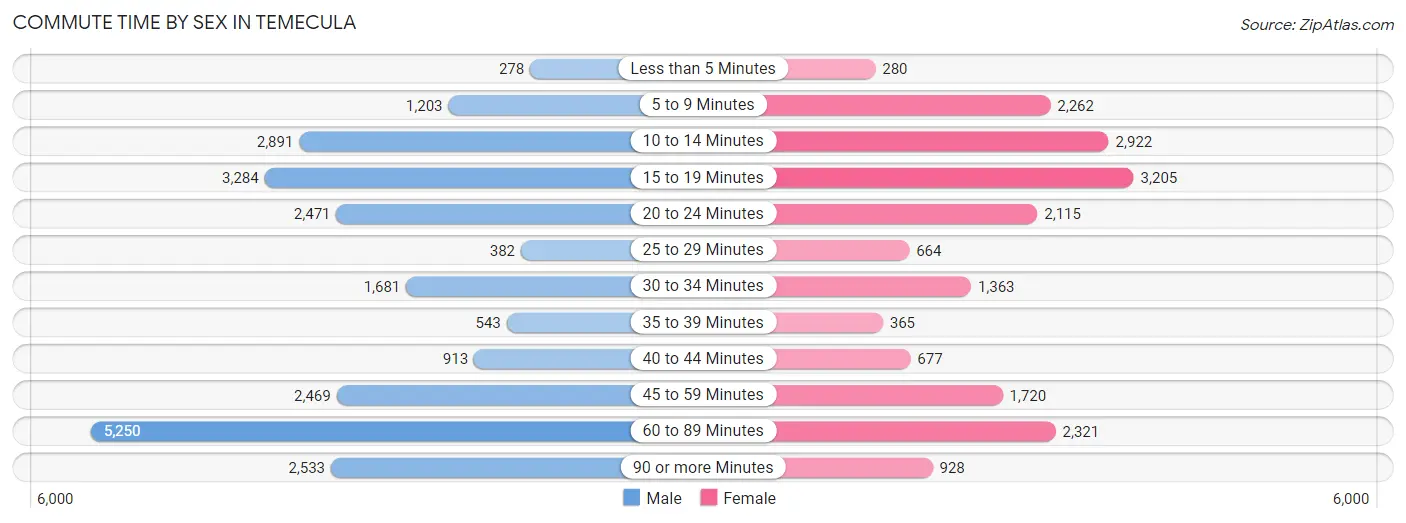
| Commute Time | Male | Female |
| Less than 5 Minutes | 278 (1.2%) | 280 (1.5%) |
| 5 to 9 Minutes | 1,203 (5.0%) | 2,262 (12.0%) |
| 10 to 14 Minutes | 2,891 (12.1%) | 2,922 (15.5%) |
| 15 to 19 Minutes | 3,284 (13.7%) | 3,205 (17.0%) |
| 20 to 24 Minutes | 2,471 (10.3%) | 2,115 (11.2%) |
| 25 to 29 Minutes | 382 (1.6%) | 664 (3.5%) |
| 30 to 34 Minutes | 1,681 (7.0%) | 1,363 (7.2%) |
| 35 to 39 Minutes | 543 (2.3%) | 365 (1.9%) |
| 40 to 44 Minutes | 913 (3.8%) | 677 (3.6%) |
| 45 to 59 Minutes | 2,469 (10.3%) | 1,720 (9.1%) |
| 60 to 89 Minutes | 5,250 (22.0%) | 2,321 (12.3%) |
| 90 or more Minutes | 2,533 (10.6%) | 928 (4.9%) |
Time of Departure to Work by Sex in Temecula
The most frequent times of departure to work in Temecula are 12:00 AM to 4:59 AM (3,045, 12.7%) for males and 8:00 AM to 8:29 AM (2,235, 11.9%) for females.
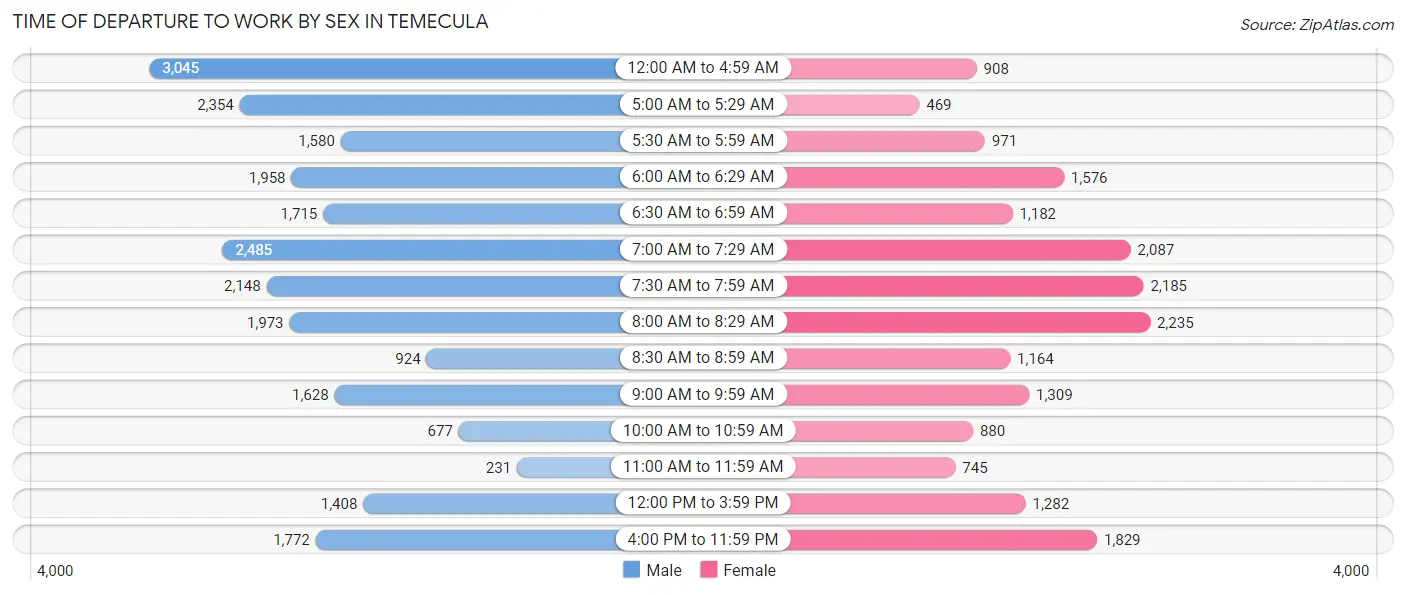
| Time of Departure | Male | Female |
| 12:00 AM to 4:59 AM | 3,045 (12.7%) | 908 (4.8%) |
| 5:00 AM to 5:29 AM | 2,354 (9.9%) | 469 (2.5%) |
| 5:30 AM to 5:59 AM | 1,580 (6.6%) | 971 (5.2%) |
| 6:00 AM to 6:29 AM | 1,958 (8.2%) | 1,576 (8.4%) |
| 6:30 AM to 6:59 AM | 1,715 (7.2%) | 1,182 (6.3%) |
| 7:00 AM to 7:29 AM | 2,485 (10.4%) | 2,087 (11.1%) |
| 7:30 AM to 7:59 AM | 2,148 (9.0%) | 2,185 (11.6%) |
| 8:00 AM to 8:29 AM | 1,973 (8.3%) | 2,235 (11.9%) |
| 8:30 AM to 8:59 AM | 924 (3.9%) | 1,164 (6.2%) |
| 9:00 AM to 9:59 AM | 1,628 (6.8%) | 1,309 (7.0%) |
| 10:00 AM to 10:59 AM | 677 (2.8%) | 880 (4.7%) |
| 11:00 AM to 11:59 AM | 231 (1.0%) | 745 (4.0%) |
| 12:00 PM to 3:59 PM | 1,408 (5.9%) | 1,282 (6.8%) |
| 4:00 PM to 11:59 PM | 1,772 (7.4%) | 1,829 (9.7%) |
| Total | 23,898 (100.0%) | 18,822 (100.0%) |
Housing Occupancy in Temecula
Occupancy by Ownership in Temecula
Of the total 35,012 dwellings in Temecula, owner-occupied units account for 23,916 (68.3%), while renter-occupied units make up 11,096 (31.7%).
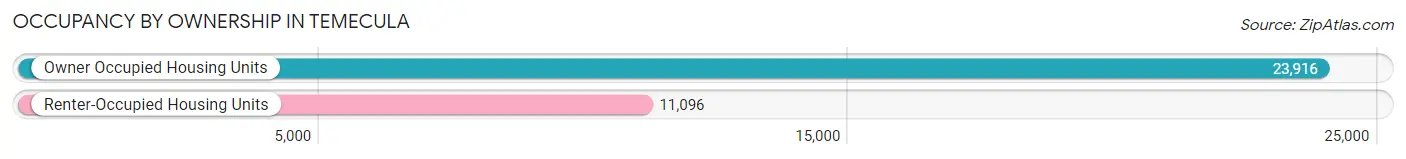
| Occupancy | # Housing Units | % Housing Units |
| Owner Occupied Housing Units | 23,916 | 68.3% |
| Renter-Occupied Housing Units | 11,096 | 31.7% |
| Total Occupied Housing Units | 35,012 | 100.0% |
Occupancy by Household Size in Temecula
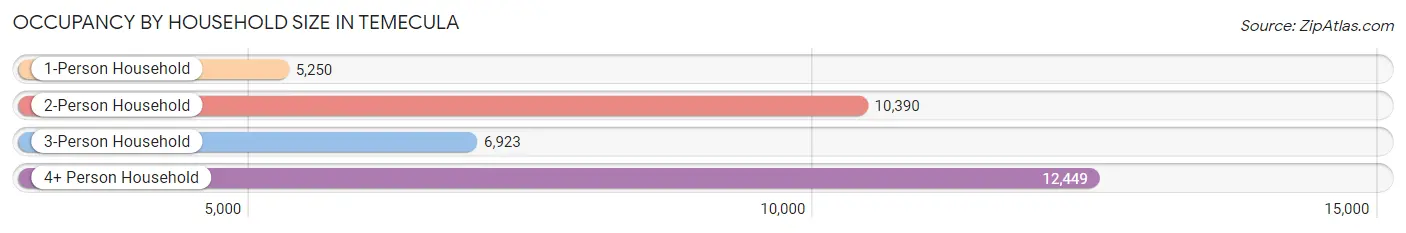
| Household Size | # Housing Units | % Housing Units |
| 1-Person Household | 5,250 | 15.0% |
| 2-Person Household | 10,390 | 29.7% |
| 3-Person Household | 6,923 | 19.8% |
| 4+ Person Household | 12,449 | 35.6% |
| Total Housing Units | 35,012 | 100.0% |
Occupancy by Ownership by Household Size in Temecula
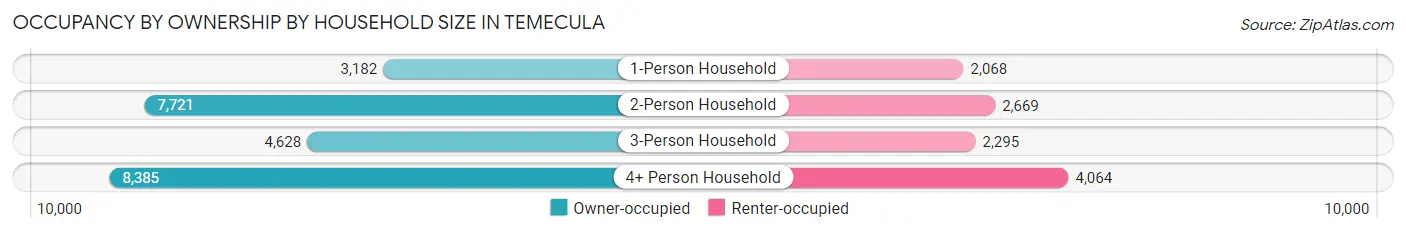
| Household Size | Owner-occupied | Renter-occupied |
| 1-Person Household | 3,182 (60.6%) | 2,068 (39.4%) |
| 2-Person Household | 7,721 (74.3%) | 2,669 (25.7%) |
| 3-Person Household | 4,628 (66.8%) | 2,295 (33.2%) |
| 4+ Person Household | 8,385 (67.3%) | 4,064 (32.7%) |
| Total Housing Units | 23,916 (68.3%) | 11,096 (31.7%) |
Occupancy by Educational Attainment in Temecula
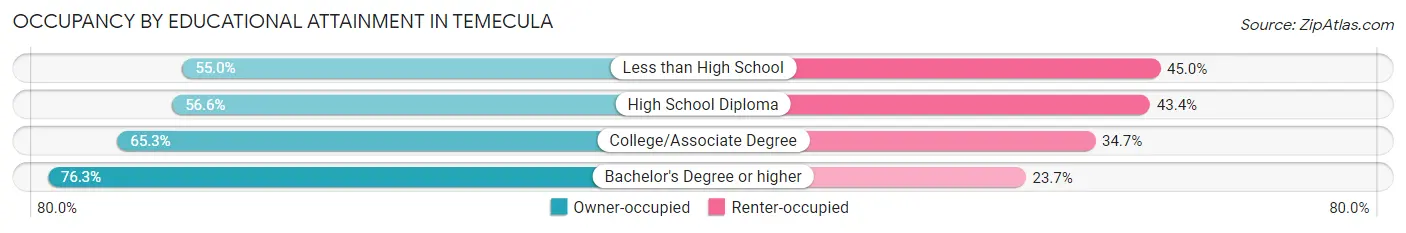
| Household Size | Owner-occupied | Renter-occupied |
| Less than High School | 949 (55.0%) | 777 (45.0%) |
| High School Diploma | 2,643 (56.6%) | 2,028 (43.4%) |
| College/Associate Degree | 8,949 (65.3%) | 4,759 (34.7%) |
| Bachelor's Degree or higher | 11,375 (76.3%) | 3,532 (23.7%) |
Occupancy by Age of Householder in Temecula
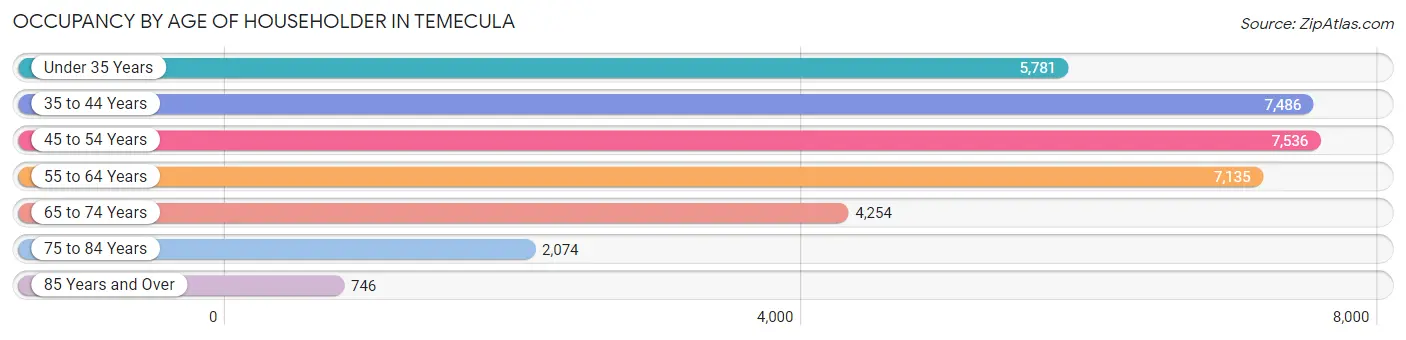
| Age Bracket | # Households | % Households |
| Under 35 Years | 5,781 | 16.5% |
| 35 to 44 Years | 7,486 | 21.4% |
| 45 to 54 Years | 7,536 | 21.5% |
| 55 to 64 Years | 7,135 | 20.4% |
| 65 to 74 Years | 4,254 | 12.1% |
| 75 to 84 Years | 2,074 | 5.9% |
| 85 Years and Over | 746 | 2.1% |
| Total | 35,012 | 100.0% |
Housing Finances in Temecula
Median Income by Occupancy in Temecula
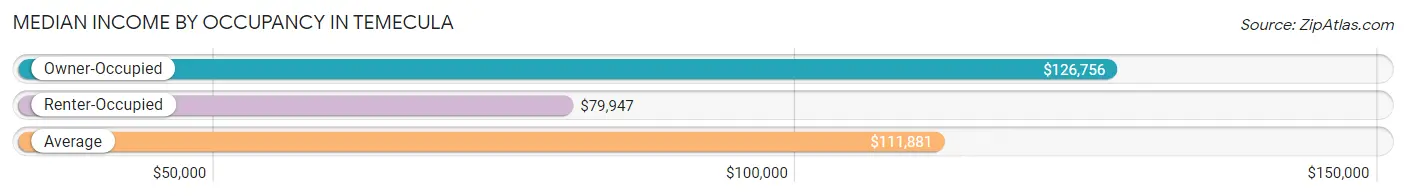
| Occupancy Type | # Households | Median Income |
| Owner-Occupied | 23,916 (68.3%) | $126,756 |
| Renter-Occupied | 11,096 (31.7%) | $79,947 |
| Average | 35,012 (100.0%) | $111,881 |
Occupancy by Householder Income Bracket in Temecula
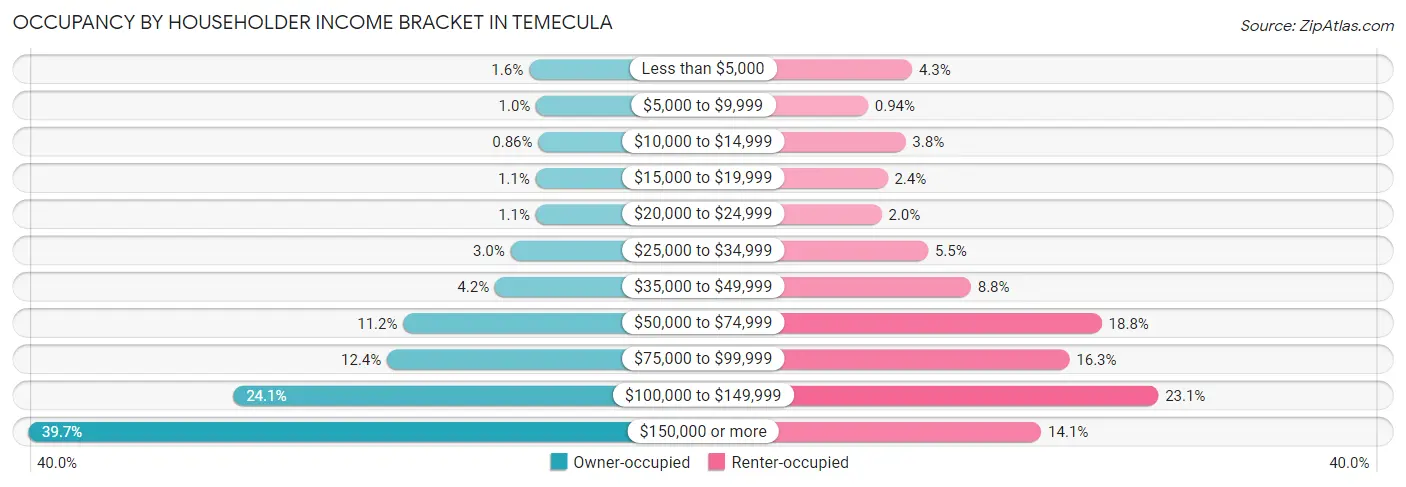
| Income Bracket | Owner-occupied | Renter-occupied |
| Less than $5,000 | 376 (1.6%) | 477 (4.3%) |
| $5,000 to $9,999 | 243 (1.0%) | 104 (0.9%) |
| $10,000 to $14,999 | 205 (0.9%) | 422 (3.8%) |
| $15,000 to $19,999 | 257 (1.1%) | 270 (2.4%) |
| $20,000 to $24,999 | 251 (1.1%) | 220 (2.0%) |
| $25,000 to $34,999 | 711 (3.0%) | 613 (5.5%) |
| $35,000 to $49,999 | 995 (4.2%) | 974 (8.8%) |
| $50,000 to $74,999 | 2,667 (11.2%) | 2,081 (18.8%) |
| $75,000 to $99,999 | 2,960 (12.4%) | 1,807 (16.3%) |
| $100,000 to $149,999 | 5,764 (24.1%) | 2,559 (23.1%) |
| $150,000 or more | 9,487 (39.7%) | 1,569 (14.1%) |
| Total | 23,916 (100.0%) | 11,096 (100.0%) |
Monthly Housing Cost Tiers in Temecula
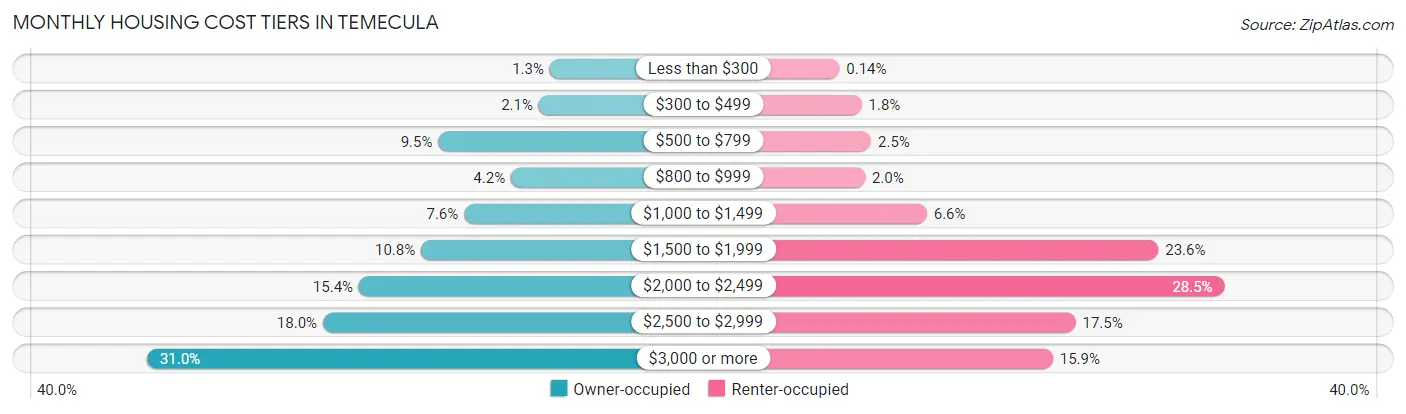
| Monthly Cost | Owner-occupied | Renter-occupied |
| Less than $300 | 315 (1.3%) | 16 (0.1%) |
| $300 to $499 | 509 (2.1%) | 197 (1.8%) |
| $500 to $799 | 2,280 (9.5%) | 275 (2.5%) |
| $800 to $999 | 1,000 (4.2%) | 225 (2.0%) |
| $1,000 to $1,499 | 1,825 (7.6%) | 730 (6.6%) |
| $1,500 to $1,999 | 2,584 (10.8%) | 2,622 (23.6%) |
| $2,000 to $2,499 | 3,678 (15.4%) | 3,162 (28.5%) |
| $2,500 to $2,999 | 4,313 (18.0%) | 1,946 (17.5%) |
| $3,000 or more | 7,412 (31.0%) | 1,760 (15.9%) |
| Total | 23,916 (100.0%) | 11,096 (100.0%) |
Physical Housing Characteristics in Temecula
Housing Structures in Temecula
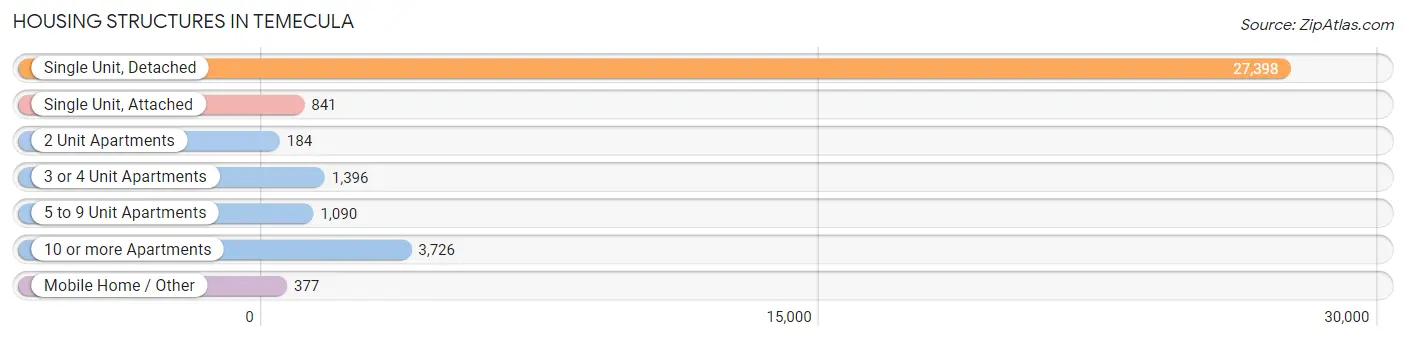
| Structure Type | # Housing Units | % Housing Units |
| Single Unit, Detached | 27,398 | 78.2% |
| Single Unit, Attached | 841 | 2.4% |
| 2 Unit Apartments | 184 | 0.5% |
| 3 or 4 Unit Apartments | 1,396 | 4.0% |
| 5 to 9 Unit Apartments | 1,090 | 3.1% |
| 10 or more Apartments | 3,726 | 10.6% |
| Mobile Home / Other | 377 | 1.1% |
| Total | 35,012 | 100.0% |
Housing Structures by Occupancy in Temecula
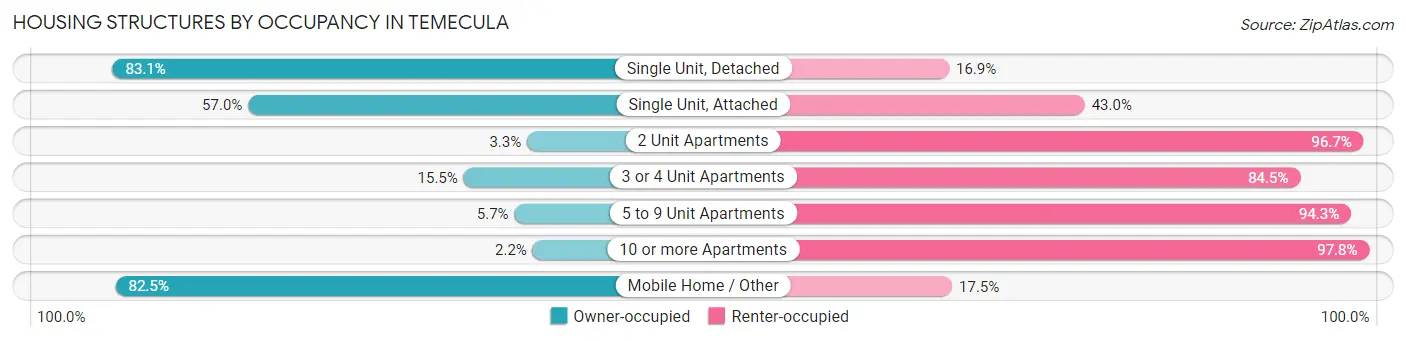
| Structure Type | Owner-occupied | Renter-occupied |
| Single Unit, Detached | 22,761 (83.1%) | 4,637 (16.9%) |
| Single Unit, Attached | 479 (57.0%) | 362 (43.0%) |
| 2 Unit Apartments | 6 (3.3%) | 178 (96.7%) |
| 3 or 4 Unit Apartments | 216 (15.5%) | 1,180 (84.5%) |
| 5 to 9 Unit Apartments | 62 (5.7%) | 1,028 (94.3%) |
| 10 or more Apartments | 81 (2.2%) | 3,645 (97.8%) |
| Mobile Home / Other | 311 (82.5%) | 66 (17.5%) |
| Total | 23,916 (68.3%) | 11,096 (31.7%) |
Housing Structures by Number of Rooms in Temecula
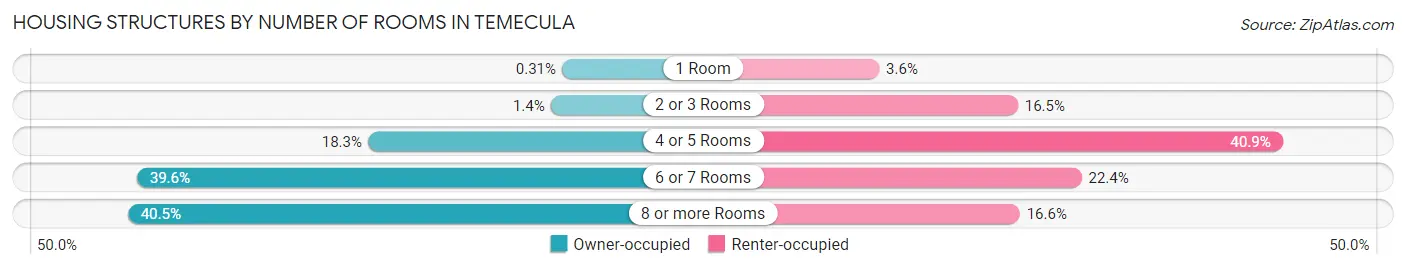
| Number of Rooms | Owner-occupied | Renter-occupied |
| 1 Room | 73 (0.3%) | 403 (3.6%) |
| 2 or 3 Rooms | 325 (1.4%) | 1,825 (16.5%) |
| 4 or 5 Rooms | 4,366 (18.3%) | 4,543 (40.9%) |
| 6 or 7 Rooms | 9,475 (39.6%) | 2,480 (22.4%) |
| 8 or more Rooms | 9,677 (40.5%) | 1,845 (16.6%) |
| Total | 23,916 (100.0%) | 11,096 (100.0%) |
Housing Structure by Heating Type in Temecula
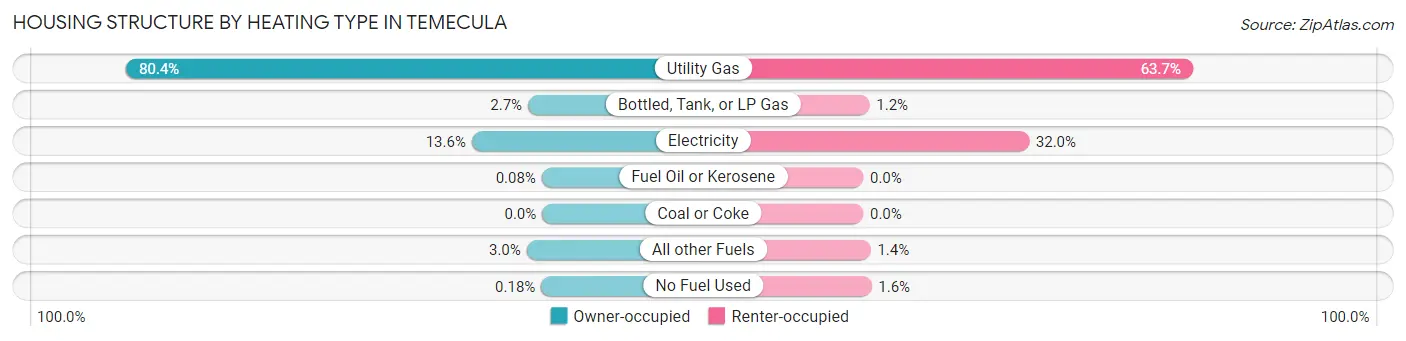
| Heating Type | Owner-occupied | Renter-occupied |
| Utility Gas | 19,230 (80.4%) | 7,068 (63.7%) |
| Bottled, Tank, or LP Gas | 656 (2.7%) | 135 (1.2%) |
| Electricity | 3,253 (13.6%) | 3,555 (32.0%) |
| Fuel Oil or Kerosene | 20 (0.1%) | 0 (0.0%) |
| Coal or Coke | 0 (0.0%) | 0 (0.0%) |
| All other Fuels | 714 (3.0%) | 160 (1.4%) |
| No Fuel Used | 43 (0.2%) | 178 (1.6%) |
| Total | 23,916 (100.0%) | 11,096 (100.0%) |
Household Vehicle Usage in Temecula
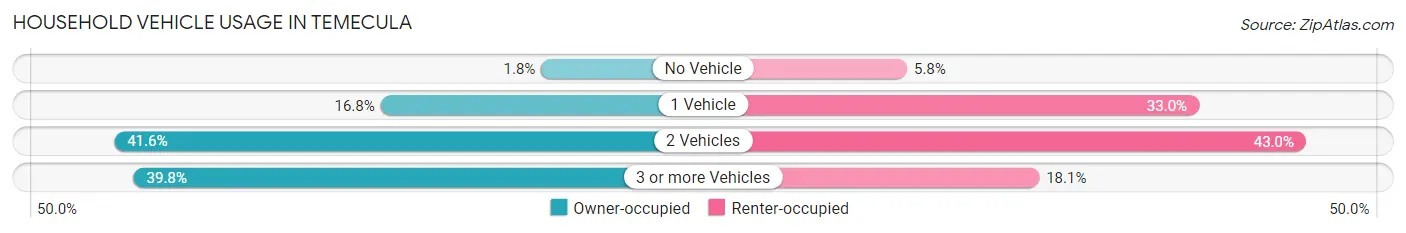
| Vehicles per Household | Owner-occupied | Renter-occupied |
| No Vehicle | 426 (1.8%) | 644 (5.8%) |
| 1 Vehicle | 4,010 (16.8%) | 3,666 (33.0%) |
| 2 Vehicles | 9,956 (41.6%) | 4,773 (43.0%) |
| 3 or more Vehicles | 9,524 (39.8%) | 2,013 (18.1%) |
| Total | 23,916 (100.0%) | 11,096 (100.0%) |
Real Estate & Mortgages in Temecula
Real Estate and Mortgage Overview in Temecula
| Characteristic | Without Mortgage | With Mortgage |
| Housing Units | 4,799 | 19,117 |
| Median Property Value | $596,000 | $606,300 |
| Median Household Income | $95,023 | $8,290 |
| Monthly Housing Costs | $744 | $7,396 |
| Real Estate Taxes | $4,481 | $252 |
Property Value by Mortgage Status in Temecula
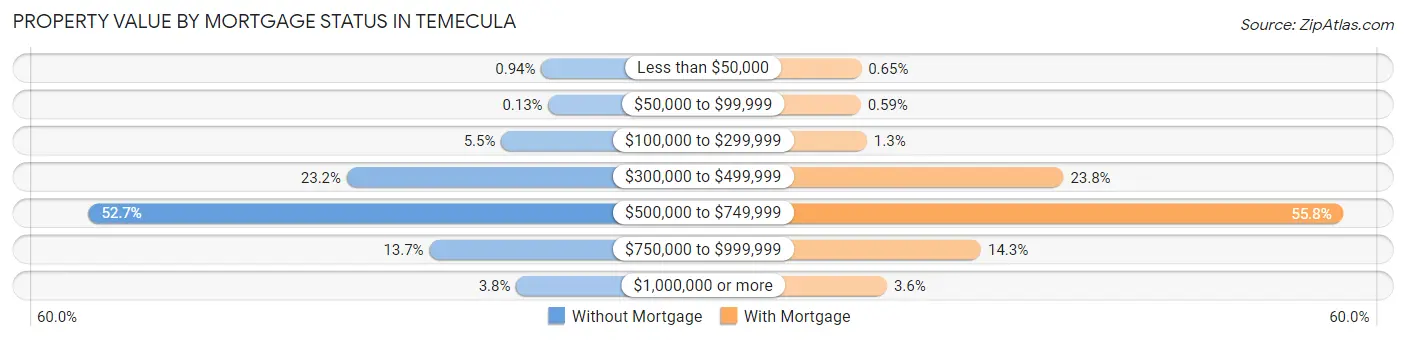
| Property Value | Without Mortgage | With Mortgage |
| Less than $50,000 | 45 (0.9%) | 125 (0.6%) |
| $50,000 to $99,999 | 6 (0.1%) | 112 (0.6%) |
| $100,000 to $299,999 | 265 (5.5%) | 248 (1.3%) |
| $300,000 to $499,999 | 1,112 (23.2%) | 4,542 (23.8%) |
| $500,000 to $749,999 | 2,529 (52.7%) | 10,662 (55.8%) |
| $750,000 to $999,999 | 659 (13.7%) | 2,741 (14.3%) |
| $1,000,000 or more | 183 (3.8%) | 687 (3.6%) |
| Total | 4,799 (100.0%) | 19,117 (100.0%) |
Household Income by Mortgage Status in Temecula
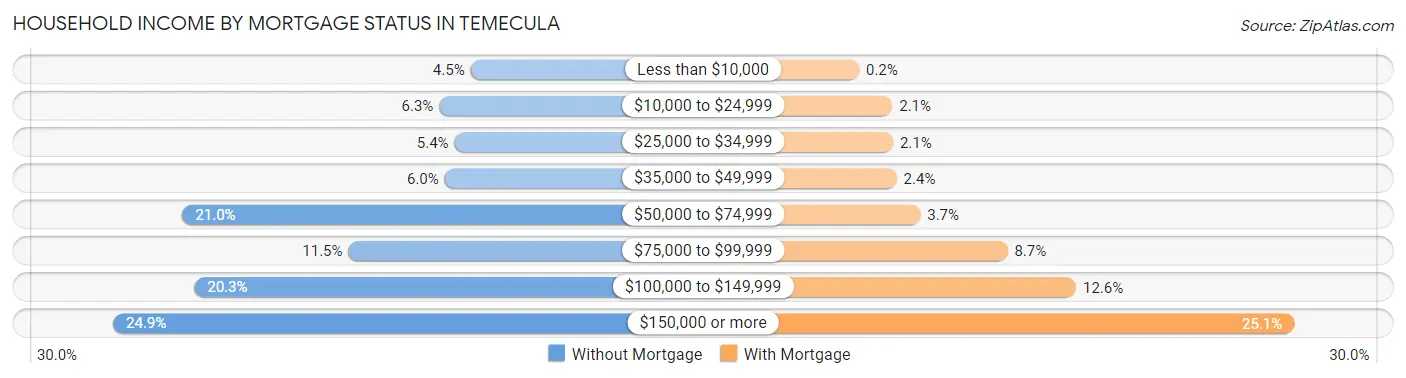
| Household Income | Without Mortgage | With Mortgage |
| Less than $10,000 | 217 (4.5%) | 39 (0.2%) |
| $10,000 to $24,999 | 303 (6.3%) | 402 (2.1%) |
| $25,000 to $34,999 | 261 (5.4%) | 410 (2.1%) |
| $35,000 to $49,999 | 288 (6.0%) | 450 (2.4%) |
| $50,000 to $74,999 | 1,007 (21.0%) | 707 (3.7%) |
| $75,000 to $99,999 | 552 (11.5%) | 1,660 (8.7%) |
| $100,000 to $149,999 | 974 (20.3%) | 2,408 (12.6%) |
| $150,000 or more | 1,197 (24.9%) | 4,790 (25.1%) |
| Total | 4,799 (100.0%) | 19,117 (100.0%) |
Property Value to Household Income Ratio in Temecula
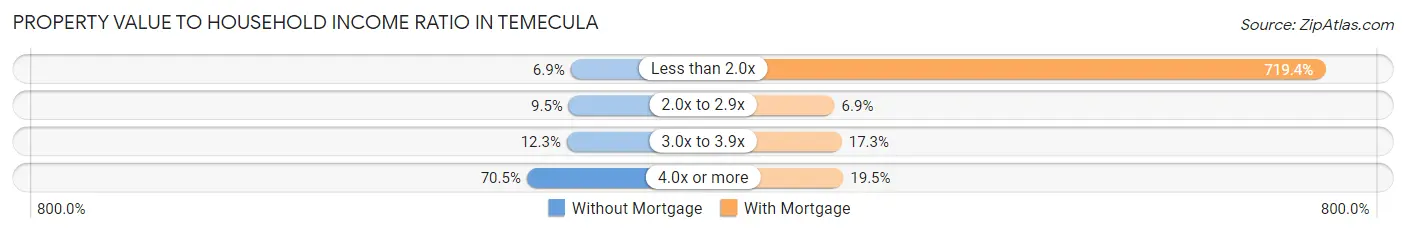
| Value-to-Income Ratio | Without Mortgage | With Mortgage |
| Less than 2.0x | 332 (6.9%) | 137,518 (719.4%) |
| 2.0x to 2.9x | 455 (9.5%) | 1,313 (6.9%) |
| 3.0x to 3.9x | 591 (12.3%) | 3,303 (17.3%) |
| 4.0x or more | 3,382 (70.5%) | 3,730 (19.5%) |
| Total | 4,799 (100.0%) | 19,117 (100.0%) |
Real Estate Taxes by Mortgage Status in Temecula
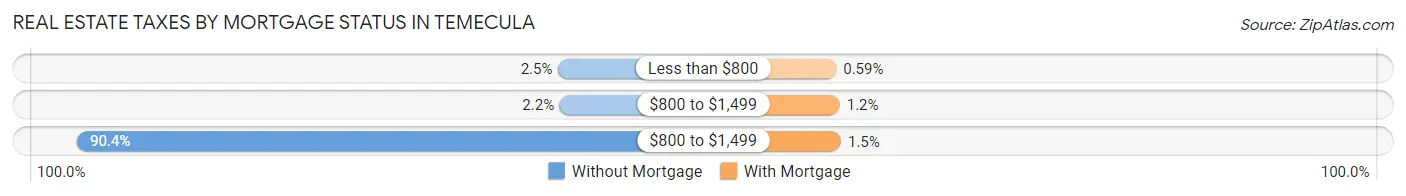
| Property Taxes | Without Mortgage | With Mortgage |
| Less than $800 | 121 (2.5%) | 112 (0.6%) |
| $800 to $1,499 | 106 (2.2%) | 235 (1.2%) |
| $800 to $1,499 | 4,339 (90.4%) | 280 (1.5%) |
| Total | 4,799 (100.0%) | 19,117 (100.0%) |
Health & Disability in Temecula
Health Insurance Coverage by Age in Temecula
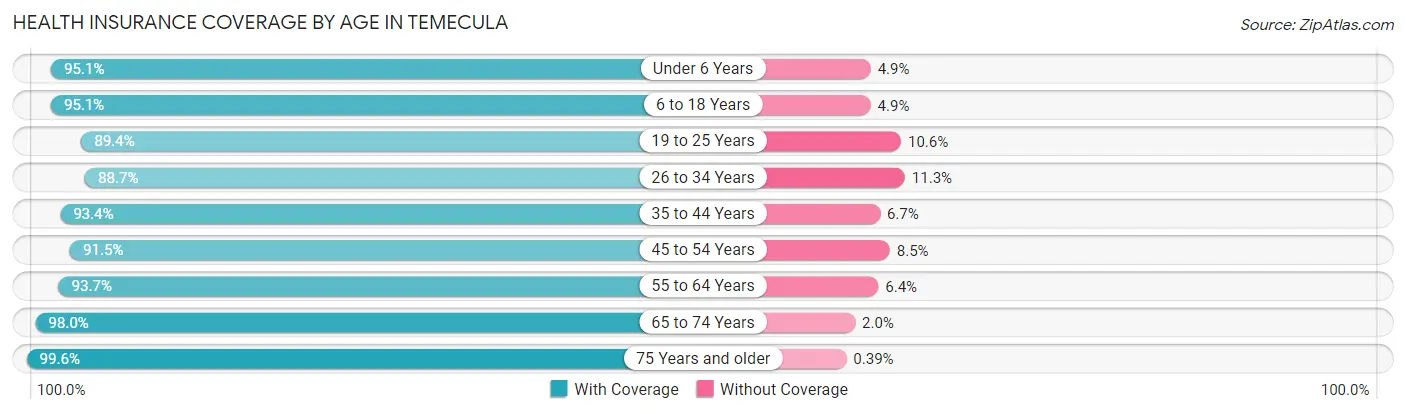
| Age Bracket | With Coverage | Without Coverage |
| Under 6 Years | 8,780 (95.1%) | 455 (4.9%) |
| 6 to 18 Years | 21,749 (95.1%) | 1,126 (4.9%) |
| 19 to 25 Years | 7,140 (89.4%) | 845 (10.6%) |
| 26 to 34 Years | 10,615 (88.7%) | 1,352 (11.3%) |
| 35 to 44 Years | 14,375 (93.3%) | 1,024 (6.7%) |
| 45 to 54 Years | 12,967 (91.5%) | 1,204 (8.5%) |
| 55 to 64 Years | 13,401 (93.6%) | 909 (6.4%) |
| 65 to 74 Years | 7,726 (98.0%) | 159 (2.0%) |
| 75 Years and older | 4,915 (99.6%) | 19 (0.4%) |
| Total | 101,668 (93.5%) | 7,093 (6.5%) |
Health Insurance Coverage by Citizenship Status in Temecula
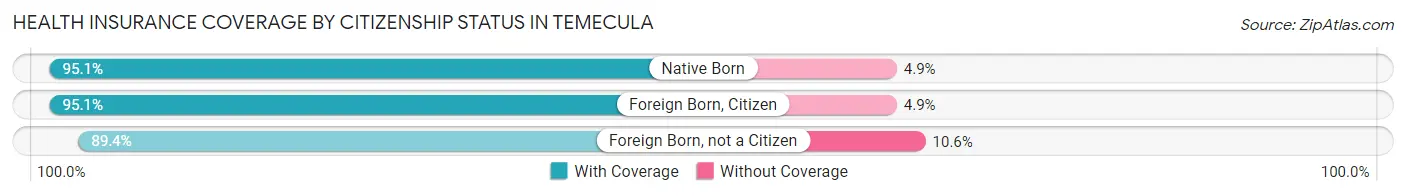
| Citizenship Status | With Coverage | Without Coverage |
| Native Born | 8,780 (95.1%) | 455 (4.9%) |
| Foreign Born, Citizen | 21,749 (95.1%) | 1,126 (4.9%) |
| Foreign Born, not a Citizen | 7,140 (89.4%) | 845 (10.6%) |
Health Insurance Coverage by Household Income in Temecula
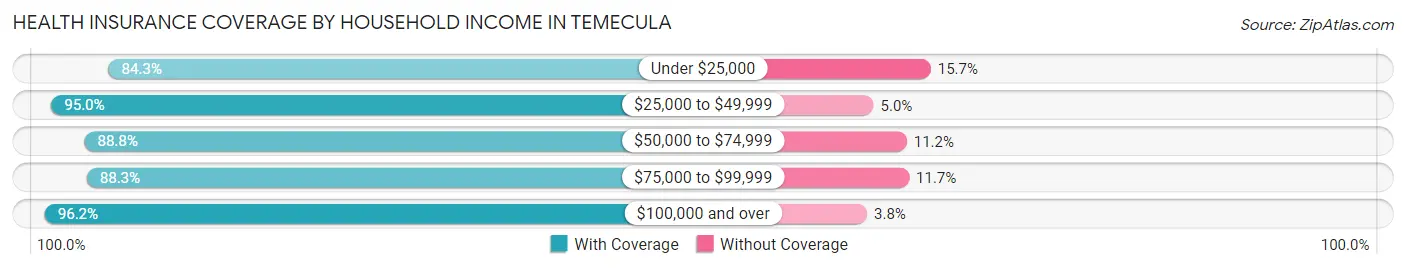
| Household Income | With Coverage | Without Coverage |
| Under $25,000 | 5,376 (84.3%) | 1,004 (15.7%) |
| $25,000 to $49,999 | 7,971 (95.0%) | 421 (5.0%) |
| $50,000 to $74,999 | 11,256 (88.8%) | 1,425 (11.2%) |
| $75,000 to $99,999 | 12,908 (88.3%) | 1,706 (11.7%) |
| $100,000 and over | 64,106 (96.2%) | 2,535 (3.8%) |
Public vs Private Health Insurance Coverage by Age in Temecula
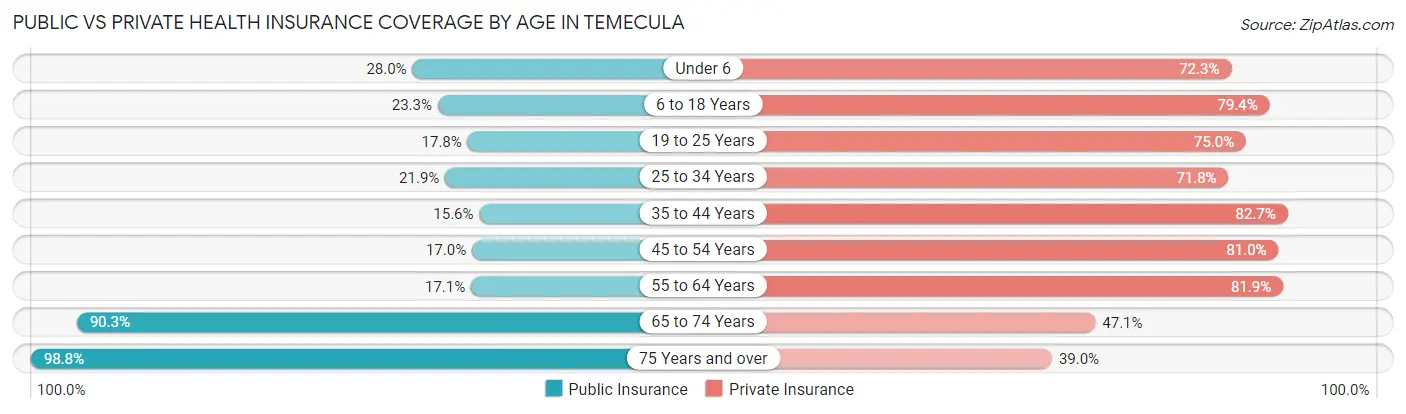
| Age Bracket | Public Insurance | Private Insurance |
| Under 6 | 2,587 (28.0%) | 6,675 (72.3%) |
| 6 to 18 Years | 5,332 (23.3%) | 18,162 (79.4%) |
| 19 to 25 Years | 1,419 (17.8%) | 5,992 (75.0%) |
| 25 to 34 Years | 2,626 (21.9%) | 8,588 (71.8%) |
| 35 to 44 Years | 2,400 (15.6%) | 12,741 (82.7%) |
| 45 to 54 Years | 2,404 (17.0%) | 11,484 (81.0%) |
| 55 to 64 Years | 2,451 (17.1%) | 11,720 (81.9%) |
| 65 to 74 Years | 7,122 (90.3%) | 3,711 (47.1%) |
| 75 Years and over | 4,877 (98.8%) | 1,925 (39.0%) |
| Total | 31,218 (28.7%) | 80,998 (74.5%) |
Disability Status by Sex by Age in Temecula
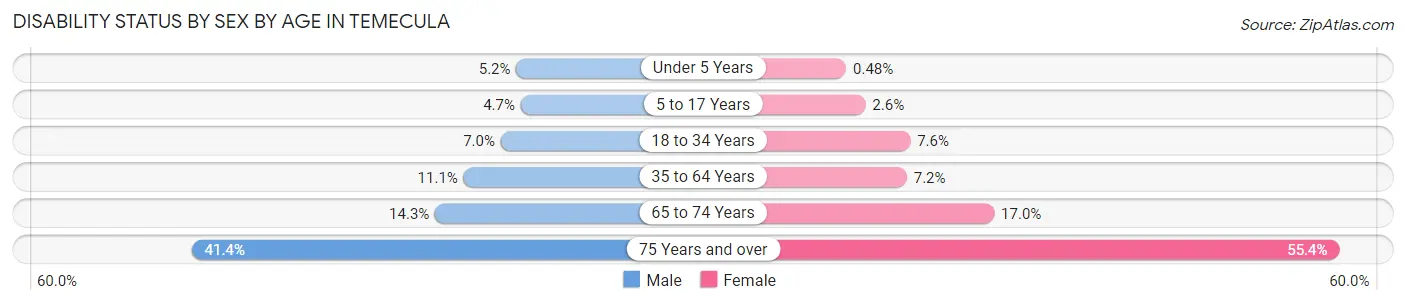
| Age Bracket | Male | Female |
| Under 5 Years | 177 (5.2%) | 19 (0.5%) |
| 5 to 17 Years | 576 (4.7%) | 293 (2.6%) |
| 18 to 34 Years | 721 (7.0%) | 847 (7.6%) |
| 35 to 64 Years | 2,434 (11.1%) | 1,589 (7.2%) |
| 65 to 74 Years | 494 (14.3%) | 751 (17.0%) |
| 75 Years and over | 809 (41.4%) | 1,651 (55.4%) |
Disability Class by Sex by Age in Temecula
Disability Class: Hearing Difficulty
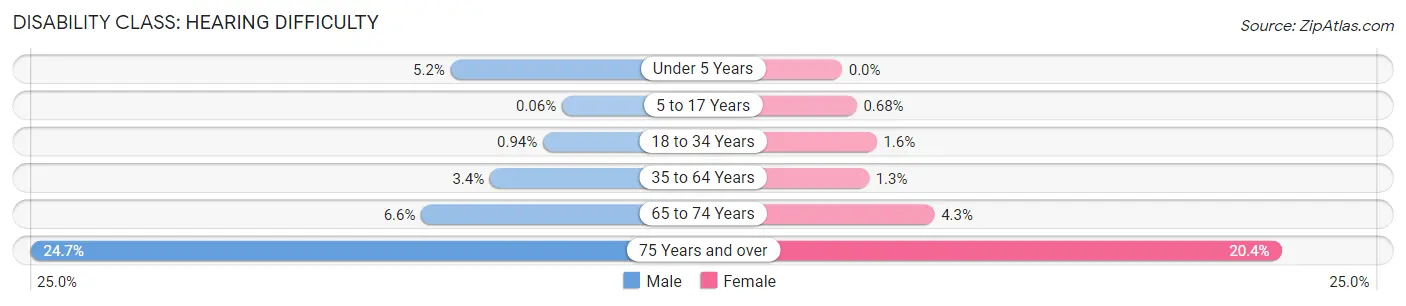
| Age Bracket | Male | Female |
| Under 5 Years | 177 (5.2%) | 0 (0.0%) |
| 5 to 17 Years | 7 (0.1%) | 76 (0.7%) |
| 18 to 34 Years | 97 (0.9%) | 179 (1.6%) |
| 35 to 64 Years | 745 (3.4%) | 275 (1.3%) |
| 65 to 74 Years | 228 (6.6%) | 190 (4.3%) |
| 75 Years and over | 483 (24.7%) | 608 (20.4%) |
Disability Class: Vision Difficulty
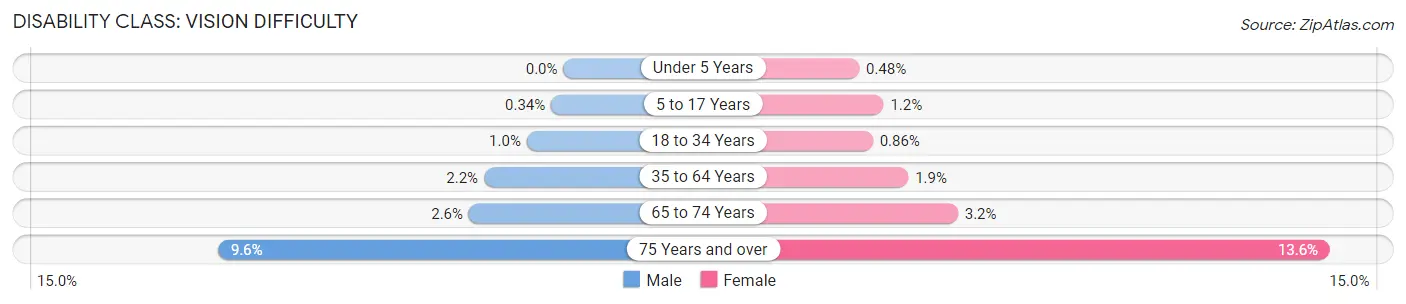
| Age Bracket | Male | Female |
| Under 5 Years | 0 (0.0%) | 19 (0.5%) |
| 5 to 17 Years | 41 (0.3%) | 129 (1.2%) |
| 18 to 34 Years | 105 (1.0%) | 95 (0.9%) |
| 35 to 64 Years | 485 (2.2%) | 405 (1.8%) |
| 65 to 74 Years | 91 (2.6%) | 143 (3.2%) |
| 75 Years and over | 188 (9.6%) | 405 (13.6%) |
Disability Class: Cognitive Difficulty
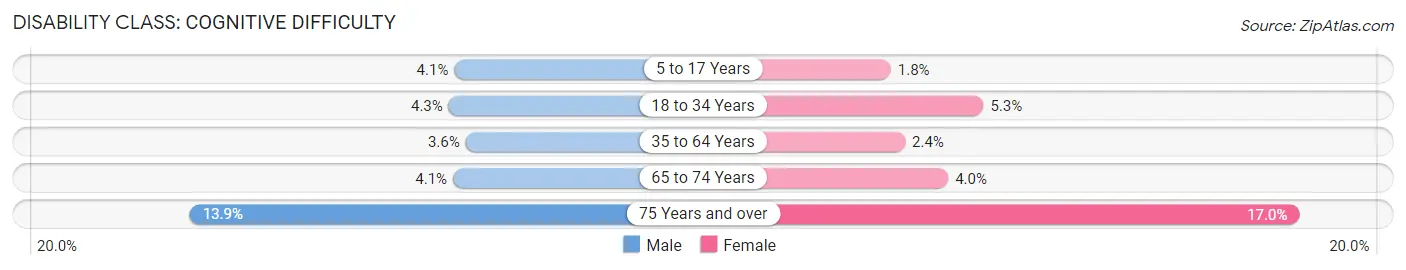
| Age Bracket | Male | Female |
| 5 to 17 Years | 493 (4.1%) | 203 (1.8%) |
| 18 to 34 Years | 441 (4.3%) | 584 (5.3%) |
| 35 to 64 Years | 795 (3.6%) | 515 (2.4%) |
| 65 to 74 Years | 142 (4.1%) | 175 (4.0%) |
| 75 Years and over | 271 (13.9%) | 506 (17.0%) |
Disability Class: Ambulatory Difficulty
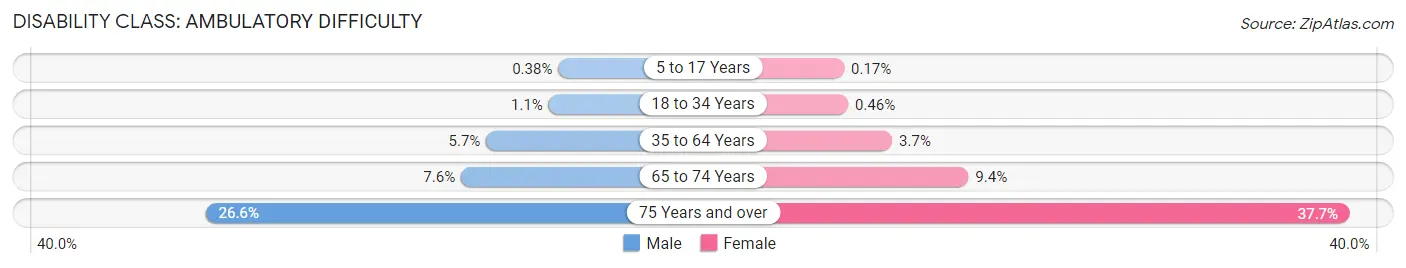
| Age Bracket | Male | Female |
| 5 to 17 Years | 46 (0.4%) | 19 (0.2%) |
| 18 to 34 Years | 113 (1.1%) | 51 (0.5%) |
| 35 to 64 Years | 1,256 (5.7%) | 822 (3.7%) |
| 65 to 74 Years | 263 (7.6%) | 416 (9.4%) |
| 75 Years and over | 519 (26.6%) | 1,124 (37.7%) |
Disability Class: Self-Care Difficulty
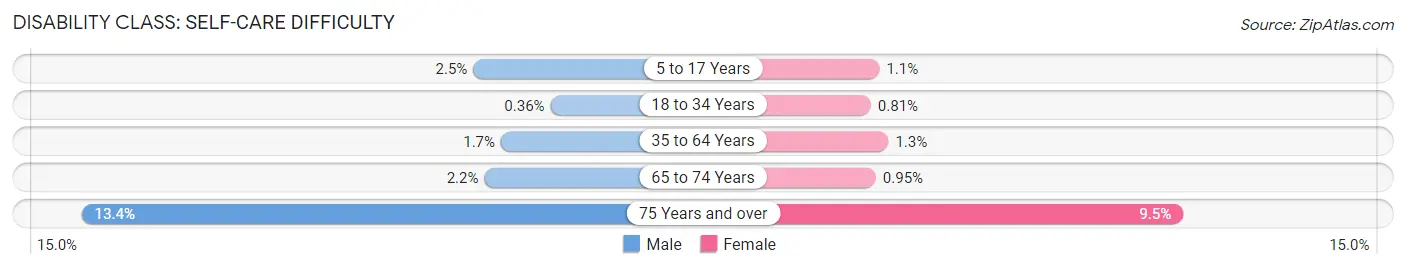
| Age Bracket | Male | Female |
| 5 to 17 Years | 305 (2.5%) | 117 (1.1%) |
| 18 to 34 Years | 37 (0.4%) | 90 (0.8%) |
| 35 to 64 Years | 382 (1.7%) | 285 (1.3%) |
| 65 to 74 Years | 76 (2.2%) | 42 (0.9%) |
| 75 Years and over | 262 (13.4%) | 283 (9.5%) |
Technology Access in Temecula
Computing Device Access in Temecula
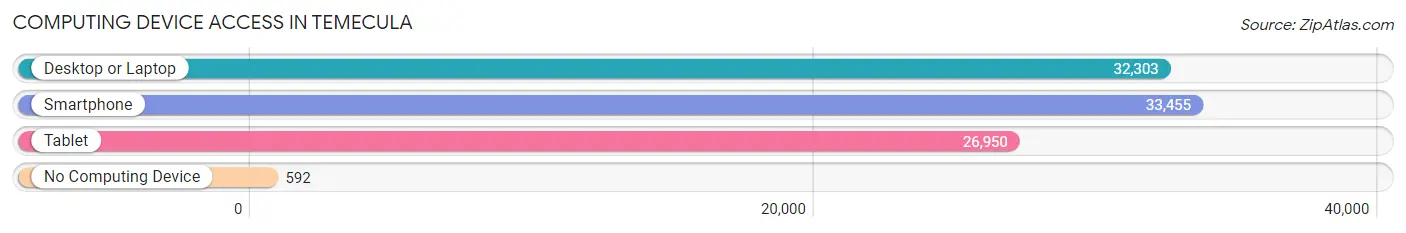
| Device Type | # Households | % Households |
| Desktop or Laptop | 32,303 | 92.3% |
| Smartphone | 33,455 | 95.6% |
| Tablet | 26,950 | 77.0% |
| No Computing Device | 592 | 1.7% |
| Total | 35,012 | 100.0% |
Internet Access in Temecula
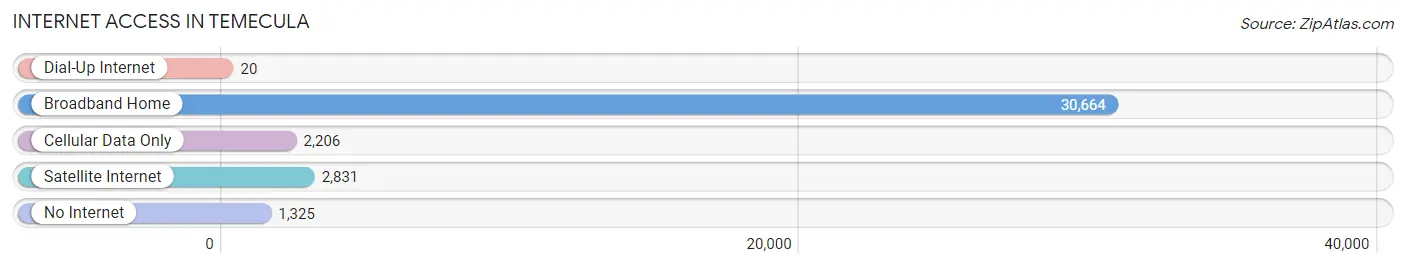
| Internet Type | # Households | % Households |
| Dial-Up Internet | 20 | 0.1% |
| Broadband Home | 30,664 | 87.6% |
| Cellular Data Only | 2,206 | 6.3% |
| Satellite Internet | 2,831 | 8.1% |
| No Internet | 1,325 | 3.8% |
| Total | 35,012 | 100.0% |
Temecula Summary
Temecula, California is a city located in Riverside County, California, United States. It is situated in the Temecula Valley, a region known for its wineries and vineyards. The city has a population of approximately 112,000 people, making it the second-largest city in Riverside County. Temecula is known for its mild climate, scenic views, and its proximity to major cities such as Los Angeles and San Diego.
Geography
Temecula is located in the Temecula Valley, which is situated between the Santa Ana Mountains to the west and the San Jacinto Mountains to the east. The city is bordered by Murrieta to the north, Lake Elsinore to the east, and San Diego County to the south. The city covers an area of approximately 37 square miles and has an elevation of 1,200 feet.
The city is situated in a Mediterranean climate zone, with hot, dry summers and mild, wet winters. The average annual temperature is around 70 degrees Fahrenheit, with temperatures reaching up to 100 degrees in the summer months. The average annual precipitation is around 12 inches.
Economy
Temecula’s economy is largely based on tourism, with the city’s wineries and vineyards being a major draw for visitors. The city is also home to several large employers, including the Pechanga Resort & Casino, the Temecula Valley Hospital, and the Temecula Valley Unified School District.
The city’s unemployment rate is lower than the national average, and the median household income is higher than the national average. The city’s largest employers are in the healthcare, retail, and hospitality industries.
Demographics
As of the 2020 census, the population of Temecula was 112,000. The racial makeup of the city was 73.2% White, 8.2% African American, 0.7% Native American, 5.3% Asian, 0.2% Pacific Islander, 8.2% from other races, and 4.2% from two or more races. Hispanic or Latino of any race were 22.3% of the population.
The median age in Temecula is 36.5 years, and the median household income is $87,000. The city’s poverty rate is 8.2%, which is lower than the national average.
Conclusion
Temecula, California is a city located in Riverside County, California, United States. It is situated in the Temecula Valley, a region known for its wineries and vineyards. The city has a population of approximately 112,000 people, making it the second-largest city in Riverside County. Temecula is known for its mild climate, scenic views, and its proximity to major cities such as Los Angeles and San Diego. The city’s economy is largely based on tourism, with the city’s wineries and vineyards being a major draw for visitors. The city’s largest employers are in the healthcare, retail, and hospitality industries. The racial makeup of the city is 73.2% White, 8.2% African American, 0.7% Native American, 5.3% Asian, 0.2% Pacific Islander, 8.2% from other races, and 4.2% from two or more races. The median age in Temecula is 36.5 years, and the median household income is $87,000. The city’s poverty rate is 8.2%, which is lower than the national average.
Common Questions
What is Per Capita Income in Temecula?
Per Capita income in Temecula is $42,562.
What is the Median Family Income in Temecula?
Median Family Income in Temecula is $118,519.
What is the Median Household income in Temecula?
Median Household Income in Temecula is $111,881.
What is Income or Wage Gap in Temecula?
Income or Wage Gap in Temecula is 45.7%.
Women in Temecula earn 54.3 cents for every dollar earned by a man.
What is Family Income Deficit in Temecula?
Family Income Deficit in Temecula is $13,701.
Families that are below poverty line in Temecula earn $13,701 less on average than the poverty threshold level.
What is Inequality or Gini Index in Temecula?
Inequality or Gini Index in Temecula is 0.39.
What is the Total Population of Temecula?
Total Population of Temecula is 110,114.
What is the Total Male Population of Temecula?
Total Male Population of Temecula is 54,432.
What is the Total Female Population of Temecula?
Total Female Population of Temecula is 55,682.
What is the Ratio of Males per 100 Females in Temecula?
There are 97.76 Males per 100 Females in Temecula.
What is the Ratio of Females per 100 Males in Temecula?
There are 102.30 Females per 100 Males in Temecula.
What is the Median Population Age in Temecula?
Median Population Age in Temecula is 36.2 Years.
What is the Average Family Size in Temecula
Average Family Size in Temecula is 3.5 People.
What is the Average Household Size in Temecula
Average Household Size in Temecula is 3.1 People.
How Large is the Labor Force in Temecula?
There are 54,016 People in the Labor Forcein in Temecula.
What is the Percentage of People in the Labor Force in Temecula?
65.0% of People are in the Labor Force in Temecula.
What is the Unemployment Rate in Temecula?
Unemployment Rate in Temecula is 5.8%.