Cities with the Largest Black / African American Community in South Carolina
RELATED REPORTS & OPTIONS
Black / African American
South Carolina
Compare Cities
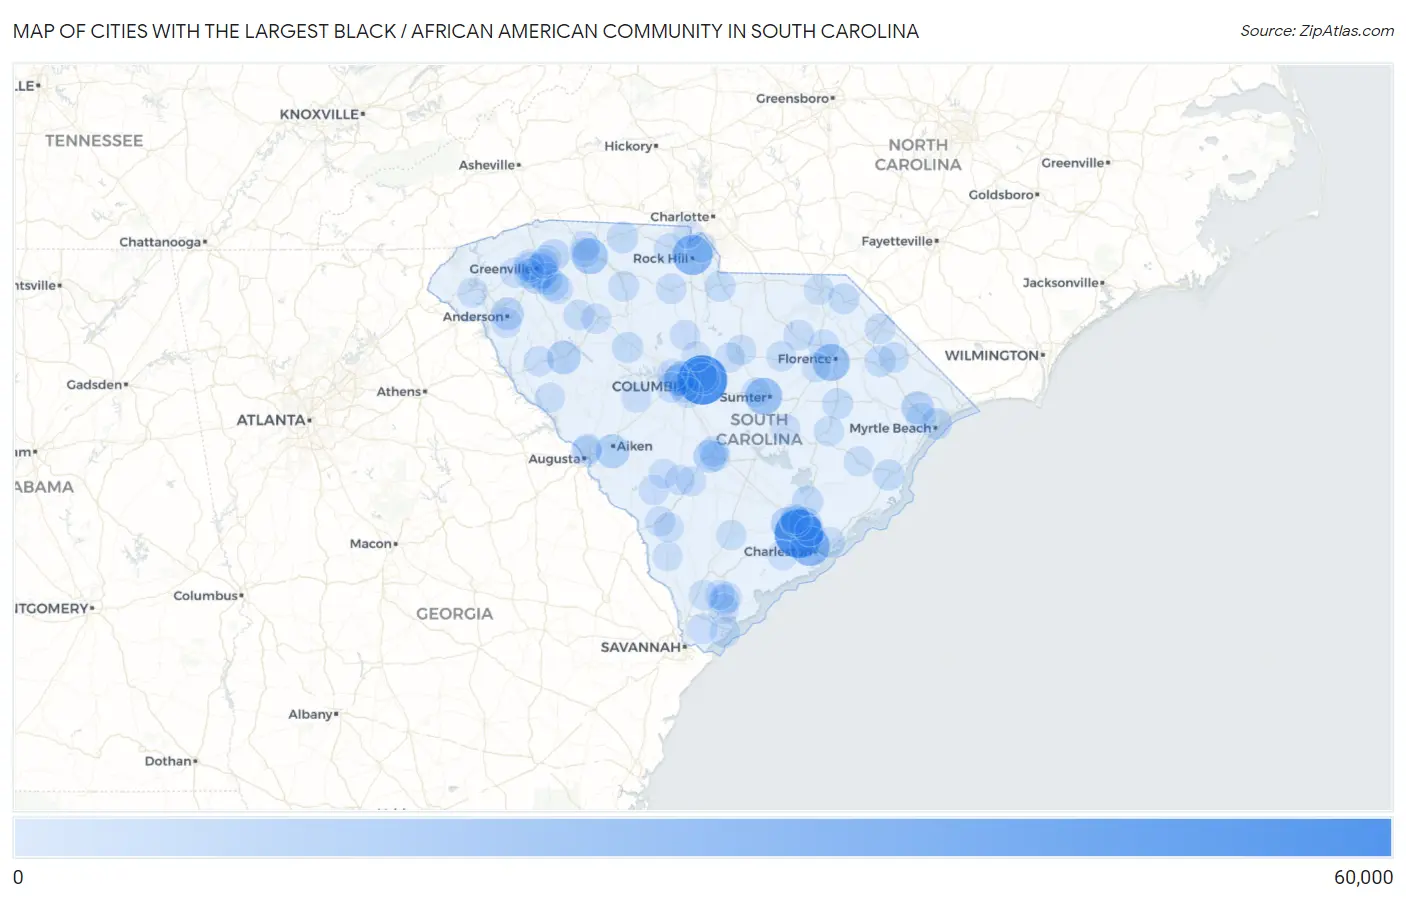
Map of Cities with the Largest Black / African American Community in South Carolina
0
60,000
Cities with the Largest Black / African American Community in South Carolina
| City | Black / African American | vs State | vs National | |
| 1. | Columbia | 55,616 | 1,326,209(4.19%)#1 | 41,288,572(0.13%)#82 |
| 2. | North Charleston | 51,905 | 1,326,209(3.91%)#2 | 41,288,572(0.13%)#92 |
| 3. | Rock Hill | 28,349 | 1,326,209(2.14%)#3 | 41,288,572(0.07%)#171 |
| 4. | Charleston | 27,305 | 1,326,209(2.06%)#4 | 41,288,572(0.07%)#181 |
| 5. | Sumter | 20,400 | 1,326,209(1.54%)#5 | 41,288,572(0.05%)#255 |
| 6. | Florence | 20,123 | 1,326,209(1.52%)#6 | 41,288,572(0.05%)#257 |
| 7. | Spartanburg | 17,217 | 1,326,209(1.30%)#7 | 41,288,572(0.04%)#302 |
| 8. | Greenville | 16,113 | 1,326,209(1.21%)#8 | 41,288,572(0.04%)#328 |
| 9. | St Andrews | 14,806 | 1,326,209(1.12%)#9 | 41,288,572(0.04%)#357 |
| 10. | Dentsville | 12,445 | 1,326,209(0.94%)#10 | 41,288,572(0.03%)#437 |
| 11. | Aiken | 11,562 | 1,326,209(0.87%)#11 | 41,288,572(0.03%)#477 |
| 12. | Greenwood | 10,838 | 1,326,209(0.82%)#12 | 41,288,572(0.03%)#510 |
| 13. | Summerville | 10,234 | 1,326,209(0.77%)#13 | 41,288,572(0.02%)#538 |
| 14. | Orangeburg | 9,661 | 1,326,209(0.73%)#14 | 41,288,572(0.02%)#574 |
| 15. | Goose Creek | 9,570 | 1,326,209(0.72%)#15 | 41,288,572(0.02%)#580 |
| 16. | Anderson | 8,452 | 1,326,209(0.64%)#16 | 41,288,572(0.02%)#666 |
| 17. | Conway | 8,378 | 1,326,209(0.63%)#17 | 41,288,572(0.02%)#676 |
| 18. | Gantt | 7,819 | 1,326,209(0.59%)#18 | 41,288,572(0.02%)#722 |
| 19. | Greer | 6,191 | 1,326,209(0.47%)#19 | 41,288,572(0.01%)#876 |
| 20. | Mauldin | 6,170 | 1,326,209(0.47%)#20 | 41,288,572(0.01%)#883 |
| 21. | Woodfield | 5,685 | 1,326,209(0.43%)#21 | 41,288,572(0.01%)#949 |
| 22. | Myrtle Beach | 5,613 | 1,326,209(0.42%)#22 | 41,288,572(0.01%)#956 |
| 23. | Simpsonville | 5,515 | 1,326,209(0.42%)#23 | 41,288,572(0.01%)#973 |
| 24. | Gaffney | 5,496 | 1,326,209(0.41%)#24 | 41,288,572(0.01%)#975 |
| 25. | Seven Oaks | 4,896 | 1,326,209(0.37%)#25 | 41,288,572(0.01%)#1,074 |
| 26. | Moncks Corner | 4,836 | 1,326,209(0.36%)#26 | 41,288,572(0.01%)#1,085 |
| 27. | Marion | 4,732 | 1,326,209(0.36%)#27 | 41,288,572(0.01%)#1,105 |
| 28. | Newberry | 4,675 | 1,326,209(0.35%)#28 | 41,288,572(0.01%)#1,117 |
| 29. | Ladson | 4,417 | 1,326,209(0.33%)#29 | 41,288,572(0.01%)#1,173 |
| 30. | Lancaster | 4,386 | 1,326,209(0.33%)#30 | 41,288,572(0.01%)#1,176 |
| 31. | Georgetown | 4,348 | 1,326,209(0.33%)#31 | 41,288,572(0.01%)#1,185 |
| 32. | Bennettsville | 4,237 | 1,326,209(0.32%)#32 | 41,288,572(0.01%)#1,222 |
| 33. | Lake City | 4,233 | 1,326,209(0.32%)#33 | 41,288,572(0.01%)#1,223 |
| 34. | Brookdale | 4,001 | 1,326,209(0.30%)#34 | 41,288,572(0.01%)#1,290 |
| 35. | Beaufort | 3,858 | 1,326,209(0.29%)#35 | 41,288,572(0.01%)#1,325 |
| 36. | Darlington | 3,846 | 1,326,209(0.29%)#36 | 41,288,572(0.01%)#1,328 |
| 37. | Union | 3,624 | 1,326,209(0.27%)#37 | 41,288,572(0.01%)#1,389 |
| 38. | Hartsville | 3,619 | 1,326,209(0.27%)#38 | 41,288,572(0.01%)#1,392 |
| 39. | Berea | 3,601 | 1,326,209(0.27%)#39 | 41,288,572(0.01%)#1,397 |
| 40. | North Augusta | 3,450 | 1,326,209(0.26%)#40 | 41,288,572(0.01%)#1,443 |
| 41. | Cayce | 3,428 | 1,326,209(0.26%)#41 | 41,288,572(0.01%)#1,449 |
| 42. | Irmo | 3,403 | 1,326,209(0.26%)#42 | 41,288,572(0.01%)#1,454 |
| 43. | Burton | 3,351 | 1,326,209(0.25%)#43 | 41,288,572(0.01%)#1,472 |
| 44. | Laurens | 3,345 | 1,326,209(0.25%)#44 | 41,288,572(0.01%)#1,482 |
| 45. | Mount Pleasant | 3,333 | 1,326,209(0.25%)#45 | 41,288,572(0.01%)#1,487 |
| 46. | Chester | 3,230 | 1,326,209(0.24%)#46 | 41,288,572(0.01%)#1,530 |
| 47. | Dillon | 3,224 | 1,326,209(0.24%)#47 | 41,288,572(0.01%)#1,533 |
| 48. | West Columbia | 3,102 | 1,326,209(0.23%)#48 | 41,288,572(0.01%)#1,573 |
| 49. | Fountain Inn | 3,055 | 1,326,209(0.23%)#49 | 41,288,572(0.01%)#1,598 |
| 50. | Mullins | 3,002 | 1,326,209(0.23%)#50 | 41,288,572(0.01%)#1,619 |
| 51. | Homeland Park | 2,946 | 1,326,209(0.22%)#51 | 41,288,572(0.01%)#1,644 |
| 52. | Fort Mill | 2,900 | 1,326,209(0.22%)#52 | 41,288,572(0.01%)#1,664 |
| 53. | Clinton | 2,847 | 1,326,209(0.21%)#53 | 41,288,572(0.01%)#1,683 |
| 54. | Parker | 2,800 | 1,326,209(0.21%)#54 | 41,288,572(0.01%)#1,697 |
| 55. | Port Royal | 2,775 | 1,326,209(0.21%)#55 | 41,288,572(0.01%)#1,706 |
| 56. | Barnwell | 2,748 | 1,326,209(0.21%)#56 | 41,288,572(0.01%)#1,722 |
| 57. | Hilton Head Island | 2,675 | 1,326,209(0.20%)#57 | 41,288,572(0.01%)#1,755 |
| 58. | York | 2,666 | 1,326,209(0.20%)#58 | 41,288,572(0.01%)#1,760 |
| 59. | Denmark | 2,659 | 1,326,209(0.20%)#59 | 41,288,572(0.01%)#1,764 |
| 60. | Bluffton | 2,535 | 1,326,209(0.19%)#60 | 41,288,572(0.01%)#1,841 |
| 61. | Camden | 2,518 | 1,326,209(0.19%)#61 | 41,288,572(0.01%)#1,848 |
| 62. | Abbeville | 2,505 | 1,326,209(0.19%)#62 | 41,288,572(0.01%)#1,853 |
| 63. | Lexington | 2,438 | 1,326,209(0.18%)#63 | 41,288,572(0.01%)#1,905 |
| 64. | Taylors | 2,390 | 1,326,209(0.18%)#64 | 41,288,572(0.01%)#1,932 |
| 65. | Easley | 2,328 | 1,326,209(0.18%)#65 | 41,288,572(0.01%)#1,971 |
| 66. | Walterboro | 2,324 | 1,326,209(0.18%)#66 | 41,288,572(0.01%)#1,973 |
| 67. | Cheraw | 2,286 | 1,326,209(0.17%)#67 | 41,288,572(0.01%)#1,998 |
| 68. | Sangaree | 2,227 | 1,326,209(0.17%)#68 | 41,288,572(0.01%)#2,027 |
| 69. | Winnsboro | 2,224 | 1,326,209(0.17%)#69 | 41,288,572(0.01%)#2,031 |
| 70. | Valley Falls | 2,201 | 1,326,209(0.17%)#70 | 41,288,572(0.01%)#2,051 |
| 71. | Andrews | 2,199 | 1,326,209(0.17%)#71 | 41,288,572(0.01%)#2,052 |
| 72. | Capitol View | 2,177 | 1,326,209(0.16%)#72 | 41,288,572(0.01%)#2,066 |
| 73. | Hanahan | 2,175 | 1,326,209(0.16%)#73 | 41,288,572(0.01%)#2,067 |
| 74. | Allendale | 2,174 | 1,326,209(0.16%)#74 | 41,288,572(0.01%)#2,070 |
| 75. | Kingstree | 2,144 | 1,326,209(0.16%)#75 | 41,288,572(0.01%)#2,095 |
| 76. | Bishopville | 2,124 | 1,326,209(0.16%)#76 | 41,288,572(0.01%)#2,115 |
| 77. | Carolina Forest | 2,082 | 1,326,209(0.16%)#77 | 41,288,572(0.01%)#2,153 |
| 78. | Manning | 2,065 | 1,326,209(0.16%)#78 | 41,288,572(0.01%)#2,168 |
| 79. | Batesburg Leesville | 2,041 | 1,326,209(0.15%)#79 | 41,288,572(0.00%)#2,187 |
| 80. | Blythewood | 2,037 | 1,326,209(0.15%)#80 | 41,288,572(0.00%)#2,194 |
| 81. | Lugoff | 2,000 | 1,326,209(0.15%)#81 | 41,288,572(0.00%)#2,217 |
| 82. | Cherryvale | 1,970 | 1,326,209(0.15%)#82 | 41,288,572(0.00%)#2,244 |
| 83. | Bamberg | 1,959 | 1,326,209(0.15%)#83 | 41,288,572(0.00%)#2,254 |
| 84. | Lake Wylie | 1,936 | 1,326,209(0.15%)#84 | 41,288,572(0.00%)#2,272 |
| 85. | Welcome | 1,929 | 1,326,209(0.15%)#85 | 41,288,572(0.00%)#2,277 |
| 86. | Hollywood | 1,913 | 1,326,209(0.14%)#86 | 41,288,572(0.00%)#2,295 |
| 87. | Estill | 1,907 | 1,326,209(0.14%)#87 | 41,288,572(0.00%)#2,304 |
| 88. | Laurel Bay | 1,900 | 1,326,209(0.14%)#88 | 41,288,572(0.00%)#2,309 |
| 89. | Wade Hampton | 1,895 | 1,326,209(0.14%)#89 | 41,288,572(0.00%)#2,312 |
| 90. | White Knoll | 1,885 | 1,326,209(0.14%)#90 | 41,288,572(0.00%)#2,321 |
| 91. | Red Hill | 1,813 | 1,326,209(0.14%)#91 | 41,288,572(0.00%)#2,369 |
| 92. | Mccormick | 1,799 | 1,326,209(0.14%)#92 | 41,288,572(0.00%)#2,383 |
| 93. | Saxon | 1,779 | 1,326,209(0.13%)#93 | 41,288,572(0.00%)#2,403 |
| 94. | Ridgeland | 1,759 | 1,326,209(0.13%)#94 | 41,288,572(0.00%)#2,420 |
| 95. | Timmonsville | 1,746 | 1,326,209(0.13%)#95 | 41,288,572(0.00%)#2,426 |
| 96. | Belvedere | 1,724 | 1,326,209(0.13%)#96 | 41,288,572(0.00%)#2,445 |
| 97. | Blackville | 1,705 | 1,326,209(0.13%)#97 | 41,288,572(0.00%)#2,457 |
| 98. | Seneca | 1,653 | 1,326,209(0.12%)#98 | 41,288,572(0.00%)#2,494 |
| 99. | Fairfax | 1,644 | 1,326,209(0.12%)#99 | 41,288,572(0.00%)#2,510 |
| 100. | Wilkinson Heights | 1,611 | 1,326,209(0.12%)#100 | 41,288,572(0.00%)#2,548 |
Common Questions
What are the Top 10 Cities with the Largest Black / African American Community in South Carolina?
Top 10 Cities with the Largest Black / African American Community in South Carolina are:
#1
55,616
#2
51,905
#3
28,349
#4
27,305
#5
20,400
#6
20,123
#7
17,217
#8
16,113
#9
14,806
#10
12,445
What city has the Largest Black / African American Community in South Carolina?
Columbia has the Largest Black / African American Community in South Carolina with 55,616.
What is the Total Black / African American Population in the State of South Carolina?
Total Black / African American Population in South Carolina is 1,326,209.
What is the Total Black / African American Population in the United States?
Total Black / African American Population in the United States is 41,288,572.