Corona, CA Map & Demographics
Corona Map
Corona Overview
$38,353
PER CAPITA INCOME
$113,508
AVG FAMILY INCOME
$103,727
AVG HOUSEHOLD INCOME
25.2%
WAGE / INCOME GAP [ % ]
74.8¢/ $1
WAGE / INCOME GAP [ $ ]
$10,118
FAMILY INCOME DEFICIT
0.42
INEQUALITY / GINI INDEX
158,346
TOTAL POPULATION
79,651
MALE POPULATION
78,695
FEMALE POPULATION
101.21
MALES / 100 FEMALES
98.80
FEMALES / 100 MALES
35.9
MEDIAN AGE
3.7
AVG FAMILY SIZE
3.4
AVG HOUSEHOLD SIZE
82,238
LABOR FORCE [ PEOPLE ]
66.4%
PERCENT IN LABOR FORCE
4.6%
UNEMPLOYMENT RATE
Income in Corona
Income Overview in Corona
Per Capita Income in Corona is $38,353, while median incomes of families and households are $113,508 and $103,727 respectively.
| Characteristic | Number | Measure |
| Per Capita Income | 158,346 | $38,353 |
| Median Family Income | 38,099 | $113,508 |
| Mean Family Income | 38,099 | $134,288 |
| Median Household Income | 46,524 | $103,727 |
| Mean Household Income | 46,524 | $126,569 |
| Income Deficit | 38,099 | $10,118 |
| Wage / Income Gap (%) | 158,346 | 25.24% |
| Wage / Income Gap ($) | 158,346 | 74.76¢ per $1 |
| Gini / Inequality Index | 158,346 | 0.42 |
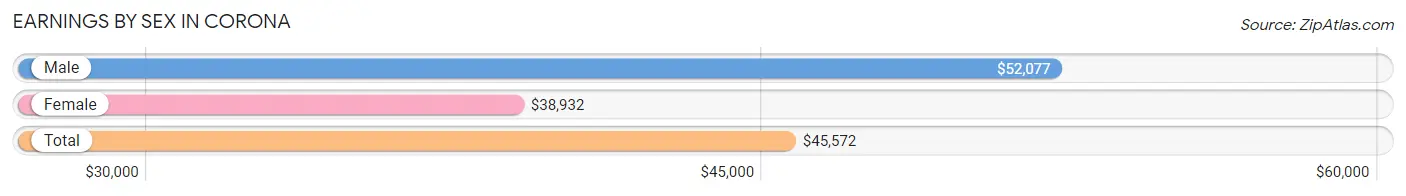
Earnings by Sex in Corona
Average Earnings in Corona are $45,572, $52,077 for men and $38,932 for women, a difference of 25.2%.
| Sex | Number | Average Earnings |
| Male | 45,224 (54.5%) | $52,077 |
| Female | 37,723 (45.5%) | $38,932 |
| Total | 82,947 (100.0%) | $45,572 |
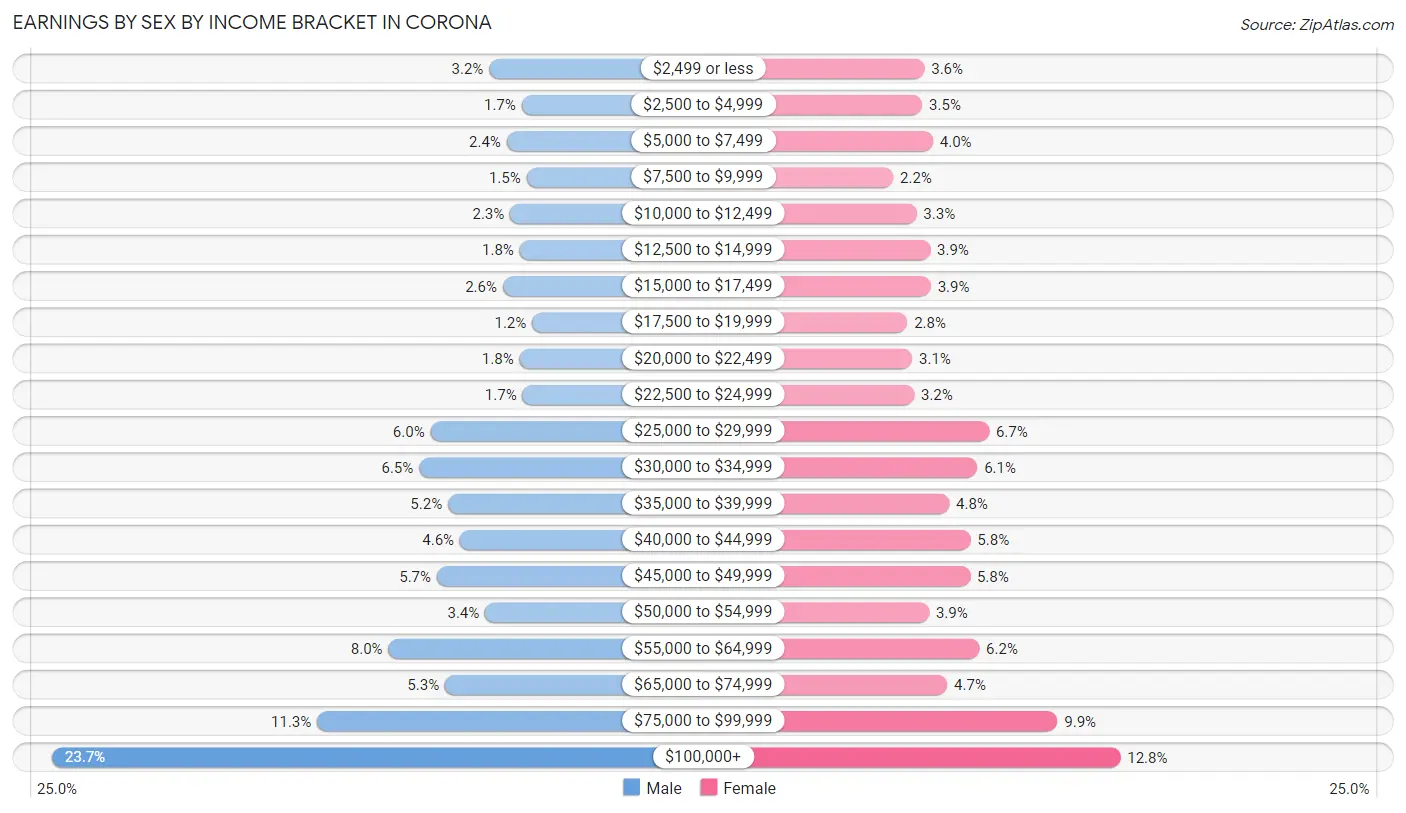
Earnings by Sex by Income Bracket in Corona
The most common earnings brackets in Corona are $100,000+ for men (10,725 | 23.7%) and $100,000+ for women (4,831 | 12.8%).
| Income | Male | Female |
| $2,499 or less | 1,466 (3.2%) | 1,369 (3.6%) |
| $2,500 to $4,999 | 778 (1.7%) | 1,330 (3.5%) |
| $5,000 to $7,499 | 1,094 (2.4%) | 1,519 (4.0%) |
| $7,500 to $9,999 | 675 (1.5%) | 818 (2.2%) |
| $10,000 to $12,499 | 1,023 (2.3%) | 1,229 (3.3%) |
| $12,500 to $14,999 | 820 (1.8%) | 1,473 (3.9%) |
| $15,000 to $17,499 | 1,176 (2.6%) | 1,484 (3.9%) |
| $17,500 to $19,999 | 557 (1.2%) | 1,067 (2.8%) |
| $20,000 to $22,499 | 824 (1.8%) | 1,154 (3.1%) |
| $22,500 to $24,999 | 762 (1.7%) | 1,188 (3.2%) |
| $25,000 to $29,999 | 2,711 (6.0%) | 2,511 (6.7%) |
| $30,000 to $34,999 | 2,949 (6.5%) | 2,304 (6.1%) |
| $35,000 to $39,999 | 2,337 (5.2%) | 1,806 (4.8%) |
| $40,000 to $44,999 | 2,085 (4.6%) | 2,183 (5.8%) |
| $45,000 to $49,999 | 2,574 (5.7%) | 2,176 (5.8%) |
| $50,000 to $54,999 | 1,551 (3.4%) | 1,451 (3.8%) |
| $55,000 to $64,999 | 3,602 (8.0%) | 2,338 (6.2%) |
| $65,000 to $74,999 | 2,403 (5.3%) | 1,772 (4.7%) |
| $75,000 to $99,999 | 5,112 (11.3%) | 3,720 (9.9%) |
| $100,000+ | 10,725 (23.7%) | 4,831 (12.8%) |
| Total | 45,224 (100.0%) | 37,723 (100.0%) |
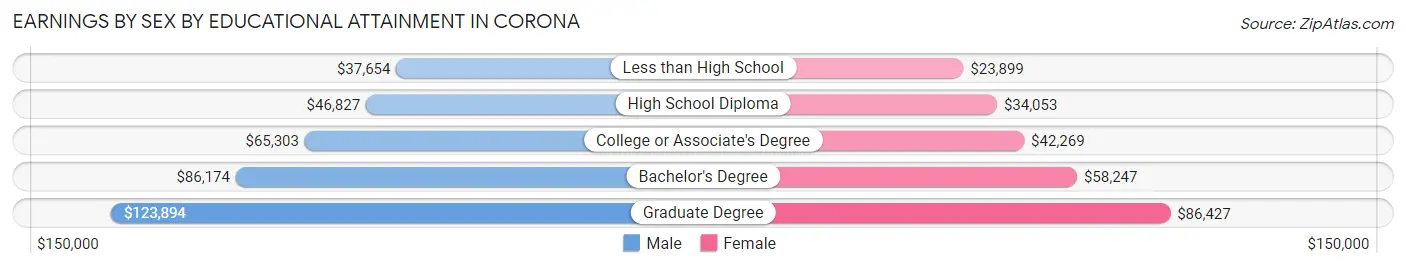
Earnings by Sex by Educational Attainment in Corona
Average earnings in Corona are $60,022 for men and $44,513 for women, a difference of 25.8%. Men with an educational attainment of graduate degree enjoy the highest average annual earnings of $123,894, while those with less than high school education earn the least with $37,654. Women with an educational attainment of graduate degree earn the most with the average annual earnings of $86,427, while those with less than high school education have the smallest earnings of $23,899.
| Educational Attainment | Male Income | Female Income |
| Less than High School | $37,654 | $23,899 |
| High School Diploma | $46,827 | $34,053 |
| College or Associate's Degree | $65,303 | $42,269 |
| Bachelor's Degree | $86,174 | $58,247 |
| Graduate Degree | $123,894 | $86,427 |
| Total | $60,022 | $44,513 |
Family Income in Corona
Family Income Brackets in Corona
According to the Corona family income data, there are 8,572 families falling into the $100,000 to $149,999 income range, which is the most common income bracket and makes up 22.5% of all families. Conversely, the $10,000 to $14,999 income bracket is the least frequent group with only 571 families (1.5%) belonging to this category.
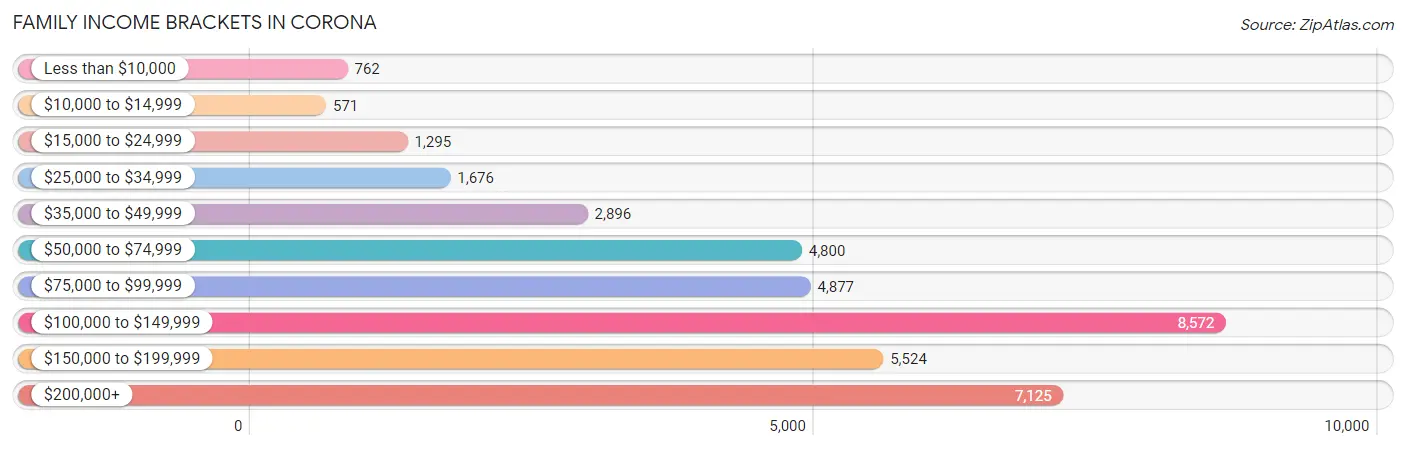
| Income Bracket | # Families | % Families |
| Less than $10,000 | 762 | 2.0% |
| $10,000 to $14,999 | 571 | 1.5% |
| $15,000 to $24,999 | 1,295 | 3.4% |
| $25,000 to $34,999 | 1,676 | 4.4% |
| $35,000 to $49,999 | 2,896 | 7.6% |
| $50,000 to $74,999 | 4,800 | 12.6% |
| $75,000 to $99,999 | 4,877 | 12.8% |
| $100,000 to $149,999 | 8,572 | 22.5% |
| $150,000 to $199,999 | 5,524 | 14.5% |
| $200,000+ | 7,125 | 18.7% |
Family Income by Famaliy Size in Corona
7+ person families (1,285 | 3.4%) account for the highest median family income in Corona with $161,490 per family, while 2-person families (11,898 | 31.2%) have the highest median income of $47,026 per family member.
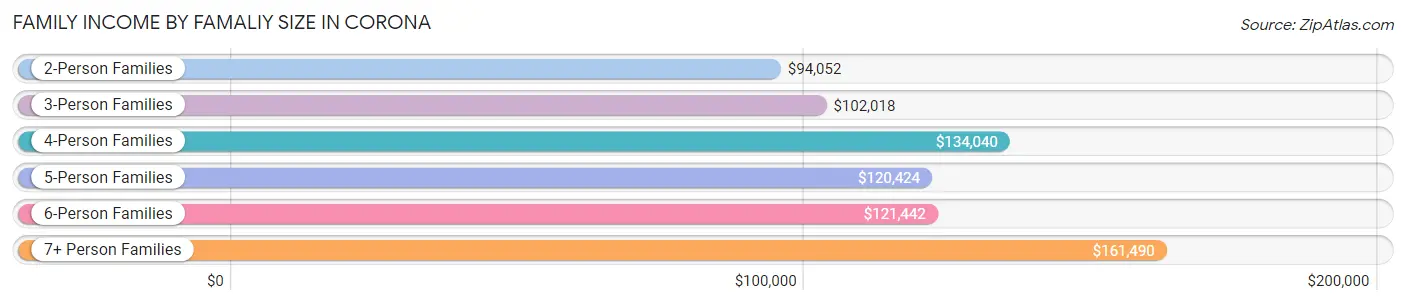
| Income Bracket | # Families | Median Income |
| 2-Person Families | 11,898 (31.2%) | $94,052 |
| 3-Person Families | 8,926 (23.4%) | $102,018 |
| 4-Person Families | 8,717 (22.9%) | $134,040 |
| 5-Person Families | 4,911 (12.9%) | $120,424 |
| 6-Person Families | 2,362 (6.2%) | $121,442 |
| 7+ Person Families | 1,285 (3.4%) | $161,490 |
| Total | 38,099 (100.0%) | $113,508 |
Family Income by Number of Earners in Corona
The median family income in Corona is $113,508, with families comprising 3+ earners (7,169) having the highest median family income of $161,817, while families with no earners (3,611) have the lowest median family income of $49,482, accounting for 18.8% and 9.5% of families, respectively.
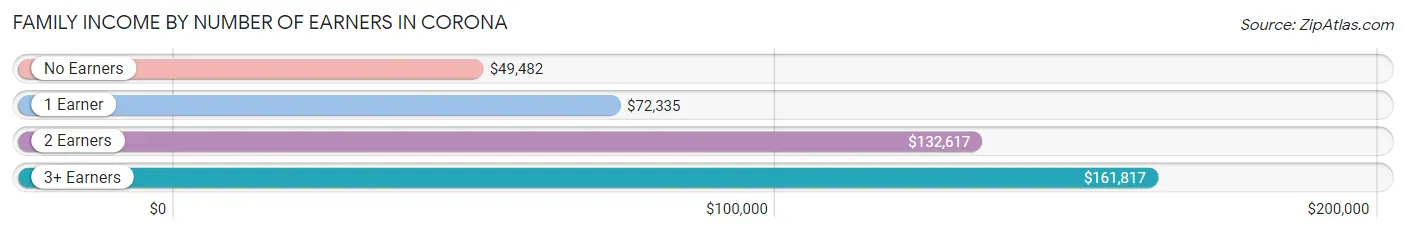
| Number of Earners | # Families | Median Income |
| No Earners | 3,611 (9.5%) | $49,482 |
| 1 Earner | 10,703 (28.1%) | $72,335 |
| 2 Earners | 16,616 (43.6%) | $132,617 |
| 3+ Earners | 7,169 (18.8%) | $161,817 |
| Total | 38,099 (100.0%) | $113,508 |
Household Income in Corona
Household Income Brackets in Corona
With 10,096 households falling in the category, the $100,000 to $149,999 income range is the most frequent in Corona, accounting for 21.7% of all households. In contrast, only 1,070 households (2.3%) fall into the $10,000 to $14,999 income bracket, making it the least populous group.
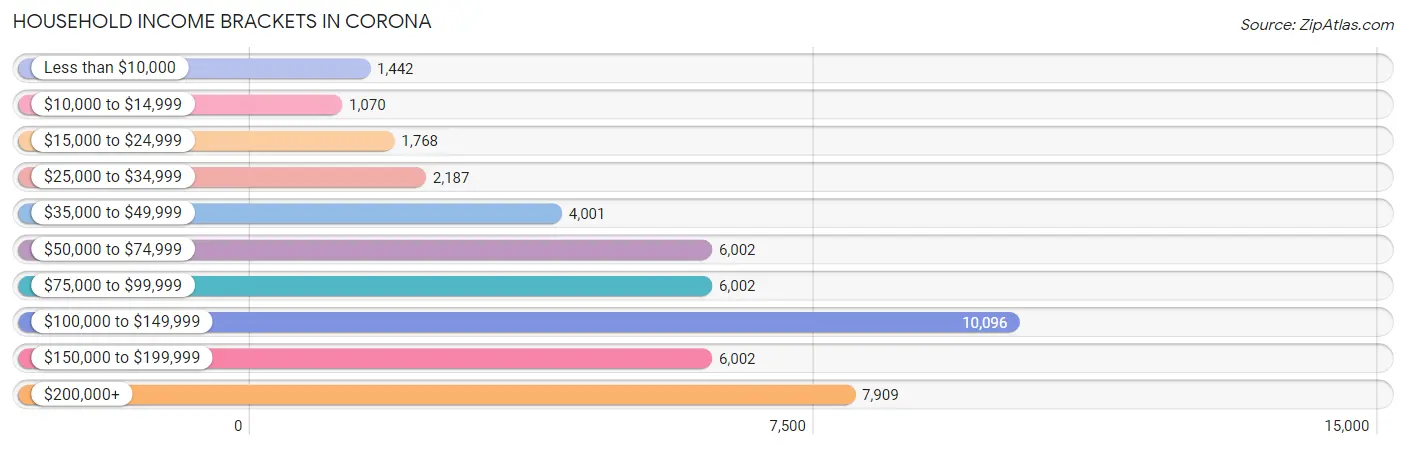
| Income Bracket | # Households | % Households |
| Less than $10,000 | 1,442 | 3.1% |
| $10,000 to $14,999 | 1,070 | 2.3% |
| $15,000 to $24,999 | 1,768 | 3.8% |
| $25,000 to $34,999 | 2,187 | 4.7% |
| $35,000 to $49,999 | 4,001 | 8.6% |
| $50,000 to $74,999 | 6,002 | 12.9% |
| $75,000 to $99,999 | 6,002 | 12.9% |
| $100,000 to $149,999 | 10,096 | 21.7% |
| $150,000 to $199,999 | 6,002 | 12.9% |
| $200,000+ | 7,909 | 17.0% |
Household Income by Householder Age in Corona
The median household income in Corona is $103,727, with the highest median household income of $124,375 found in the 45 to 64 years age bracket for the primary householder. A total of 20,700 households (44.5%) fall into this category. Meanwhile, the 15 to 24 years age bracket for the primary householder has the lowest median household income of $53,401, with 767 households (1.7%) in this group.
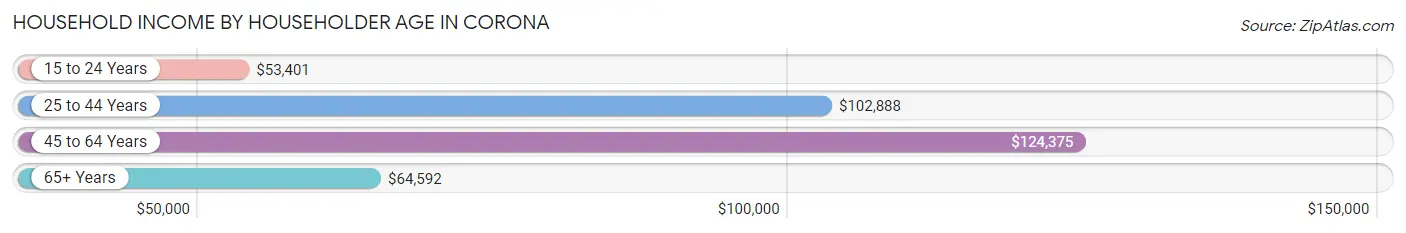
| Income Bracket | # Households | Median Income |
| 15 to 24 Years | 767 (1.7%) | $53,401 |
| 25 to 44 Years | 16,434 (35.3%) | $102,888 |
| 45 to 64 Years | 20,700 (44.5%) | $124,375 |
| 65+ Years | 8,623 (18.5%) | $64,592 |
| Total | 46,524 (100.0%) | $103,727 |
Poverty in Corona
Income Below Poverty by Sex and Age in Corona
With 7.6% poverty level for males and 9.5% for females among the residents of Corona, 5 year old males and 75 year old and over females are the most vulnerable to poverty, with 155 males (12.9%) and 607 females (16.1%) in their respective age groups living below the poverty level.
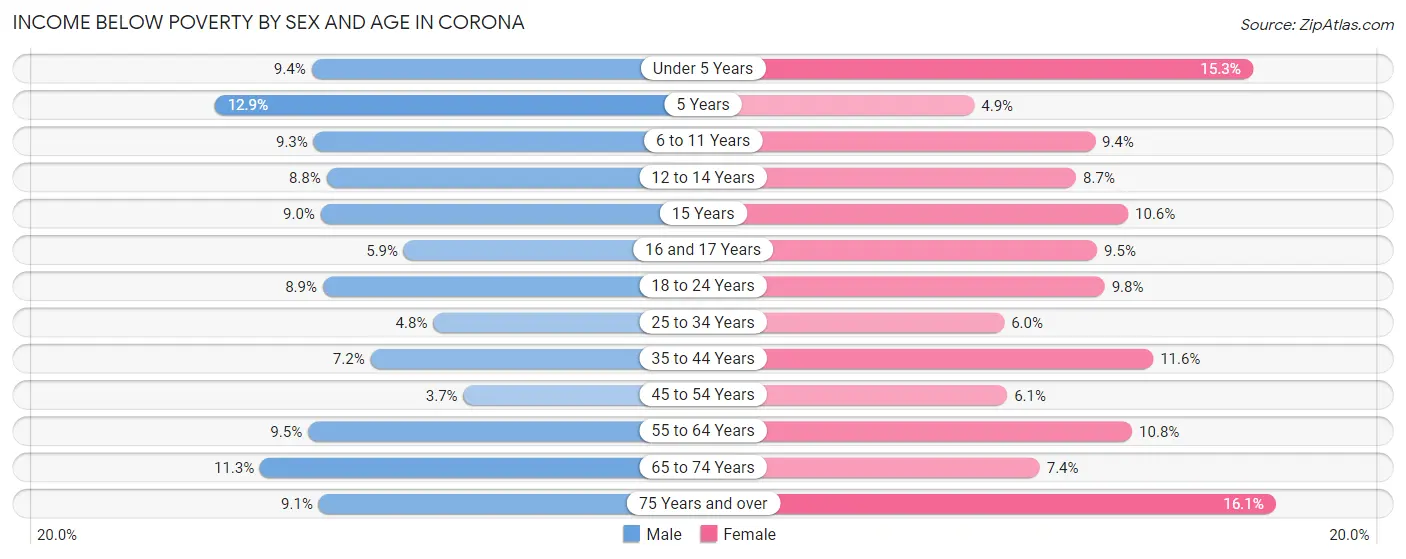
| Age Bracket | Male | Female |
| Under 5 Years | 441 (9.3%) | 697 (15.2%) |
| 5 Years | 155 (12.9%) | 33 (4.9%) |
| 6 to 11 Years | 649 (9.3%) | 561 (9.4%) |
| 12 to 14 Years | 349 (8.8%) | 293 (8.7%) |
| 15 Years | 116 (9.0%) | 151 (10.6%) |
| 16 and 17 Years | 135 (5.9%) | 214 (9.5%) |
| 18 to 24 Years | 764 (8.9%) | 786 (9.8%) |
| 25 to 34 Years | 533 (4.8%) | 653 (6.0%) |
| 35 to 44 Years | 764 (7.2%) | 1,312 (11.6%) |
| 45 to 54 Years | 404 (3.7%) | 701 (6.1%) |
| 55 to 64 Years | 911 (9.5%) | 986 (10.8%) |
| 65 to 74 Years | 586 (11.3%) | 399 (7.3%) |
| 75 Years and over | 252 (9.1%) | 607 (16.1%) |
| Total | 6,059 (7.6%) | 7,393 (9.5%) |
Income Above Poverty by Sex and Age in Corona
According to the poverty statistics in Corona, males aged 45 to 54 years and females aged 5 years are the age groups that are most secure financially, with 96.3% of males and 95.1% of females in these age groups living above the poverty line.
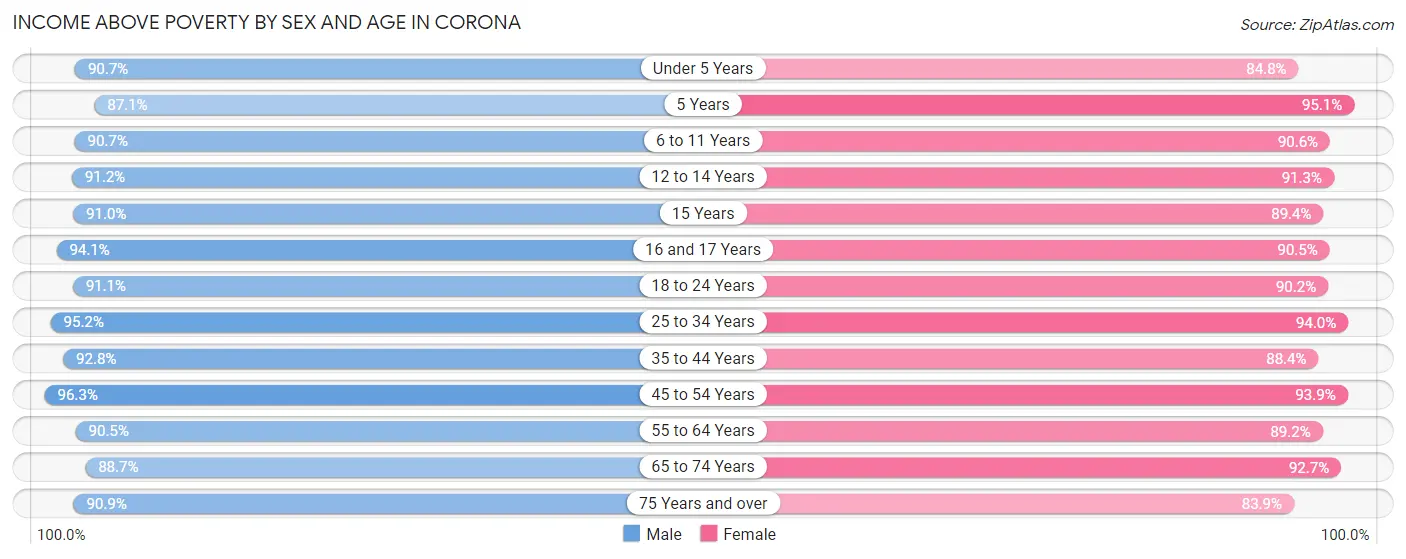
| Age Bracket | Male | Female |
| Under 5 Years | 4,276 (90.6%) | 3,874 (84.8%) |
| 5 Years | 1,043 (87.1%) | 638 (95.1%) |
| 6 to 11 Years | 6,349 (90.7%) | 5,405 (90.6%) |
| 12 to 14 Years | 3,621 (91.2%) | 3,073 (91.3%) |
| 15 Years | 1,171 (91.0%) | 1,270 (89.4%) |
| 16 and 17 Years | 2,147 (94.1%) | 2,044 (90.5%) |
| 18 to 24 Years | 7,792 (91.1%) | 7,267 (90.2%) |
| 25 to 34 Years | 10,507 (95.2%) | 10,173 (94.0%) |
| 35 to 44 Years | 9,904 (92.8%) | 10,039 (88.4%) |
| 45 to 54 Years | 10,481 (96.3%) | 10,723 (93.9%) |
| 55 to 64 Years | 8,698 (90.5%) | 8,158 (89.2%) |
| 65 to 74 Years | 4,616 (88.7%) | 5,030 (92.6%) |
| 75 Years and over | 2,522 (90.9%) | 3,164 (83.9%) |
| Total | 73,127 (92.3%) | 70,858 (90.5%) |
Income Below Poverty Among Married-Couple Families in Corona
The poverty statistics for married-couple families in Corona show that 4.8% or 1,380 of the total 28,659 families live below the poverty line. Families with 5 or more children have the highest poverty rate of 13.2%, comprising of 25 families. On the other hand, families with 1 or 2 children have the lowest poverty rate of 3.4%, which includes 376 families.
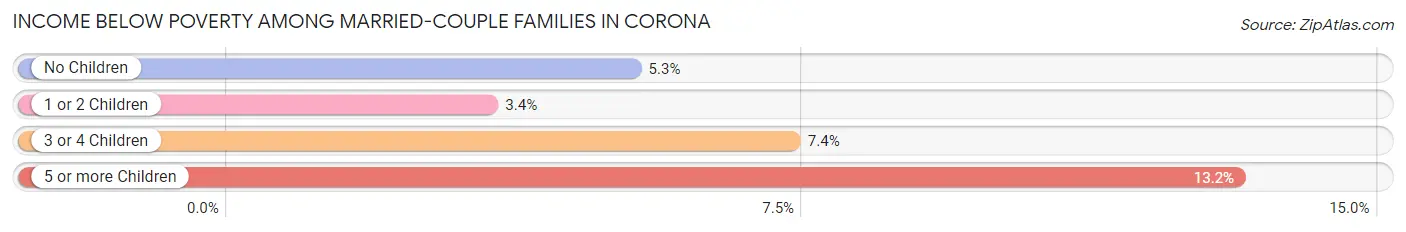
| Children | Above Poverty | Below Poverty |
| No Children | 13,703 (94.7%) | 763 (5.3%) |
| 1 or 2 Children | 10,690 (96.6%) | 376 (3.4%) |
| 3 or 4 Children | 2,721 (92.6%) | 216 (7.3%) |
| 5 or more Children | 165 (86.8%) | 25 (13.2%) |
| Total | 27,279 (95.2%) | 1,380 (4.8%) |
Income Below Poverty Among Single-Parent Households in Corona
According to the poverty data in Corona, 10.2% or 278 single-father households and 17.1% or 1,150 single-mother households are living below the poverty line. Among single-father households, those with 3 or 4 children have the highest poverty rate, with 59 households (23.6%) experiencing poverty. Likewise, among single-mother households, those with 3 or 4 children have the highest poverty rate, with 240 households (43.6%) falling below the poverty line.
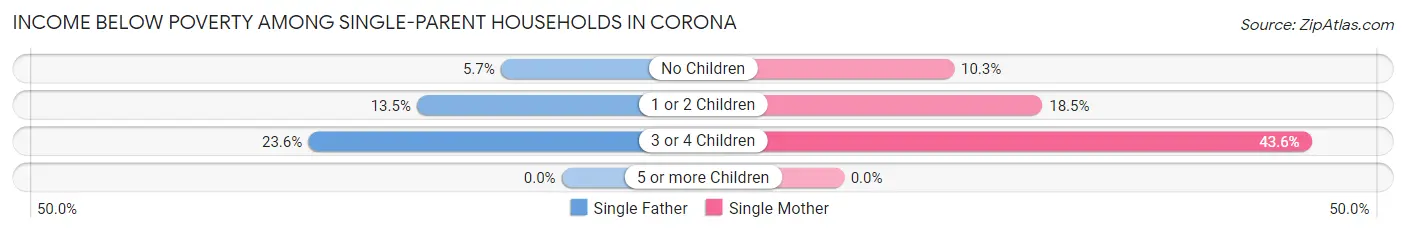
| Children | Single Father | Single Mother |
| No Children | 83 (5.7%) | 289 (10.3%) |
| 1 or 2 Children | 136 (13.5%) | 621 (18.5%) |
| 3 or 4 Children | 59 (23.6%) | 240 (43.6%) |
| 5 or more Children | 0 (0.0%) | 0 (0.0%) |
| Total | 278 (10.2%) | 1,150 (17.1%) |
Income Below Poverty Among Married-Couple vs Single-Parent Households in Corona
The poverty data for Corona shows that 1,380 of the married-couple family households (4.8%) and 1,428 of the single-parent households (15.1%) are living below the poverty level. Within the married-couple family households, those with 5 or more children have the highest poverty rate, with 25 households (13.2%) falling below the poverty line. Among the single-parent households, those with 3 or 4 children have the highest poverty rate, with 299 household (37.3%) living below poverty.
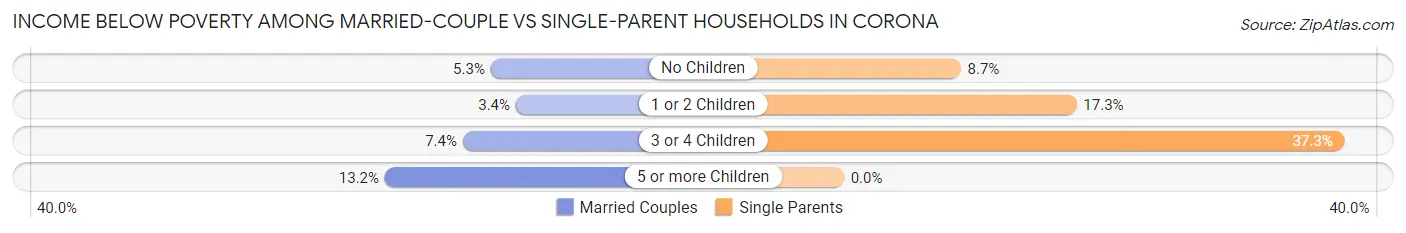
| Children | Married-Couple Families | Single-Parent Households |
| No Children | 763 (5.3%) | 372 (8.7%) |
| 1 or 2 Children | 376 (3.4%) | 757 (17.3%) |
| 3 or 4 Children | 216 (7.3%) | 299 (37.3%) |
| 5 or more Children | 25 (13.2%) | 0 (0.0%) |
| Total | 1,380 (4.8%) | 1,428 (15.1%) |
Race in Corona
The most populous races in Corona are Hispanic or Latino (76,626 | 48.4%), White / Caucasian (73,293 | 46.3%), and Some other Race (34,934 | 22.1%).
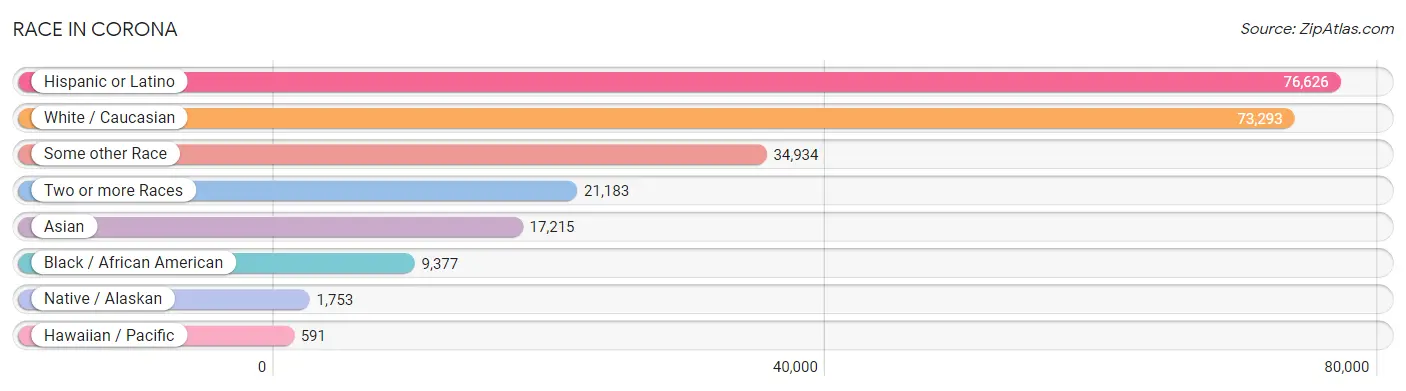
| Race | # Population | % Population |
| Asian | 17,215 | 10.9% |
| Black / African American | 9,377 | 5.9% |
| Hawaiian / Pacific | 591 | 0.4% |
| Hispanic or Latino | 76,626 | 48.4% |
| Native / Alaskan | 1,753 | 1.1% |
| White / Caucasian | 73,293 | 46.3% |
| Two or more Races | 21,183 | 13.4% |
| Some other Race | 34,934 | 22.1% |
| Total | 158,346 | 100.0% |
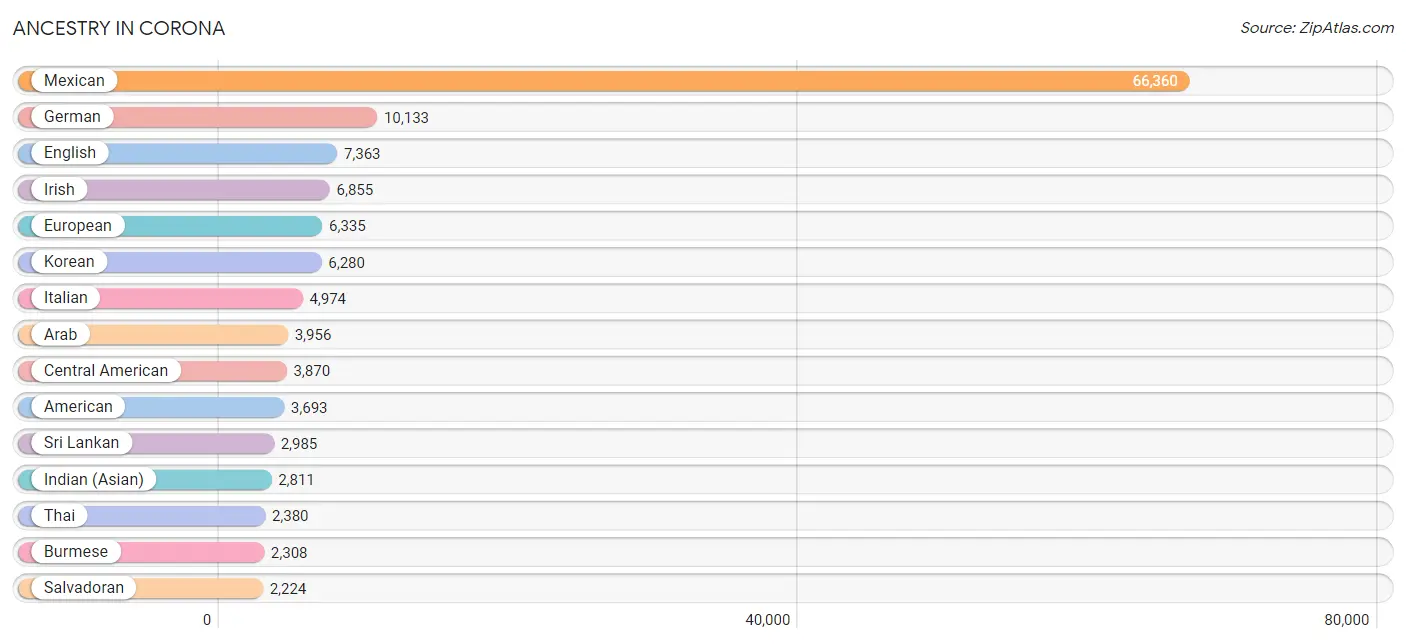
Ancestry in Corona
The most populous ancestries reported in Corona are Mexican (66,360 | 41.9%), German (10,133 | 6.4%), English (7,363 | 4.6%), Irish (6,855 | 4.3%), and European (6,335 | 4.0%), together accounting for 61.3% of all Corona residents.
| Ancestry | # Population | % Population |
| Afghan | 700 | 0.4% |
| African | 309 | 0.2% |
| Albanian | 4 | 0.0% |
| Aleut | 16 | 0.0% |
| American | 3,693 | 2.3% |
| Apache | 133 | 0.1% |
| Arab | 3,956 | 2.5% |
| Argentinean | 154 | 0.1% |
| Armenian | 263 | 0.2% |
| Assyrian / Chaldean / Syriac | 38 | 0.0% |
| Australian | 15 | 0.0% |
| Austrian | 228 | 0.1% |
| Basque | 46 | 0.0% |
| Belgian | 91 | 0.1% |
| Belizean | 12 | 0.0% |
| Bhutanese | 955 | 0.6% |
| Blackfeet | 54 | 0.0% |
| Bolivian | 36 | 0.0% |
| Brazilian | 178 | 0.1% |
| British | 588 | 0.4% |
| Burmese | 2,308 | 1.5% |
| Cajun | 28 | 0.0% |
| Cambodian | 127 | 0.1% |
| Canadian | 352 | 0.2% |
| Central American | 3,870 | 2.4% |
| Central American Indian | 143 | 0.1% |
| Cherokee | 170 | 0.1% |
| Chickasaw | 115 | 0.1% |
| Chilean | 53 | 0.0% |
| Chippewa | 179 | 0.1% |
| Choctaw | 143 | 0.1% |
| Colombian | 442 | 0.3% |
| Costa Rican | 166 | 0.1% |
| Creek | 34 | 0.0% |
| Croatian | 183 | 0.1% |
| Cuban | 1,141 | 0.7% |
| Czech | 661 | 0.4% |
| Czechoslovakian | 59 | 0.0% |
| Danish | 631 | 0.4% |
| Dominican | 106 | 0.1% |
| Dutch | 1,220 | 0.8% |
| Eastern European | 287 | 0.2% |
| Ecuadorian | 235 | 0.2% |
| Egyptian | 545 | 0.3% |
| English | 7,363 | 4.6% |
| Estonian | 7 | 0.0% |
| Ethiopian | 87 | 0.1% |
| European | 6,335 | 4.0% |
| Filipino | 221 | 0.1% |
| Finnish | 132 | 0.1% |
| French | 1,665 | 1.1% |
| French American Indian | 115 | 0.1% |
| French Canadian | 477 | 0.3% |
| German | 10,133 | 6.4% |
| Ghanaian | 201 | 0.1% |
| Greek | 305 | 0.2% |
| Guamanian / Chamorro | 72 | 0.1% |
| Guatemalan | 768 | 0.5% |
| Guyanese | 10 | 0.0% |
| Haitian | 64 | 0.0% |
| Honduran | 267 | 0.2% |
| Hungarian | 312 | 0.2% |
| Icelander | 42 | 0.0% |
| Indian (Asian) | 2,811 | 1.8% |
| Indonesian | 42 | 0.0% |
| Iranian | 647 | 0.4% |
| Iraqi | 362 | 0.2% |
| Irish | 6,855 | 4.3% |
| Iroquois | 195 | 0.1% |
| Israeli | 79 | 0.1% |
| Italian | 4,974 | 3.1% |
| Jamaican | 82 | 0.1% |
| Japanese | 410 | 0.3% |
| Jordanian | 185 | 0.1% |
| Kenyan | 165 | 0.1% |
| Korean | 6,280 | 4.0% |
| Laotian | 236 | 0.2% |
| Lebanese | 693 | 0.4% |
| Liberian | 21 | 0.0% |
| Lithuanian | 174 | 0.1% |
| Lumbee | 45 | 0.0% |
| Malaysian | 223 | 0.1% |
| Maltese | 138 | 0.1% |
| Mexican | 66,360 | 41.9% |
| Mexican American Indian | 1,101 | 0.7% |
| Moroccan | 3 | 0.0% |
| Native Hawaiian | 473 | 0.3% |
| Navajo | 68 | 0.0% |
| Nicaraguan | 365 | 0.2% |
| Nigerian | 236 | 0.2% |
| Northern European | 130 | 0.1% |
| Norwegian | 1,391 | 0.9% |
| Pakistani | 207 | 0.1% |
| Palestinian | 521 | 0.3% |
| Panamanian | 80 | 0.1% |
| Pennsylvania German | 41 | 0.0% |
| Peruvian | 477 | 0.3% |
| Polish | 1,804 | 1.1% |
| Portuguese | 451 | 0.3% |
| Pueblo | 11 | 0.0% |
| Puerto Rican | 1,459 | 0.9% |
| Romanian | 542 | 0.3% |
| Russian | 473 | 0.3% |
| Salvadoran | 2,224 | 1.4% |
| Samoan | 41 | 0.0% |
| Scandinavian | 258 | 0.2% |
| Scotch-Irish | 457 | 0.3% |
| Scottish | 1,330 | 0.8% |
| Serbian | 22 | 0.0% |
| Slavic | 34 | 0.0% |
| Slovak | 54 | 0.0% |
| Slovene | 6 | 0.0% |
| South African | 30 | 0.0% |
| South American | 1,422 | 0.9% |
| South American Indian | 42 | 0.0% |
| Spaniard | 821 | 0.5% |
| Spanish | 647 | 0.4% |
| Spanish American | 7 | 0.0% |
| Sri Lankan | 2,985 | 1.9% |
| Subsaharan African | 972 | 0.6% |
| Swedish | 1,375 | 0.9% |
| Swiss | 182 | 0.1% |
| Syrian | 576 | 0.4% |
| Thai | 2,380 | 1.5% |
| Tongan | 242 | 0.2% |
| Turkish | 43 | 0.0% |
| Ukrainian | 122 | 0.1% |
| Uruguayan | 9 | 0.0% |
| Ute | 22 | 0.0% |
| Vietnamese | 195 | 0.1% |
| Welsh | 648 | 0.4% |
| West Indian | 48 | 0.0% |
| Yaqui | 6 | 0.0% |
| Yugoslavian | 25 | 0.0% | View All 134 Rows |
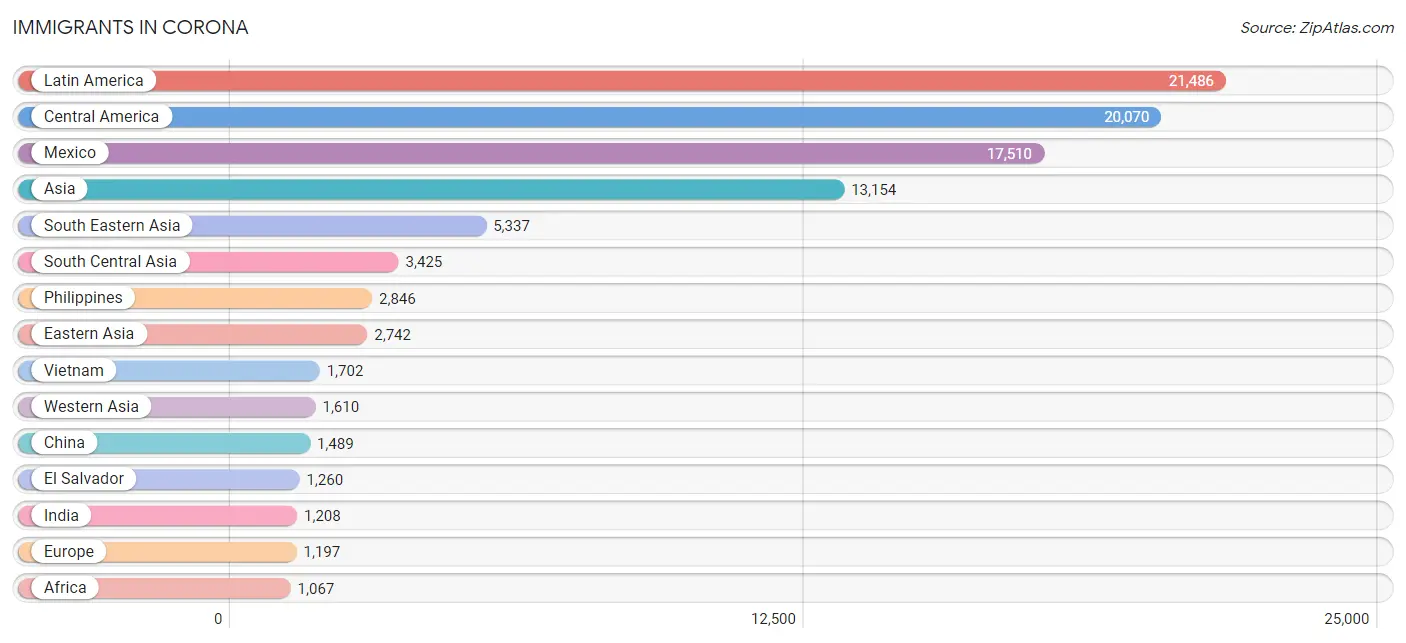
Immigrants in Corona
The most numerous immigrant groups reported in Corona came from Latin America (21,486 | 13.6%), Central America (20,070 | 12.7%), Mexico (17,510 | 11.1%), Asia (13,154 | 8.3%), and South Eastern Asia (5,337 | 3.4%), together accounting for 49.0% of all Corona residents.
| Immigration Origin | # Population | % Population |
| Afghanistan | 775 | 0.5% |
| Africa | 1,067 | 0.7% |
| Argentina | 105 | 0.1% |
| Armenia | 102 | 0.1% |
| Asia | 13,154 | 8.3% |
| Australia | 37 | 0.0% |
| Bangladesh | 96 | 0.1% |
| Barbados | 20 | 0.0% |
| Belgium | 28 | 0.0% |
| Belize | 93 | 0.1% |
| Bolivia | 36 | 0.0% |
| Bosnia and Herzegovina | 11 | 0.0% |
| Brazil | 125 | 0.1% |
| Bulgaria | 2 | 0.0% |
| Cambodia | 251 | 0.2% |
| Canada | 575 | 0.4% |
| Caribbean | 431 | 0.3% |
| Central America | 20,070 | 12.7% |
| Chile | 51 | 0.0% |
| China | 1,489 | 0.9% |
| Colombia | 231 | 0.2% |
| Costa Rica | 61 | 0.0% |
| Croatia | 41 | 0.0% |
| Cuba | 254 | 0.2% |
| Czechoslovakia | 60 | 0.0% |
| Denmark | 15 | 0.0% |
| Dominican Republic | 59 | 0.0% |
| Eastern Africa | 272 | 0.2% |
| Eastern Asia | 2,742 | 1.7% |
| Eastern Europe | 515 | 0.3% |
| Ecuador | 56 | 0.0% |
| Egypt | 479 | 0.3% |
| El Salvador | 1,260 | 0.8% |
| England | 188 | 0.1% |
| Eritrea | 39 | 0.0% |
| Ethiopia | 34 | 0.0% |
| Europe | 1,197 | 0.8% |
| Fiji | 59 | 0.0% |
| France | 42 | 0.0% |
| Germany | 150 | 0.1% |
| Ghana | 43 | 0.0% |
| Greece | 8 | 0.0% |
| Guatemala | 577 | 0.4% |
| Haiti | 45 | 0.0% |
| Honduras | 212 | 0.1% |
| Hong Kong | 46 | 0.0% |
| Hungary | 13 | 0.0% |
| India | 1,208 | 0.8% |
| Indonesia | 219 | 0.1% |
| Iran | 468 | 0.3% |
| Iraq | 447 | 0.3% |
| Ireland | 25 | 0.0% |
| Israel | 21 | 0.0% |
| Italy | 9 | 0.0% |
| Jamaica | 32 | 0.0% |
| Japan | 191 | 0.1% |
| Jordan | 138 | 0.1% |
| Kazakhstan | 28 | 0.0% |
| Kenya | 119 | 0.1% |
| Korea | 1,041 | 0.7% |
| Kuwait | 61 | 0.0% |
| Laos | 88 | 0.1% |
| Latin America | 21,486 | 13.6% |
| Lebanon | 315 | 0.2% |
| Mexico | 17,510 | 11.1% |
| Middle Africa | 56 | 0.0% |
| Morocco | 3 | 0.0% |
| Nepal | 24 | 0.0% |
| Netherlands | 36 | 0.0% |
| Nicaragua | 326 | 0.2% |
| Nigeria | 92 | 0.1% |
| Northern Africa | 492 | 0.3% |
| Northern Europe | 379 | 0.2% |
| Oceania | 197 | 0.1% |
| Pakistan | 726 | 0.5% |
| Panama | 31 | 0.0% |
| Peru | 365 | 0.2% |
| Philippines | 2,846 | 1.8% |
| Poland | 107 | 0.1% |
| Romania | 227 | 0.1% |
| Russia | 23 | 0.0% |
| Saudi Arabia | 27 | 0.0% |
| Scotland | 3 | 0.0% |
| Singapore | 26 | 0.0% |
| South Africa | 30 | 0.0% |
| South America | 985 | 0.6% |
| South Central Asia | 3,425 | 2.2% |
| South Eastern Asia | 5,337 | 3.4% |
| Southern Europe | 44 | 0.0% |
| Spain | 18 | 0.0% |
| Sri Lanka | 72 | 0.1% |
| St. Vincent and the Grenadines | 7 | 0.0% |
| Sudan | 10 | 0.0% |
| Sweden | 11 | 0.0% |
| Switzerland | 3 | 0.0% |
| Syria | 406 | 0.3% |
| Taiwan | 310 | 0.2% |
| Thailand | 115 | 0.1% |
| Trinidad and Tobago | 14 | 0.0% |
| Turkey | 26 | 0.0% |
| Uganda | 37 | 0.0% |
| Ukraine | 18 | 0.0% |
| Uruguay | 9 | 0.0% |
| Uzbekistan | 19 | 0.0% |
| Venezuela | 7 | 0.0% |
| Vietnam | 1,702 | 1.1% |
| Western Africa | 152 | 0.1% |
| Western Asia | 1,610 | 1.0% |
| Western Europe | 259 | 0.2% |
| Yemen | 21 | 0.0% |
| Zaire | 16 | 0.0% | View All 111 Rows |
Sex and Age in Corona
Sex and Age in Corona
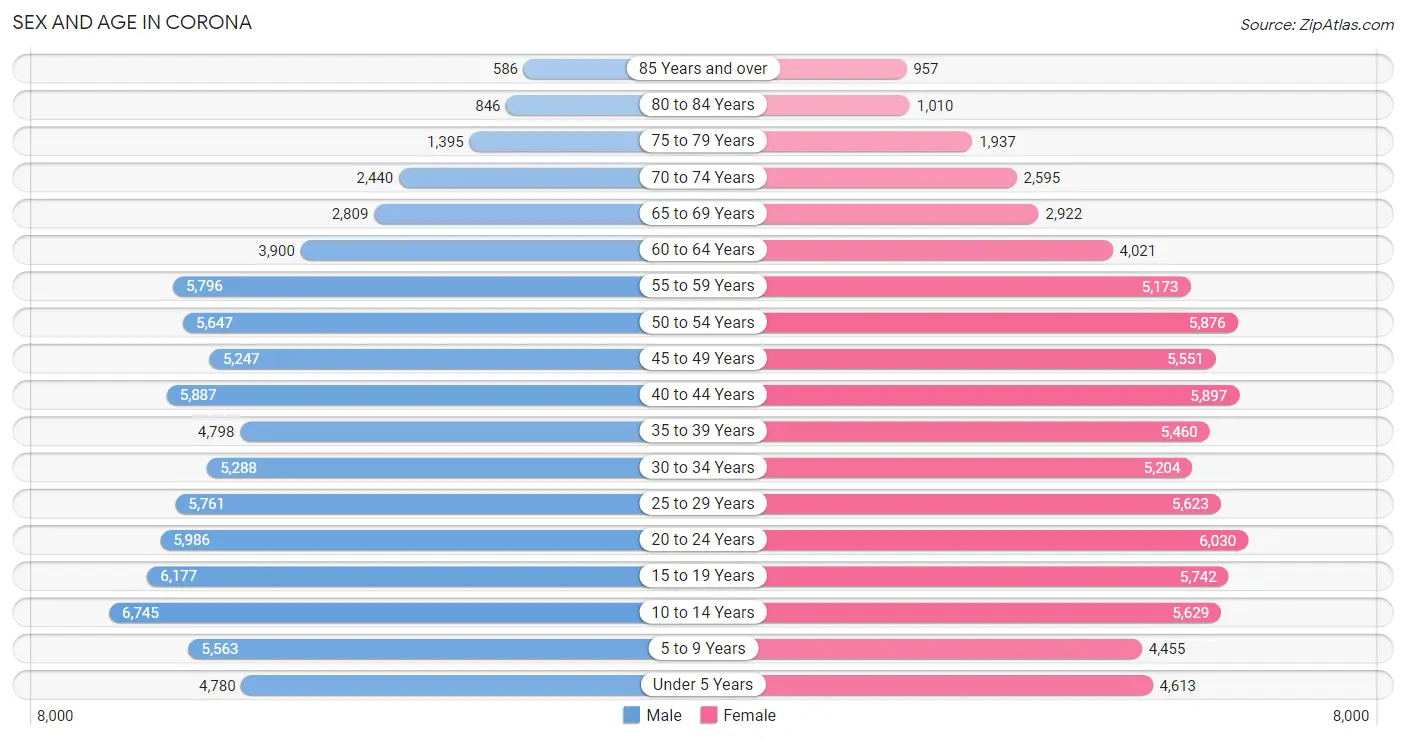
The most populous age groups in Corona are 10 to 14 Years (6,745 | 8.5%) for men and 20 to 24 Years (6,030 | 7.7%) for women.
| Age Bracket | Male | Female |
| Under 5 Years | 4,780 (6.0%) | 4,613 (5.9%) |
| 5 to 9 Years | 5,563 (7.0%) | 4,455 (5.7%) |
| 10 to 14 Years | 6,745 (8.5%) | 5,629 (7.1%) |
| 15 to 19 Years | 6,177 (7.8%) | 5,742 (7.3%) |
| 20 to 24 Years | 5,986 (7.5%) | 6,030 (7.7%) |
| 25 to 29 Years | 5,761 (7.2%) | 5,623 (7.1%) |
| 30 to 34 Years | 5,288 (6.6%) | 5,204 (6.6%) |
| 35 to 39 Years | 4,798 (6.0%) | 5,460 (6.9%) |
| 40 to 44 Years | 5,887 (7.4%) | 5,897 (7.5%) |
| 45 to 49 Years | 5,247 (6.6%) | 5,551 (7.0%) |
| 50 to 54 Years | 5,647 (7.1%) | 5,876 (7.5%) |
| 55 to 59 Years | 5,796 (7.3%) | 5,173 (6.6%) |
| 60 to 64 Years | 3,900 (4.9%) | 4,021 (5.1%) |
| 65 to 69 Years | 2,809 (3.5%) | 2,922 (3.7%) |
| 70 to 74 Years | 2,440 (3.1%) | 2,595 (3.3%) |
| 75 to 79 Years | 1,395 (1.8%) | 1,937 (2.5%) |
| 80 to 84 Years | 846 (1.1%) | 1,010 (1.3%) |
| 85 Years and over | 586 (0.7%) | 957 (1.2%) |
| Total | 79,651 (100.0%) | 78,695 (100.0%) |
Families and Households in Corona
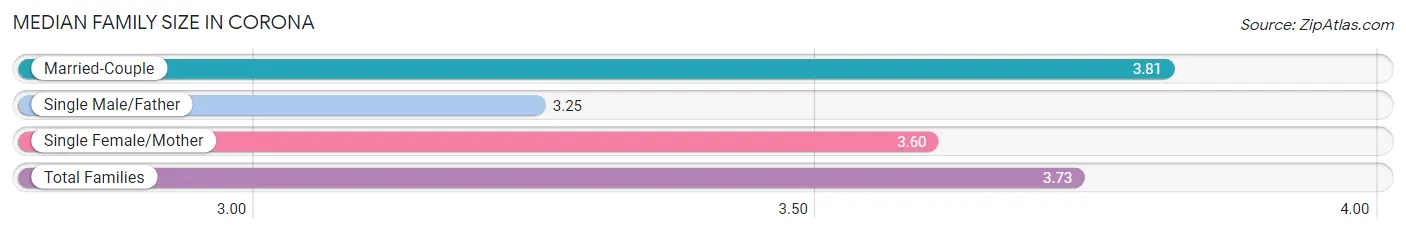
Median Family Size in Corona
The median family size in Corona is 3.73 persons per family, with married-couple families (28,659 | 75.2%) accounting for the largest median family size of 3.81 persons per family. On the other hand, single male/father families (2,722 | 7.1%) represent the smallest median family size with 3.25 persons per family.
| Family Type | # Families | Family Size |
| Married-Couple | 28,659 (75.2%) | 3.81 |
| Single Male/Father | 2,722 (7.1%) | 3.25 |
| Single Female/Mother | 6,718 (17.6%) | 3.60 |
| Total Families | 38,099 (100.0%) | 3.73 |
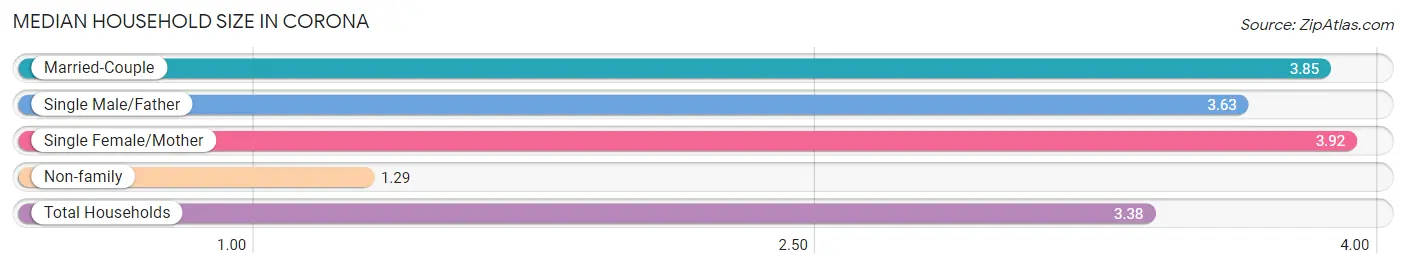
Median Household Size in Corona
The median household size in Corona is 3.38 persons per household, with single female/mother households (6,718 | 14.4%) accounting for the largest median household size of 3.92 persons per household. non-family households (8,425 | 18.1%) represent the smallest median household size with 1.29 persons per household.
| Household Type | # Households | Household Size |
| Married-Couple | 28,659 (61.6%) | 3.85 |
| Single Male/Father | 2,722 (5.9%) | 3.63 |
| Single Female/Mother | 6,718 (14.4%) | 3.92 |
| Non-family | 8,425 (18.1%) | 1.29 |
| Total Households | 46,524 (100.0%) | 3.38 |
Household Size by Marriage Status in Corona
Out of a total of 46,524 households in Corona, 38,099 (81.9%) are family households, while 8,425 (18.1%) are nonfamily households. The most numerous type of family households are 2-person households, comprising 10,899, and the most common type of nonfamily households are 1-person households, comprising 6,661.
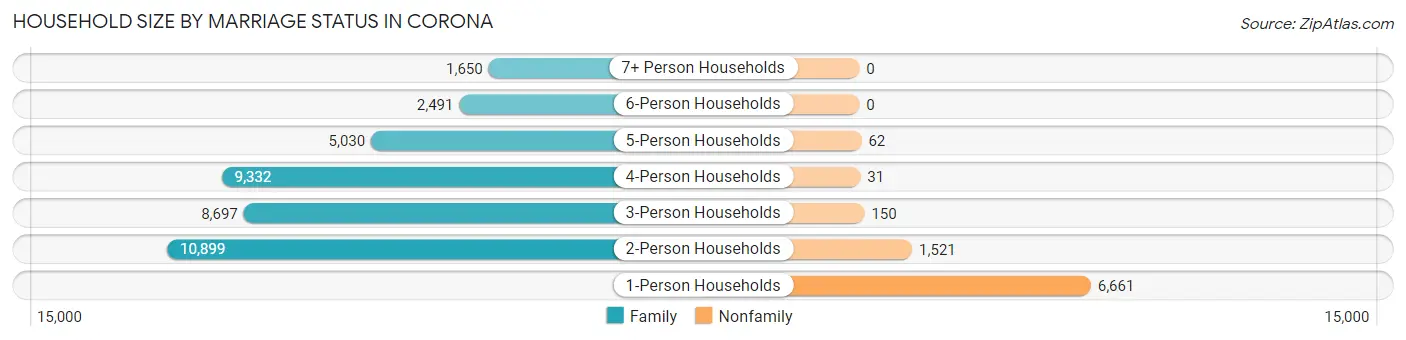
| Household Size | Family Households | Nonfamily Households |
| 1-Person Households | - | 6,661 (14.3%) |
| 2-Person Households | 10,899 (23.4%) | 1,521 (3.3%) |
| 3-Person Households | 8,697 (18.7%) | 150 (0.3%) |
| 4-Person Households | 9,332 (20.1%) | 31 (0.1%) |
| 5-Person Households | 5,030 (10.8%) | 62 (0.1%) |
| 6-Person Households | 2,491 (5.3%) | 0 (0.0%) |
| 7+ Person Households | 1,650 (3.5%) | 0 (0.0%) |
| Total | 38,099 (81.9%) | 8,425 (18.1%) |
Female Fertility in Corona
Fertility by Age in Corona
Average fertility rate in Corona is 44.0 births per 1,000 women. Women in the age bracket of 20 to 34 years have the highest fertility rate with 64.0 births per 1,000 women. Women in the age bracket of 20 to 34 years acount for 60.8% of all women with births.
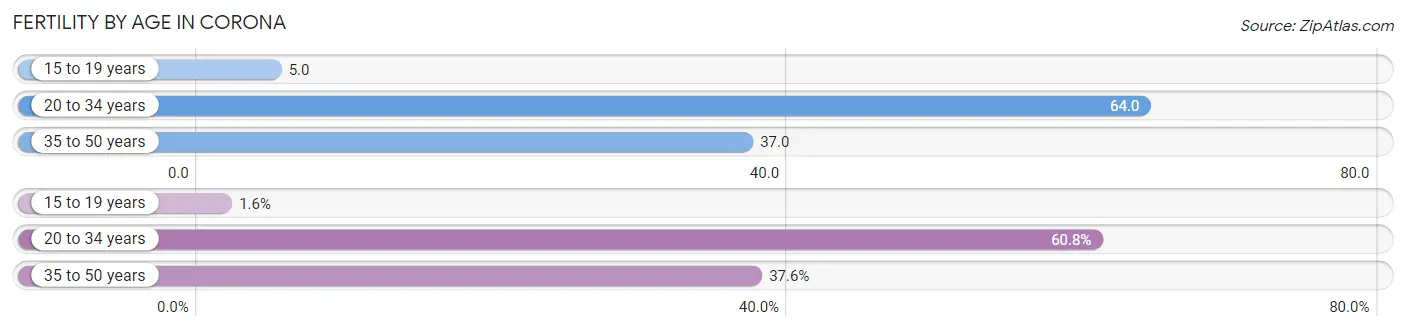
| Age Bracket | Women with Births | Births / 1,000 Women |
| 15 to 19 years | 29 (1.6%) | 5.0 |
| 20 to 34 years | 1,074 (60.8%) | 64.0 |
| 35 to 50 years | 665 (37.6%) | 37.0 |
| Total | 1,768 (100.0%) | 44.0 |
Fertility by Age by Marriage Status in Corona
65.2% of women with births (1,768) in Corona are married. The highest percentage of unmarried women with births falls into 15 to 19 years age bracket with 100.0% of them unmarried at the time of birth, while the lowest percentage of unmarried women with births belong to 35 to 50 years age bracket with 25.9% of them unmarried.
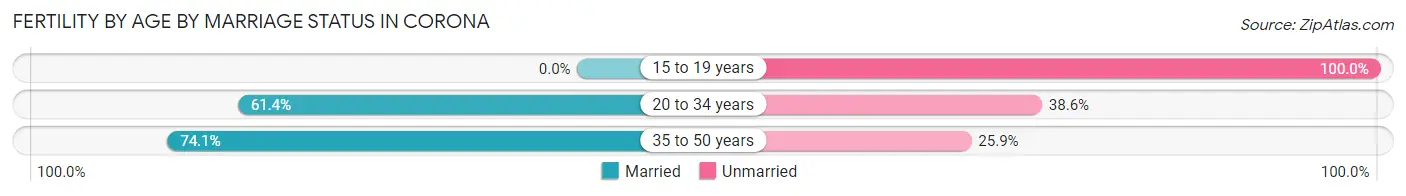
| Age Bracket | Married | Unmarried |
| 15 to 19 years | 0 (0.0%) | 29 (100.0%) |
| 20 to 34 years | 659 (61.4%) | 415 (38.6%) |
| 35 to 50 years | 493 (74.1%) | 172 (25.9%) |
| Total | 1,153 (65.2%) | 615 (34.8%) |
Fertility by Education in Corona
Average fertility rate in Corona is 44.0 births per 1,000 women. Women with the education attainment of graduate degree have the highest fertility rate of 73.0 births per 1,000 women, while women with the education attainment of less than high school have the lowest fertility at 20.0 births per 1,000 women. Women with the education attainment of college or associate's degree represent 32.2% of all women with births.
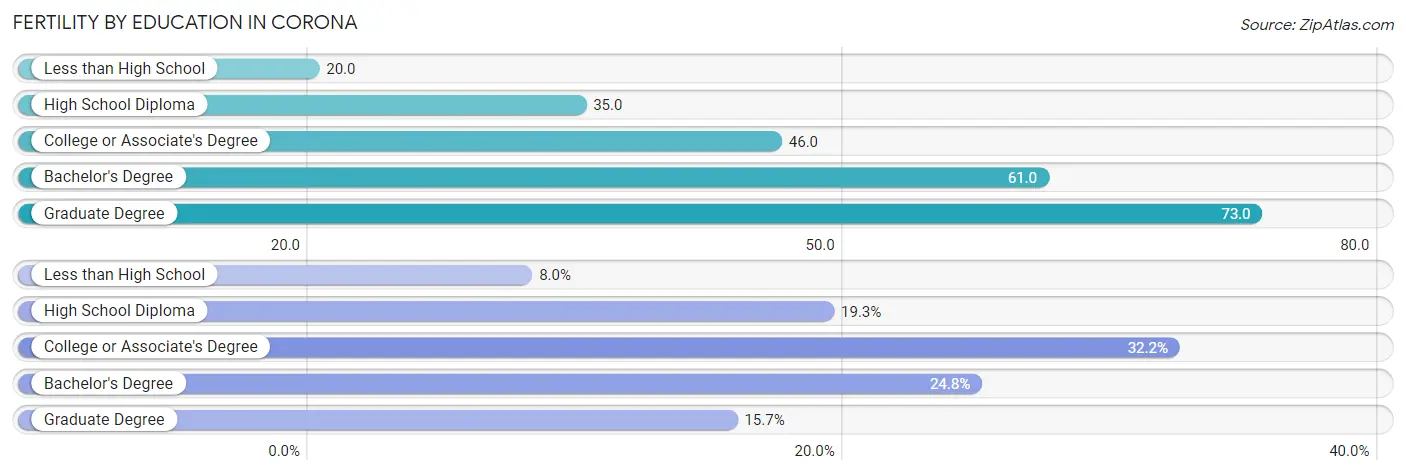
| Educational Attainment | Women with Births | Births / 1,000 Women |
| Less than High School | 141 (8.0%) | 20.0 |
| High School Diploma | 341 (19.3%) | 35.0 |
| College or Associate's Degree | 570 (32.2%) | 46.0 |
| Bachelor's Degree | 439 (24.8%) | 61.0 |
| Graduate Degree | 277 (15.7%) | 73.0 |
| Total | 1,768 (100.0%) | 44.0 |
Fertility by Education by Marriage Status in Corona
34.8% of women with births in Corona are unmarried. Women with the educational attainment of graduate degree are most likely to be married with 89.5% of them married at childbirth, while women with the educational attainment of college or associate's degree are least likely to be married with 55.3% of them unmarried at childbirth.
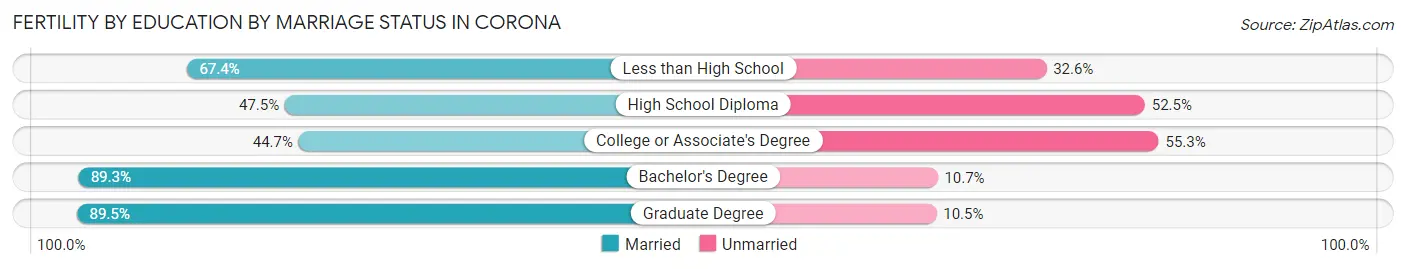
| Educational Attainment | Married | Unmarried |
| Less than High School | 95 (67.4%) | 46 (32.6%) |
| High School Diploma | 162 (47.5%) | 179 (52.5%) |
| College or Associate's Degree | 255 (44.7%) | 315 (55.3%) |
| Bachelor's Degree | 392 (89.3%) | 47 (10.7%) |
| Graduate Degree | 248 (89.5%) | 29 (10.5%) |
| Total | 1,153 (65.2%) | 615 (34.8%) |
Employment Characteristics in Corona
Employment by Class of Employer in Corona
Among the 76,488 employed individuals in Corona, private company employees (52,585 | 68.8%), local government employees (7,857 | 10.3%), and self-employed (not incorporated) (4,762 | 6.2%) make up the most common classes of employment.
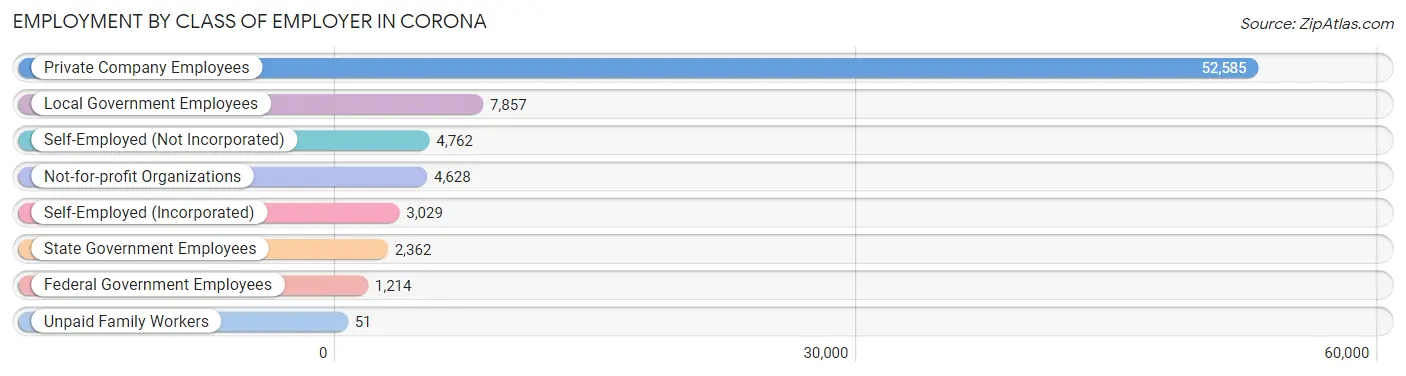
| Employer Class | # Employees | % Employees |
| Private Company Employees | 52,585 | 68.8% |
| Self-Employed (Incorporated) | 3,029 | 4.0% |
| Self-Employed (Not Incorporated) | 4,762 | 6.2% |
| Not-for-profit Organizations | 4,628 | 6.0% |
| Local Government Employees | 7,857 | 10.3% |
| State Government Employees | 2,362 | 3.1% |
| Federal Government Employees | 1,214 | 1.6% |
| Unpaid Family Workers | 51 | 0.1% |
| Total | 76,488 | 100.0% |
Employment Status by Age in Corona
According to the labor force statistics for Corona, out of the total population over 16 years of age (123,853), 66.4% or 82,238 individuals are in the labor force, with 4.6% or 3,783 of them unemployed. The age group with the highest labor force participation rate is 30 to 34 years, with 86.7% or 9,097 individuals in the labor force. Within the labor force, the 16 to 19 years age range has the highest percentage of unemployed individuals, with 15.3% or 417 of them being unemployed.
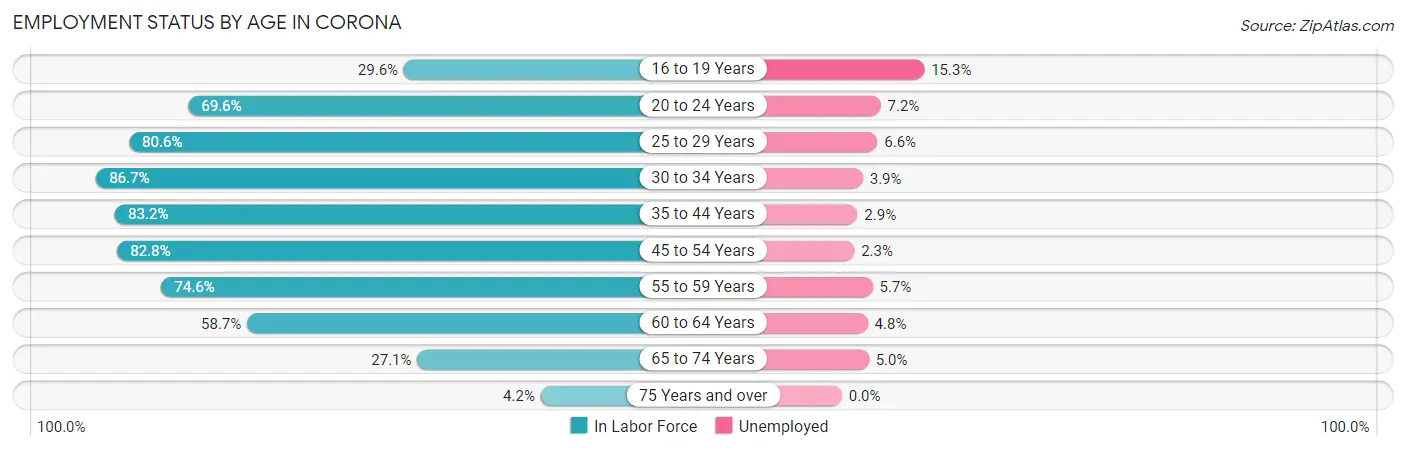
| Age Bracket | In Labor Force | Unemployed |
| 16 to 19 Years | 2,726 (29.6%) | 417 (15.3%) |
| 20 to 24 Years | 8,363 (69.6%) | 602 (7.2%) |
| 25 to 29 Years | 9,176 (80.6%) | 606 (6.6%) |
| 30 to 34 Years | 9,097 (86.7%) | 355 (3.9%) |
| 35 to 44 Years | 18,339 (83.2%) | 532 (2.9%) |
| 45 to 54 Years | 18,482 (82.8%) | 425 (2.3%) |
| 55 to 59 Years | 8,183 (74.6%) | 466 (5.7%) |
| 60 to 64 Years | 4,650 (58.7%) | 223 (4.8%) |
| 65 to 74 Years | 2,918 (27.1%) | 146 (5.0%) |
| 75 Years and over | 283 (4.2%) | 0 (0.0%) |
| Total | 82,238 (66.4%) | 3,783 (4.6%) |
Employment Status by Educational Attainment in Corona
According to labor force statistics for Corona, 79.8% of individuals (67,933) out of the total population between 25 and 64 years of age (85,129) are in the labor force, with 3.8% or 2,581 of them being unemployed. The group with the highest labor force participation rate are those with the educational attainment of bachelor's degree or higher, with 87.5% or 23,191 individuals in the labor force. Within the labor force, individuals with less than high school education have the highest percentage of unemployment, with 5.6% or 391 of them being unemployed.
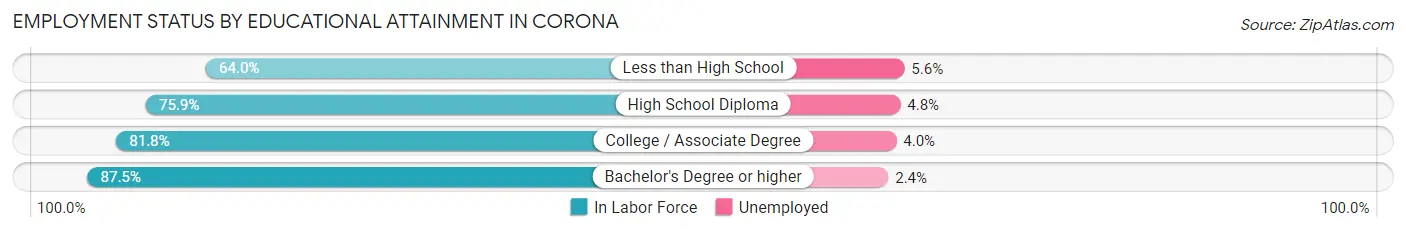
| Educational Attainment | In Labor Force | Unemployed |
| Less than High School | 6,984 (64.0%) | 611 (5.6%) |
| High School Diploma | 16,097 (75.9%) | 1,018 (4.8%) |
| College / Associate Degree | 21,681 (81.8%) | 1,060 (4.0%) |
| Bachelor's Degree or higher | 23,191 (87.5%) | 636 (2.4%) |
| Total | 67,933 (79.8%) | 3,235 (3.8%) |
Employment Occupations by Sex in Corona
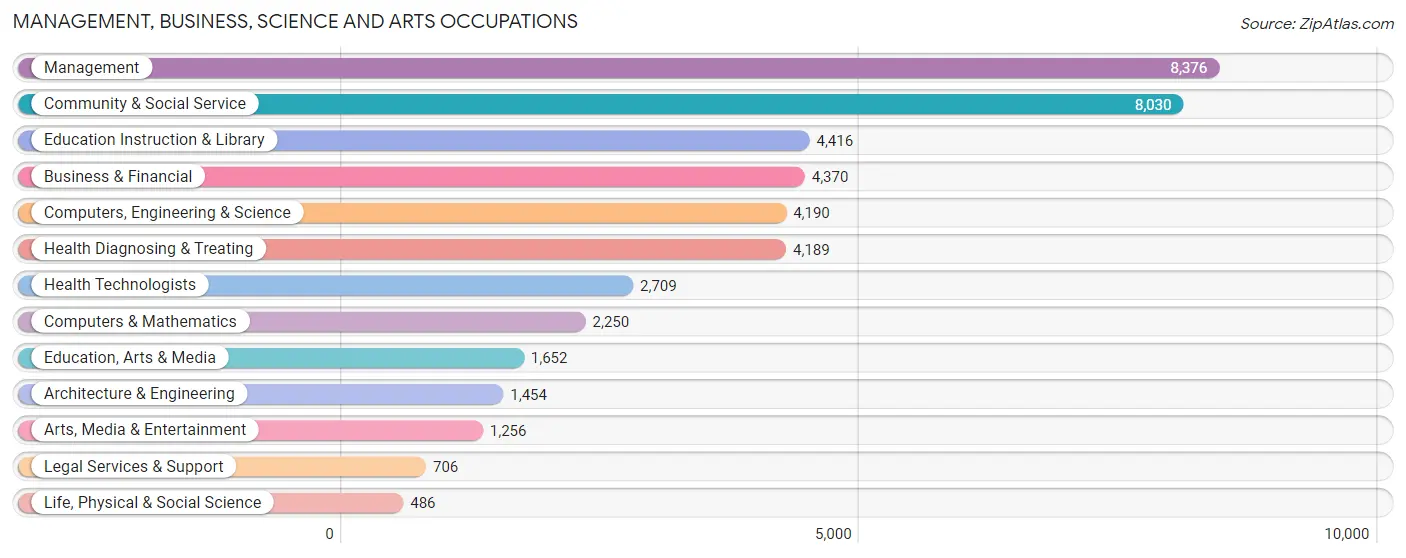
Management, Business, Science and Arts Occupations
The most common Management, Business, Science and Arts occupations in Corona are Management (8,376 | 10.7%), Community & Social Service (8,030 | 10.3%), Education Instruction & Library (4,416 | 5.7%), Business & Financial (4,370 | 5.6%), and Computers, Engineering & Science (4,190 | 5.4%).
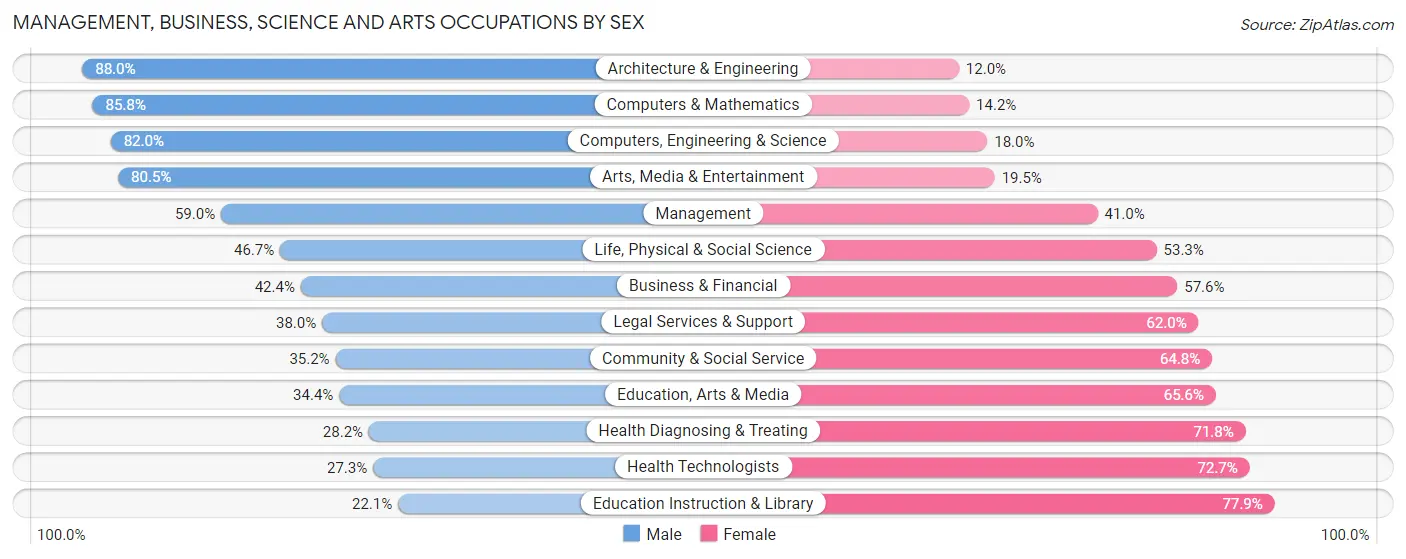
Management, Business, Science and Arts Occupations by Sex
Within the Management, Business, Science and Arts occupations in Corona, the most male-oriented occupations are Architecture & Engineering (88.0%), Computers & Mathematics (85.8%), and Computers, Engineering & Science (82.0%), while the most female-oriented occupations are Education Instruction & Library (77.9%), Health Technologists (72.7%), and Health Diagnosing & Treating (71.8%).
| Occupation | Male | Female |
| Management | 4,944 (59.0%) | 3,432 (41.0%) |
| Business & Financial | 1,853 (42.4%) | 2,517 (57.6%) |
| Computers, Engineering & Science | 3,437 (82.0%) | 753 (18.0%) |
| Computers & Mathematics | 1,931 (85.8%) | 319 (14.2%) |
| Architecture & Engineering | 1,279 (88.0%) | 175 (12.0%) |
| Life, Physical & Social Science | 227 (46.7%) | 259 (53.3%) |
| Community & Social Service | 2,823 (35.2%) | 5,207 (64.8%) |
| Education, Arts & Media | 568 (34.4%) | 1,084 (65.6%) |
| Legal Services & Support | 268 (38.0%) | 438 (62.0%) |
| Education Instruction & Library | 976 (22.1%) | 3,440 (77.9%) |
| Arts, Media & Entertainment | 1,011 (80.5%) | 245 (19.5%) |
| Health Diagnosing & Treating | 1,180 (28.2%) | 3,009 (71.8%) |
| Health Technologists | 740 (27.3%) | 1,969 (72.7%) |
| Total (Category) | 14,237 (48.8%) | 14,918 (51.2%) |
| Total (Overall) | 42,699 (54.6%) | 35,513 (45.4%) |
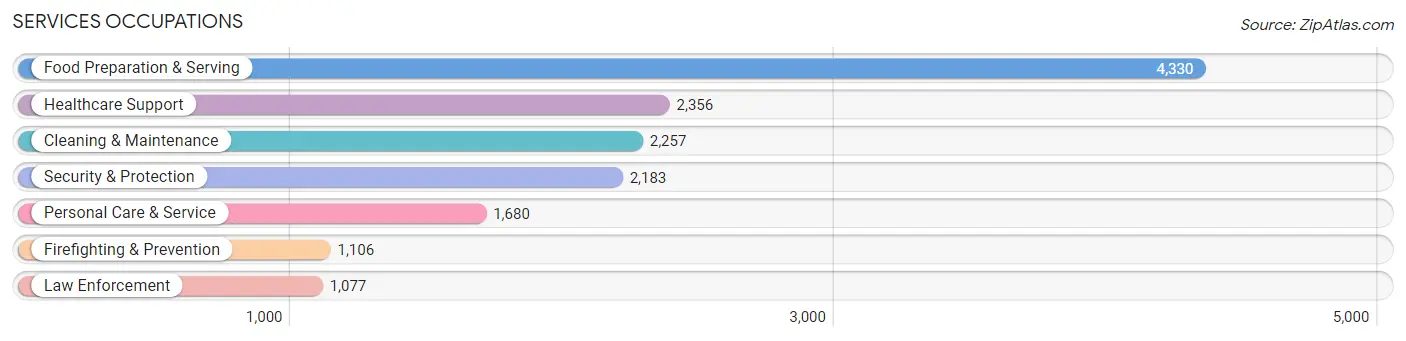
Services Occupations
The most common Services occupations in Corona are Food Preparation & Serving (4,330 | 5.5%), Healthcare Support (2,356 | 3.0%), Cleaning & Maintenance (2,257 | 2.9%), Security & Protection (2,183 | 2.8%), and Personal Care & Service (1,680 | 2.1%).
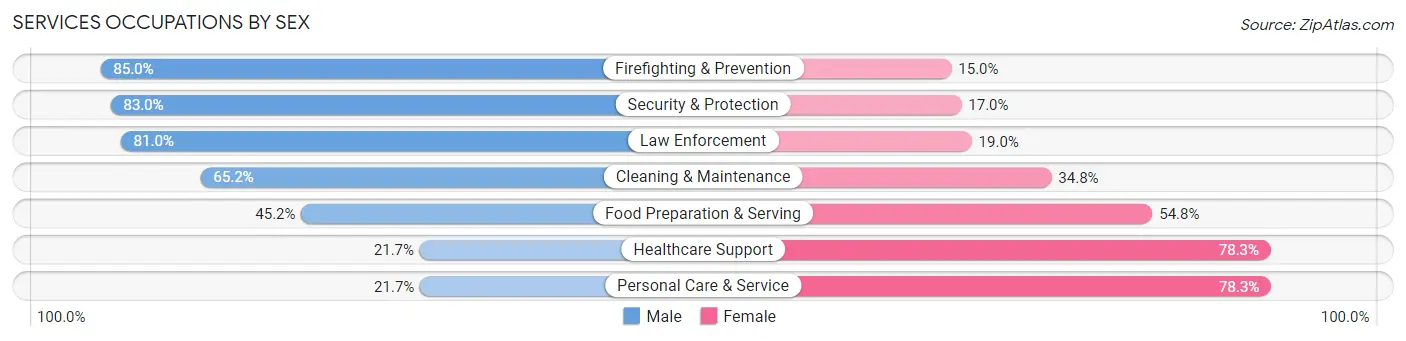
Services Occupations by Sex
Within the Services occupations in Corona, the most male-oriented occupations are Firefighting & Prevention (85.0%), Security & Protection (83.0%), and Law Enforcement (81.0%), while the most female-oriented occupations are Personal Care & Service (78.3%), Healthcare Support (78.3%), and Food Preparation & Serving (54.8%).
| Occupation | Male | Female |
| Healthcare Support | 512 (21.7%) | 1,844 (78.3%) |
| Security & Protection | 1,812 (83.0%) | 371 (17.0%) |
| Firefighting & Prevention | 940 (85.0%) | 166 (15.0%) |
| Law Enforcement | 872 (81.0%) | 205 (19.0%) |
| Food Preparation & Serving | 1,957 (45.2%) | 2,373 (54.8%) |
| Cleaning & Maintenance | 1,471 (65.2%) | 786 (34.8%) |
| Personal Care & Service | 364 (21.7%) | 1,316 (78.3%) |
| Total (Category) | 6,116 (47.8%) | 6,690 (52.2%) |
| Total (Overall) | 42,699 (54.6%) | 35,513 (45.4%) |
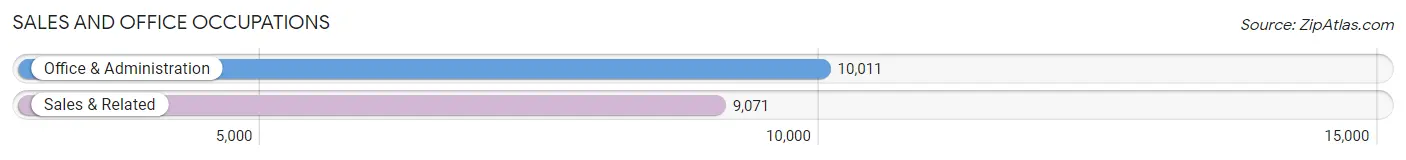
Sales and Office Occupations
The most common Sales and Office occupations in Corona are Office & Administration (10,011 | 12.8%), and Sales & Related (9,071 | 11.6%).
Sales and Office Occupations by Sex
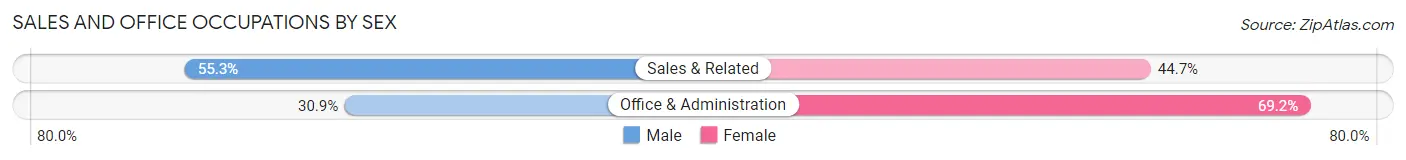
| Occupation | Male | Female |
| Sales & Related | 5,019 (55.3%) | 4,052 (44.7%) |
| Office & Administration | 3,088 (30.8%) | 6,923 (69.2%) |
| Total (Category) | 8,107 (42.5%) | 10,975 (57.5%) |
| Total (Overall) | 42,699 (54.6%) | 35,513 (45.4%) |
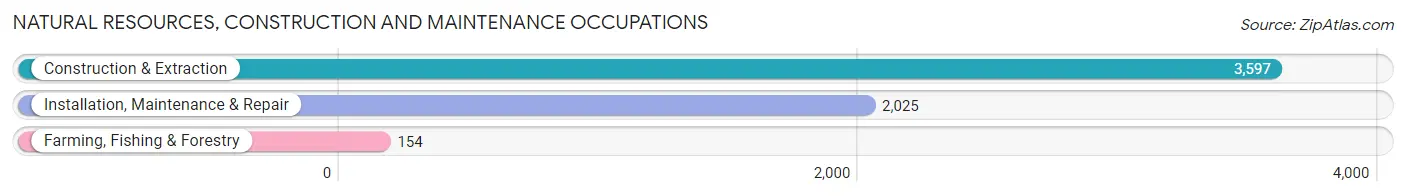
Natural Resources, Construction and Maintenance Occupations
The most common Natural Resources, Construction and Maintenance occupations in Corona are Construction & Extraction (3,597 | 4.6%), Installation, Maintenance & Repair (2,025 | 2.6%), and Farming, Fishing & Forestry (154 | 0.2%).
Natural Resources, Construction and Maintenance Occupations by Sex
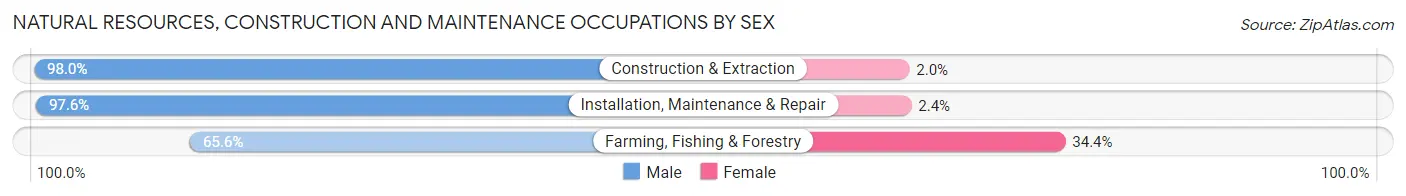
| Occupation | Male | Female |
| Farming, Fishing & Forestry | 101 (65.6%) | 53 (34.4%) |
| Construction & Extraction | 3,526 (98.0%) | 71 (2.0%) |
| Installation, Maintenance & Repair | 1,977 (97.6%) | 48 (2.4%) |
| Total (Category) | 5,604 (97.0%) | 172 (3.0%) |
| Total (Overall) | 42,699 (54.6%) | 35,513 (45.4%) |
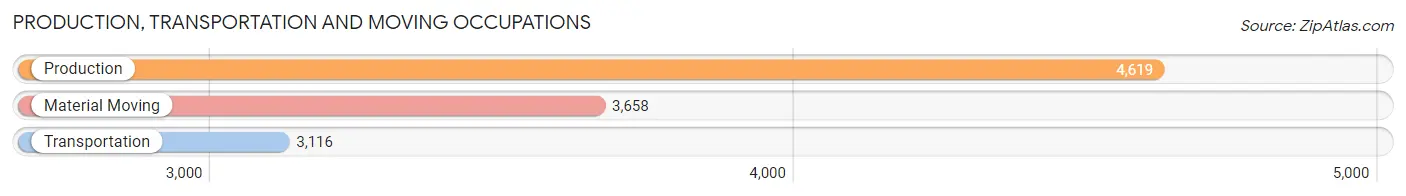
Production, Transportation and Moving Occupations
The most common Production, Transportation and Moving occupations in Corona are Production (4,619 | 5.9%), Material Moving (3,658 | 4.7%), and Transportation (3,116 | 4.0%).
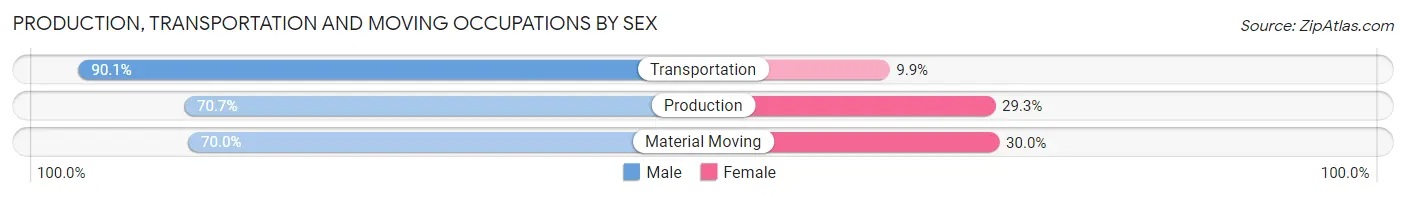
Production, Transportation and Moving Occupations by Sex
| Occupation | Male | Female |
| Production | 3,267 (70.7%) | 1,352 (29.3%) |
| Transportation | 2,808 (90.1%) | 308 (9.9%) |
| Material Moving | 2,560 (70.0%) | 1,098 (30.0%) |
| Total (Category) | 8,635 (75.8%) | 2,758 (24.2%) |
| Total (Overall) | 42,699 (54.6%) | 35,513 (45.4%) |
Employment Industries by Sex in Corona
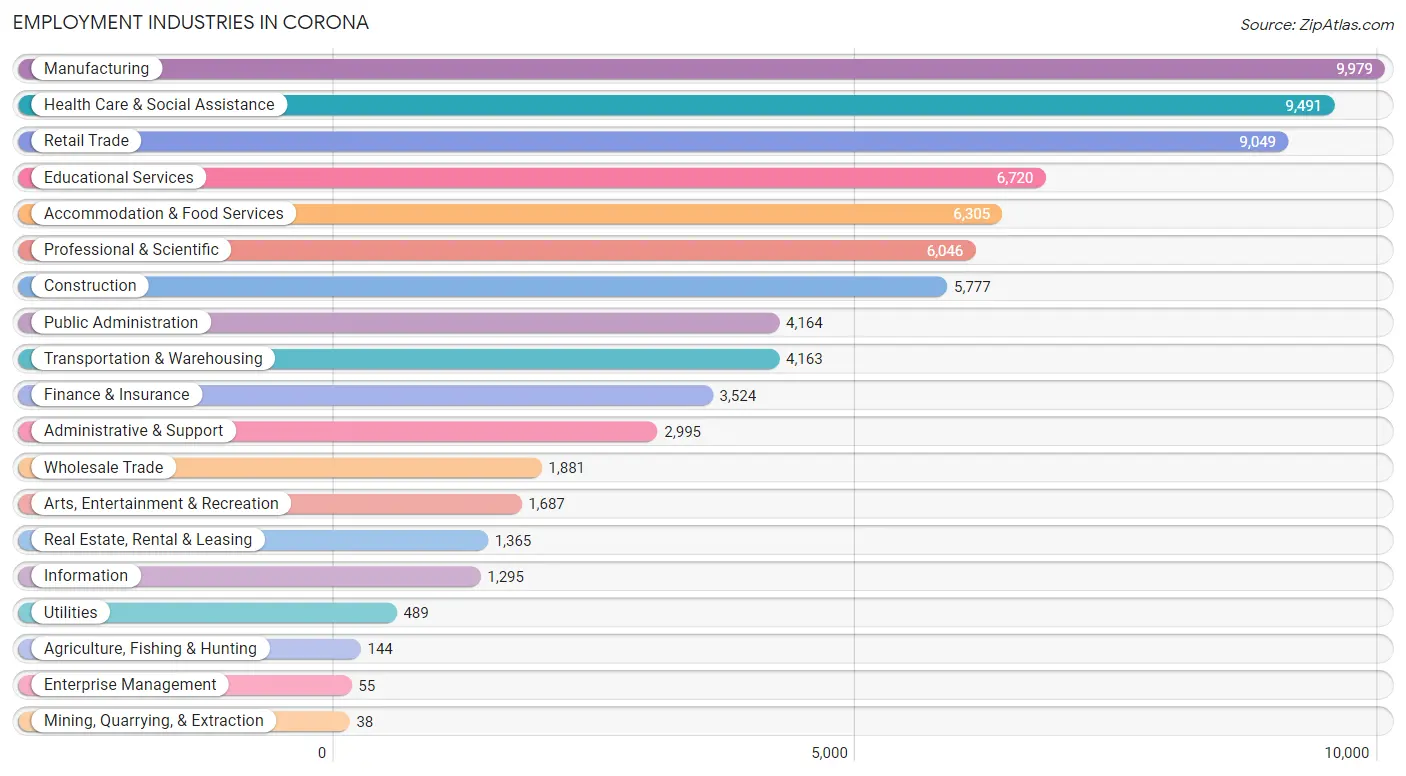
Employment Industries in Corona
The major employment industries in Corona include Manufacturing (9,979 | 12.8%), Health Care & Social Assistance (9,491 | 12.1%), Retail Trade (9,049 | 11.6%), Educational Services (6,720 | 8.6%), and Accommodation & Food Services (6,305 | 8.1%).
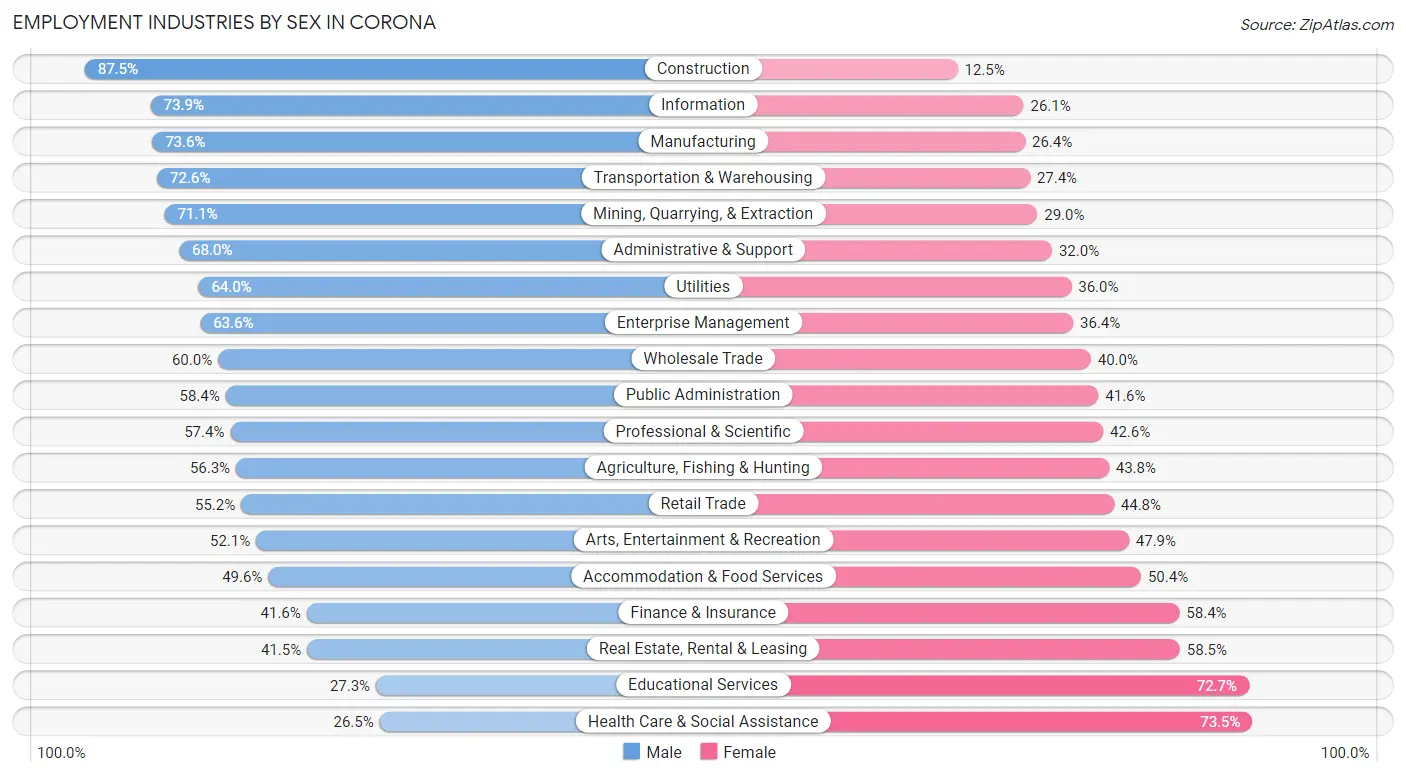
Employment Industries by Sex in Corona
The Corona industries that see more men than women are Construction (87.5%), Information (73.9%), and Manufacturing (73.6%), whereas the industries that tend to have a higher number of women are Health Care & Social Assistance (73.5%), Educational Services (72.7%), and Real Estate, Rental & Leasing (58.5%).
| Industry | Male | Female |
| Agriculture, Fishing & Hunting | 81 (56.2%) | 63 (43.8%) |
| Mining, Quarrying, & Extraction | 27 (71.1%) | 11 (28.9%) |
| Construction | 5,057 (87.5%) | 720 (12.5%) |
| Manufacturing | 7,343 (73.6%) | 2,636 (26.4%) |
| Wholesale Trade | 1,128 (60.0%) | 753 (40.0%) |
| Retail Trade | 4,995 (55.2%) | 4,054 (44.8%) |
| Transportation & Warehousing | 3,021 (72.6%) | 1,142 (27.4%) |
| Utilities | 313 (64.0%) | 176 (36.0%) |
| Information | 957 (73.9%) | 338 (26.1%) |
| Finance & Insurance | 1,467 (41.6%) | 2,057 (58.4%) |
| Real Estate, Rental & Leasing | 567 (41.5%) | 798 (58.5%) |
| Professional & Scientific | 3,473 (57.4%) | 2,573 (42.6%) |
| Enterprise Management | 35 (63.6%) | 20 (36.4%) |
| Administrative & Support | 2,037 (68.0%) | 958 (32.0%) |
| Educational Services | 1,833 (27.3%) | 4,887 (72.7%) |
| Health Care & Social Assistance | 2,519 (26.5%) | 6,972 (73.5%) |
| Arts, Entertainment & Recreation | 879 (52.1%) | 808 (47.9%) |
| Accommodation & Food Services | 3,126 (49.6%) | 3,179 (50.4%) |
| Public Administration | 2,432 (58.4%) | 1,732 (41.6%) |
| Total | 42,699 (54.6%) | 35,513 (45.4%) |
Education in Corona
School Enrollment in Corona
The most common levels of schooling among the 43,816 students in Corona are college / undergraduate (10,909 | 24.9%), high school (9,867 | 22.5%), and middle school (9,642 | 22.0%).
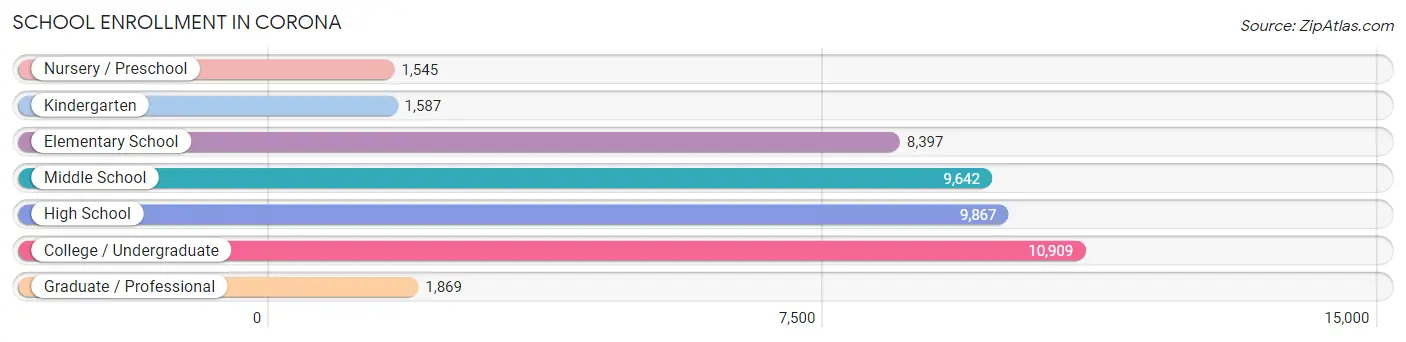
| School Level | # Students | % Students |
| Nursery / Preschool | 1,545 | 3.5% |
| Kindergarten | 1,587 | 3.6% |
| Elementary School | 8,397 | 19.2% |
| Middle School | 9,642 | 22.0% |
| High School | 9,867 | 22.5% |
| College / Undergraduate | 10,909 | 24.9% |
| Graduate / Professional | 1,869 | 4.3% |
| Total | 43,816 | 100.0% |
School Enrollment by Age by Funding Source in Corona
Out of a total of 43,816 students who are enrolled in schools in Corona, 5,565 (12.7%) attend a private institution, while the remaining 38,251 (87.3%) are enrolled in public schools. The age group of 3 to 4 year olds has the highest likelihood of being enrolled in private schools, with 424 (34.2% in the age bracket) enrolled. Conversely, the age group of 15 to 17 year olds has the lowest likelihood of being enrolled in a private school, with 6,564 (93.8% in the age bracket) attending a public institution.
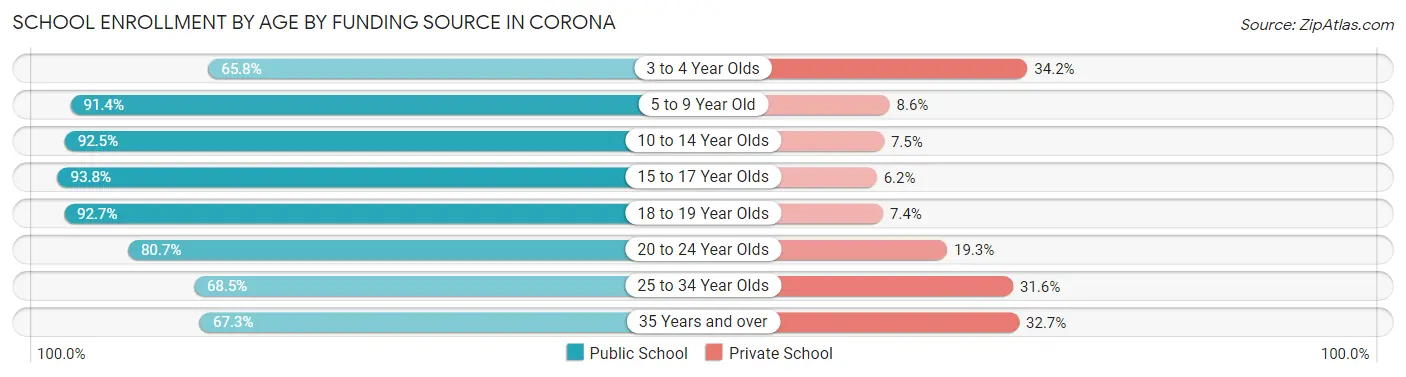
| Age Bracket | Public School | Private School |
| 3 to 4 Year Olds | 815 (65.8%) | 424 (34.2%) |
| 5 to 9 Year Old | 8,621 (91.4%) | 807 (8.6%) |
| 10 to 14 Year Olds | 11,209 (92.5%) | 909 (7.5%) |
| 15 to 17 Year Olds | 6,564 (93.8%) | 431 (6.2%) |
| 18 to 19 Year Olds | 3,115 (92.6%) | 247 (7.3%) |
| 20 to 24 Year Olds | 4,233 (80.7%) | 1,010 (19.3%) |
| 25 to 34 Year Olds | 1,981 (68.4%) | 913 (31.6%) |
| 35 Years and over | 1,708 (67.3%) | 829 (32.7%) |
| Total | 38,251 (87.3%) | 5,565 (12.7%) |
Educational Attainment by Field of Study in Corona
Business (7,562 | 23.0%), science & technology (3,306 | 10.1%), engineering (2,902 | 8.8%), arts & humanities (2,635 | 8.0%), and education (2,228 | 6.8%) are the most common fields of study among 32,843 individuals in Corona who have obtained a bachelor's degree or higher.
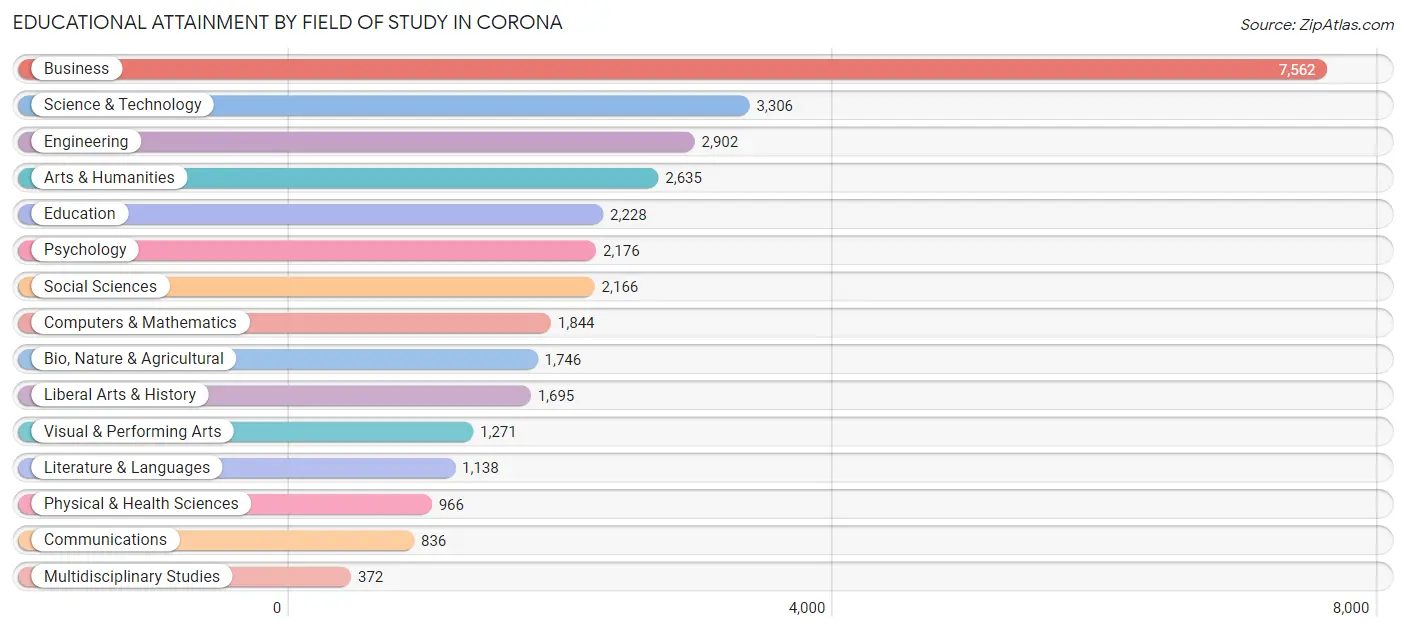
| Field of Study | # Graduates | % Graduates |
| Computers & Mathematics | 1,844 | 5.6% |
| Bio, Nature & Agricultural | 1,746 | 5.3% |
| Physical & Health Sciences | 966 | 2.9% |
| Psychology | 2,176 | 6.6% |
| Social Sciences | 2,166 | 6.6% |
| Engineering | 2,902 | 8.8% |
| Multidisciplinary Studies | 372 | 1.1% |
| Science & Technology | 3,306 | 10.1% |
| Business | 7,562 | 23.0% |
| Education | 2,228 | 6.8% |
| Literature & Languages | 1,138 | 3.5% |
| Liberal Arts & History | 1,695 | 5.2% |
| Visual & Performing Arts | 1,271 | 3.9% |
| Communications | 836 | 2.5% |
| Arts & Humanities | 2,635 | 8.0% |
| Total | 32,843 | 100.0% |
Transportation & Commute in Corona
Vehicle Availability by Sex in Corona
The most prevalent vehicle ownership categories in Corona are males with 2 vehicles (15,034, accounting for 35.8%) and females with 2 vehicles (11,555, making up 43.7%).
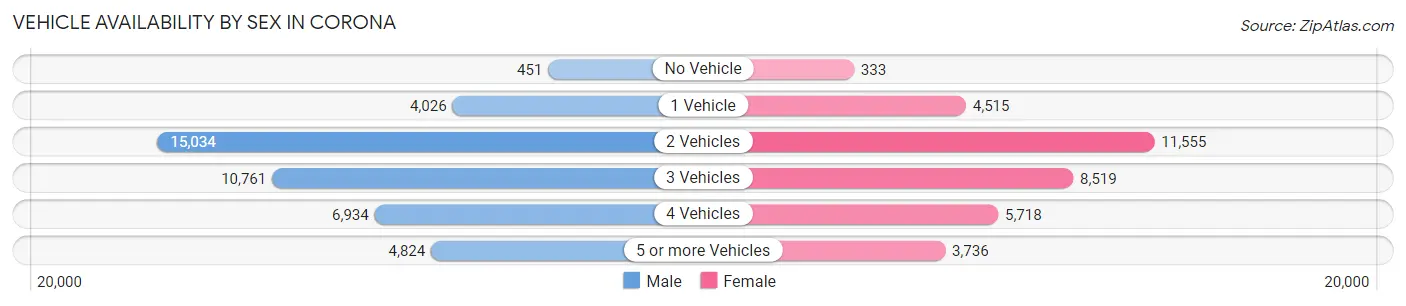
| Vehicles Available | Male | Female |
| No Vehicle | 451 (1.1%) | 333 (1.0%) |
| 1 Vehicle | 4,026 (9.6%) | 4,515 (13.1%) |
| 2 Vehicles | 15,034 (35.8%) | 11,555 (33.6%) |
| 3 Vehicles | 10,761 (25.6%) | 8,519 (24.8%) |
| 4 Vehicles | 6,934 (16.5%) | 5,718 (16.6%) |
| 5 or more Vehicles | 4,824 (11.5%) | 3,736 (10.9%) |
| Total | 42,030 (100.0%) | 34,376 (100.0%) |
Commute Time in Corona
The most frequently occuring commute durations in Corona are 60 to 89 minutes (10,982 commuters, 15.8%), 45 to 59 minutes (9,638 commuters, 13.9%), and 10 to 14 minutes (8,646 commuters, 12.4%).
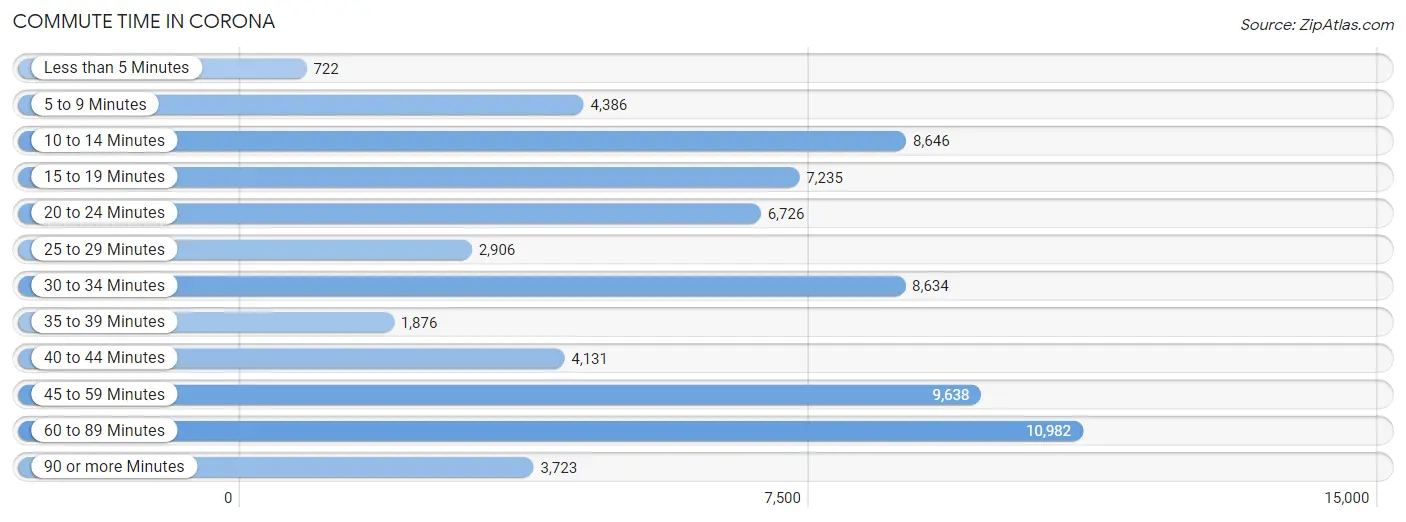
| Commute Time | # Commuters | % Commuters |
| Less than 5 Minutes | 722 | 1.0% |
| 5 to 9 Minutes | 4,386 | 6.3% |
| 10 to 14 Minutes | 8,646 | 12.4% |
| 15 to 19 Minutes | 7,235 | 10.4% |
| 20 to 24 Minutes | 6,726 | 9.7% |
| 25 to 29 Minutes | 2,906 | 4.2% |
| 30 to 34 Minutes | 8,634 | 12.4% |
| 35 to 39 Minutes | 1,876 | 2.7% |
| 40 to 44 Minutes | 4,131 | 5.9% |
| 45 to 59 Minutes | 9,638 | 13.9% |
| 60 to 89 Minutes | 10,982 | 15.8% |
| 90 or more Minutes | 3,723 | 5.3% |
Commute Time by Sex in Corona
The most common commute times in Corona are 60 to 89 minutes (7,118 commuters, 18.4%) for males and 10 to 14 minutes (4,735 commuters, 15.3%) for females.
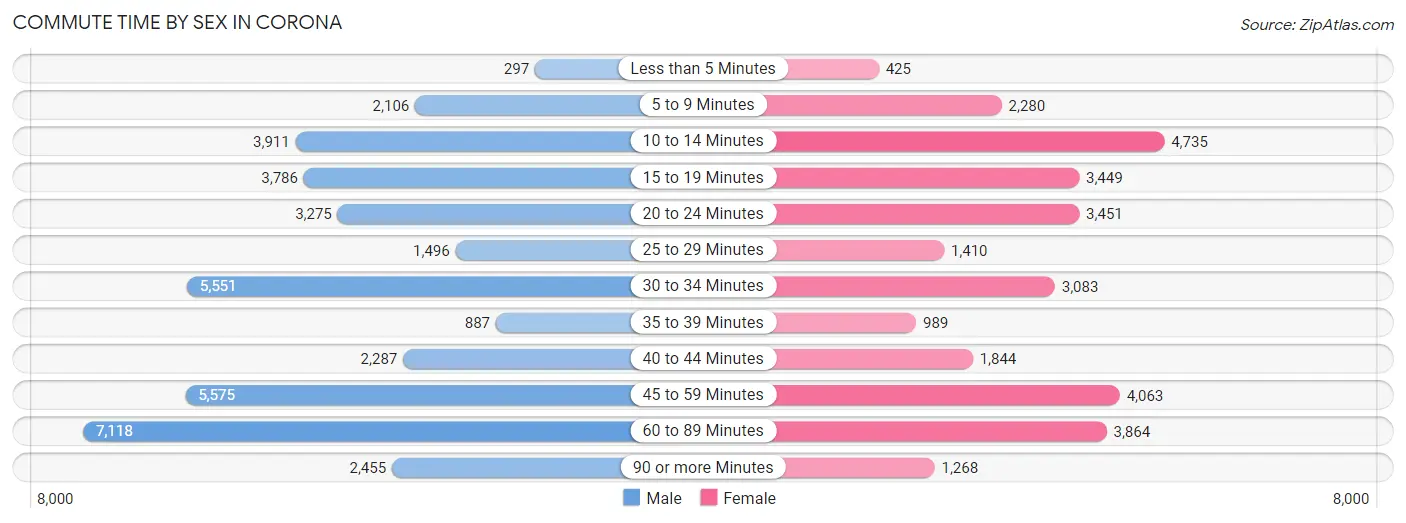
| Commute Time | Male | Female |
| Less than 5 Minutes | 297 (0.8%) | 425 (1.4%) |
| 5 to 9 Minutes | 2,106 (5.4%) | 2,280 (7.4%) |
| 10 to 14 Minutes | 3,911 (10.1%) | 4,735 (15.3%) |
| 15 to 19 Minutes | 3,786 (9.8%) | 3,449 (11.2%) |
| 20 to 24 Minutes | 3,275 (8.5%) | 3,451 (11.2%) |
| 25 to 29 Minutes | 1,496 (3.9%) | 1,410 (4.6%) |
| 30 to 34 Minutes | 5,551 (14.3%) | 3,083 (10.0%) |
| 35 to 39 Minutes | 887 (2.3%) | 989 (3.2%) |
| 40 to 44 Minutes | 2,287 (5.9%) | 1,844 (6.0%) |
| 45 to 59 Minutes | 5,575 (14.4%) | 4,063 (13.2%) |
| 60 to 89 Minutes | 7,118 (18.4%) | 3,864 (12.5%) |
| 90 or more Minutes | 2,455 (6.3%) | 1,268 (4.1%) |
Time of Departure to Work by Sex in Corona
The most frequent times of departure to work in Corona are 7:00 AM to 7:29 AM (5,395, 13.9%) for males and 7:00 AM to 7:29 AM (5,449, 17.7%) for females.
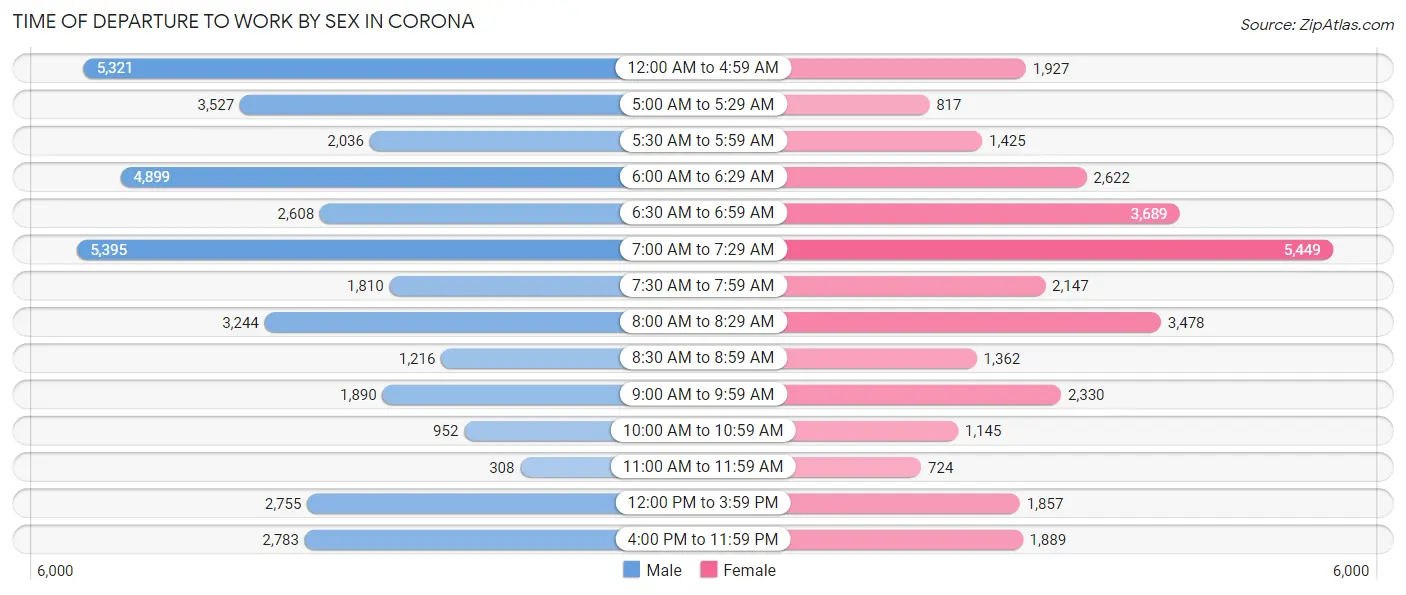
| Time of Departure | Male | Female |
| 12:00 AM to 4:59 AM | 5,321 (13.7%) | 1,927 (6.2%) |
| 5:00 AM to 5:29 AM | 3,527 (9.1%) | 817 (2.6%) |
| 5:30 AM to 5:59 AM | 2,036 (5.3%) | 1,425 (4.6%) |
| 6:00 AM to 6:29 AM | 4,899 (12.6%) | 2,622 (8.5%) |
| 6:30 AM to 6:59 AM | 2,608 (6.7%) | 3,689 (11.9%) |
| 7:00 AM to 7:29 AM | 5,395 (13.9%) | 5,449 (17.7%) |
| 7:30 AM to 7:59 AM | 1,810 (4.7%) | 2,147 (7.0%) |
| 8:00 AM to 8:29 AM | 3,244 (8.4%) | 3,478 (11.3%) |
| 8:30 AM to 8:59 AM | 1,216 (3.1%) | 1,362 (4.4%) |
| 9:00 AM to 9:59 AM | 1,890 (4.9%) | 2,330 (7.5%) |
| 10:00 AM to 10:59 AM | 952 (2.5%) | 1,145 (3.7%) |
| 11:00 AM to 11:59 AM | 308 (0.8%) | 724 (2.4%) |
| 12:00 PM to 3:59 PM | 2,755 (7.1%) | 1,857 (6.0%) |
| 4:00 PM to 11:59 PM | 2,783 (7.2%) | 1,889 (6.1%) |
| Total | 38,744 (100.0%) | 30,861 (100.0%) |
Housing Occupancy in Corona
Occupancy by Ownership in Corona
Of the total 46,524 dwellings in Corona, owner-occupied units account for 29,338 (63.1%), while renter-occupied units make up 17,186 (36.9%).
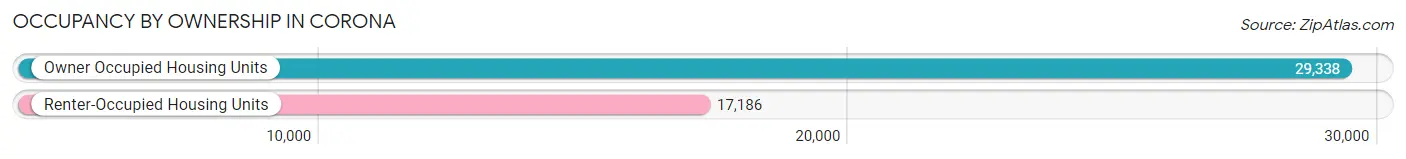
| Occupancy | # Housing Units | % Housing Units |
| Owner Occupied Housing Units | 29,338 | 63.1% |
| Renter-Occupied Housing Units | 17,186 | 36.9% |
| Total Occupied Housing Units | 46,524 | 100.0% |
Occupancy by Household Size in Corona
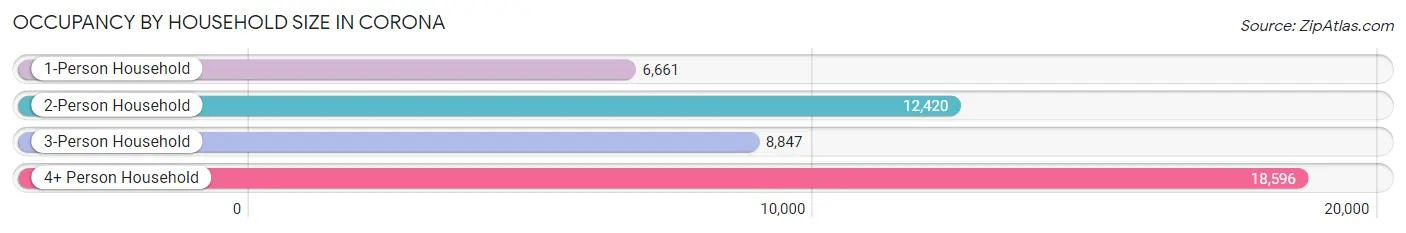
| Household Size | # Housing Units | % Housing Units |
| 1-Person Household | 6,661 | 14.3% |
| 2-Person Household | 12,420 | 26.7% |
| 3-Person Household | 8,847 | 19.0% |
| 4+ Person Household | 18,596 | 40.0% |
| Total Housing Units | 46,524 | 100.0% |
Occupancy by Ownership by Household Size in Corona
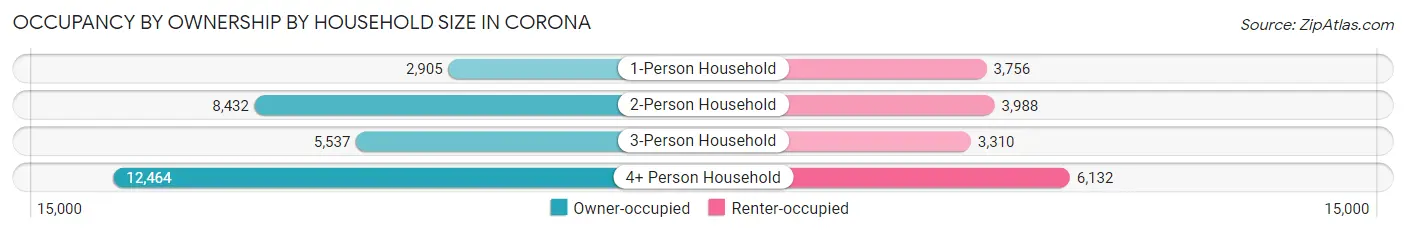
| Household Size | Owner-occupied | Renter-occupied |
| 1-Person Household | 2,905 (43.6%) | 3,756 (56.4%) |
| 2-Person Household | 8,432 (67.9%) | 3,988 (32.1%) |
| 3-Person Household | 5,537 (62.6%) | 3,310 (37.4%) |
| 4+ Person Household | 12,464 (67.0%) | 6,132 (33.0%) |
| Total Housing Units | 29,338 (63.1%) | 17,186 (36.9%) |
Occupancy by Educational Attainment in Corona
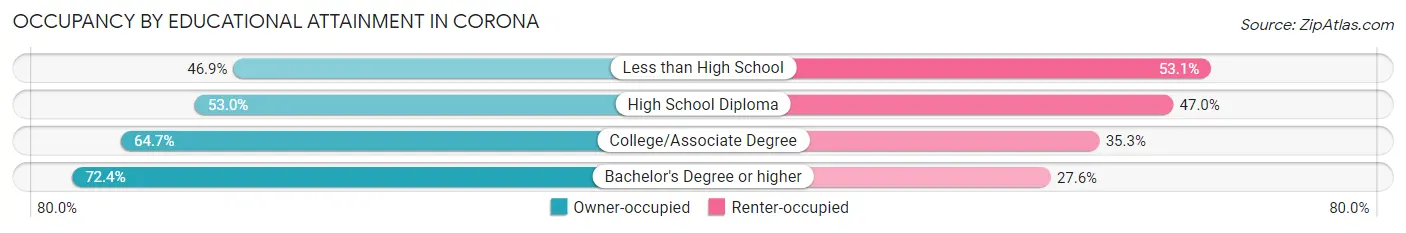
| Household Size | Owner-occupied | Renter-occupied |
| Less than High School | 2,623 (46.9%) | 2,970 (53.1%) |
| High School Diploma | 4,681 (53.0%) | 4,154 (47.0%) |
| College/Associate Degree | 10,176 (64.7%) | 5,551 (35.3%) |
| Bachelor's Degree or higher | 11,858 (72.4%) | 4,511 (27.6%) |
Occupancy by Age of Householder in Corona
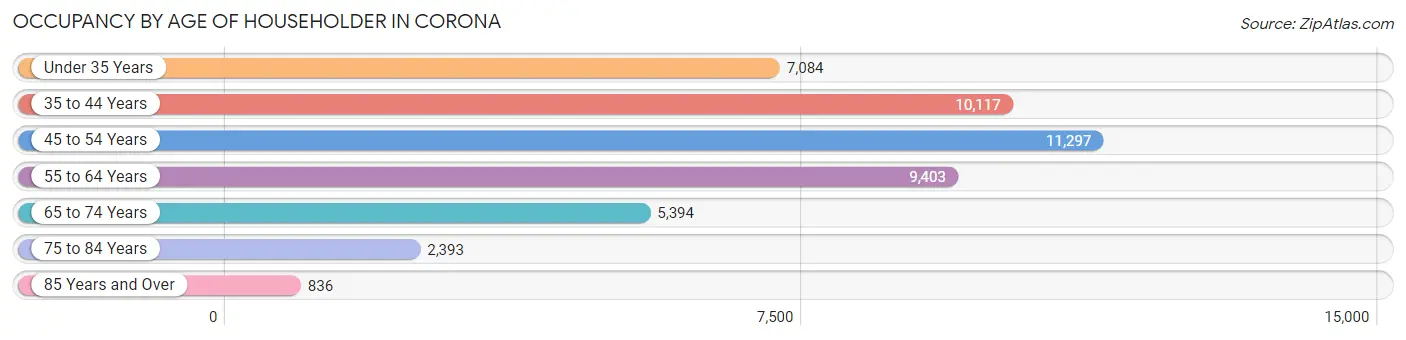
| Age Bracket | # Households | % Households |
| Under 35 Years | 7,084 | 15.2% |
| 35 to 44 Years | 10,117 | 21.7% |
| 45 to 54 Years | 11,297 | 24.3% |
| 55 to 64 Years | 9,403 | 20.2% |
| 65 to 74 Years | 5,394 | 11.6% |
| 75 to 84 Years | 2,393 | 5.1% |
| 85 Years and Over | 836 | 1.8% |
| Total | 46,524 | 100.0% |
Housing Finances in Corona
Median Income by Occupancy in Corona
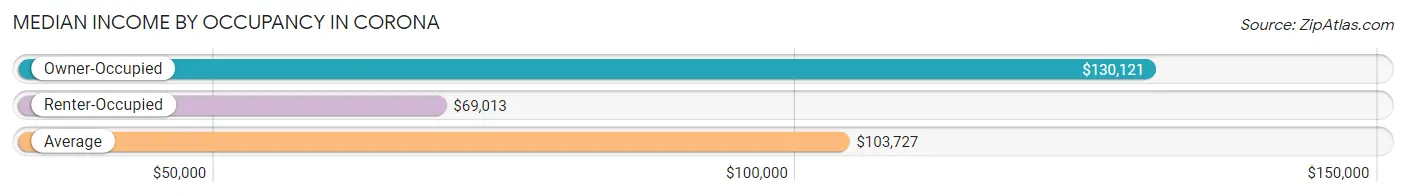
| Occupancy Type | # Households | Median Income |
| Owner-Occupied | 29,338 (63.1%) | $130,121 |
| Renter-Occupied | 17,186 (36.9%) | $69,013 |
| Average | 46,524 (100.0%) | $103,727 |
Occupancy by Householder Income Bracket in Corona
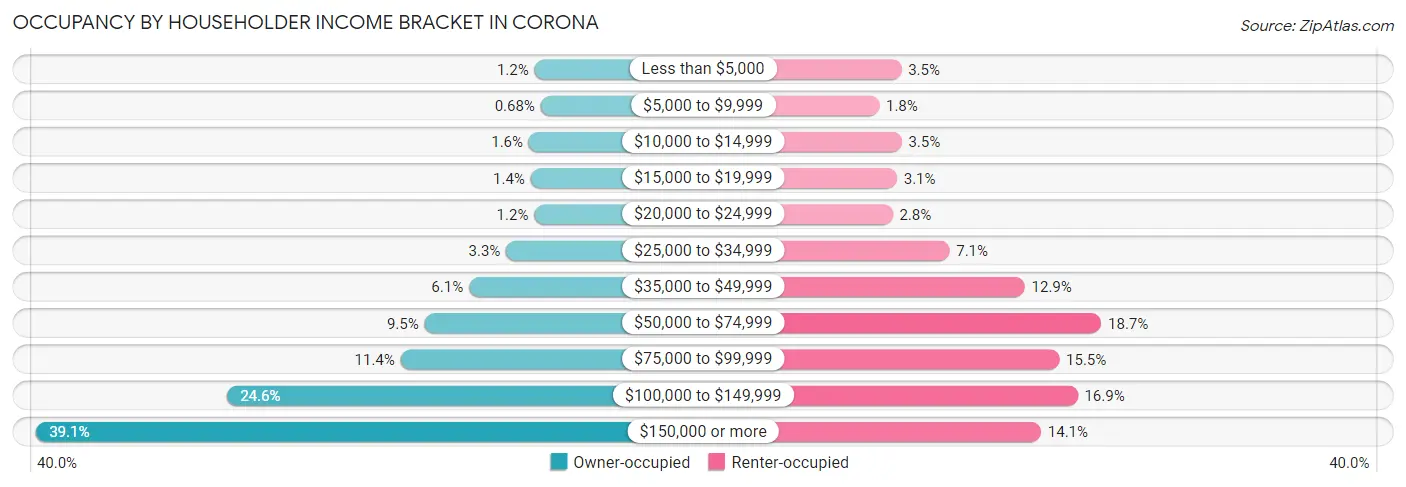
| Income Bracket | Owner-occupied | Renter-occupied |
| Less than $5,000 | 337 (1.1%) | 598 (3.5%) |
| $5,000 to $9,999 | 199 (0.7%) | 308 (1.8%) |
| $10,000 to $14,999 | 463 (1.6%) | 601 (3.5%) |
| $15,000 to $19,999 | 422 (1.4%) | 540 (3.1%) |
| $20,000 to $24,999 | 343 (1.2%) | 483 (2.8%) |
| $25,000 to $34,999 | 970 (3.3%) | 1,227 (7.1%) |
| $35,000 to $49,999 | 1,800 (6.1%) | 2,213 (12.9%) |
| $50,000 to $74,999 | 2,796 (9.5%) | 3,216 (18.7%) |
| $75,000 to $99,999 | 3,329 (11.4%) | 2,666 (15.5%) |
| $100,000 to $149,999 | 7,204 (24.6%) | 2,907 (16.9%) |
| $150,000 or more | 11,475 (39.1%) | 2,427 (14.1%) |
| Total | 29,338 (100.0%) | 17,186 (100.0%) |
Monthly Housing Cost Tiers in Corona
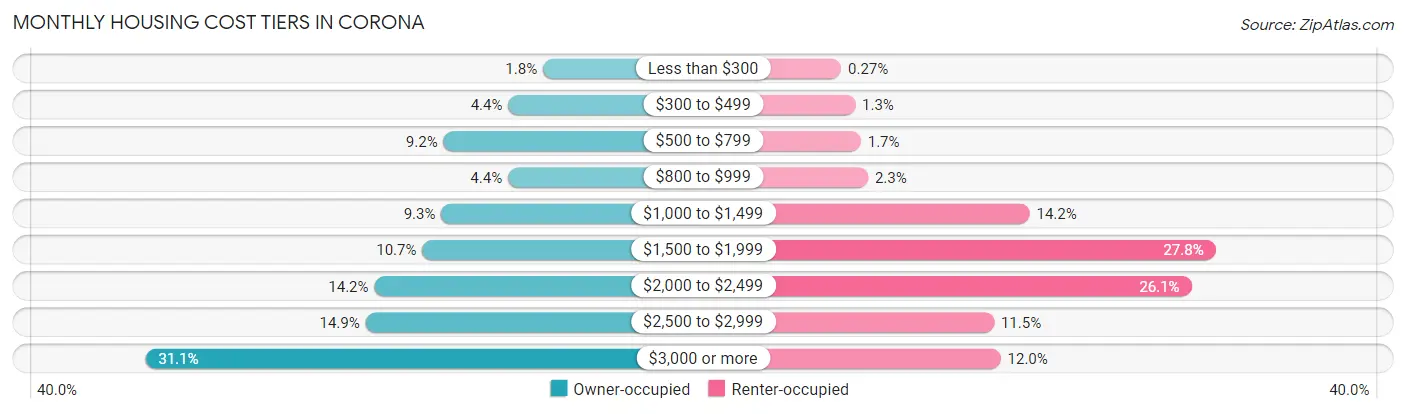
| Monthly Cost | Owner-occupied | Renter-occupied |
| Less than $300 | 534 (1.8%) | 47 (0.3%) |
| $300 to $499 | 1,284 (4.4%) | 224 (1.3%) |
| $500 to $799 | 2,685 (9.1%) | 296 (1.7%) |
| $800 to $999 | 1,291 (4.4%) | 386 (2.2%) |
| $1,000 to $1,499 | 2,730 (9.3%) | 2,432 (14.1%) |
| $1,500 to $1,999 | 3,141 (10.7%) | 4,784 (27.8%) |
| $2,000 to $2,499 | 4,178 (14.2%) | 4,480 (26.1%) |
| $2,500 to $2,999 | 4,368 (14.9%) | 1,981 (11.5%) |
| $3,000 or more | 9,127 (31.1%) | 2,065 (12.0%) |
| Total | 29,338 (100.0%) | 17,186 (100.0%) |
Physical Housing Characteristics in Corona
Housing Structures in Corona
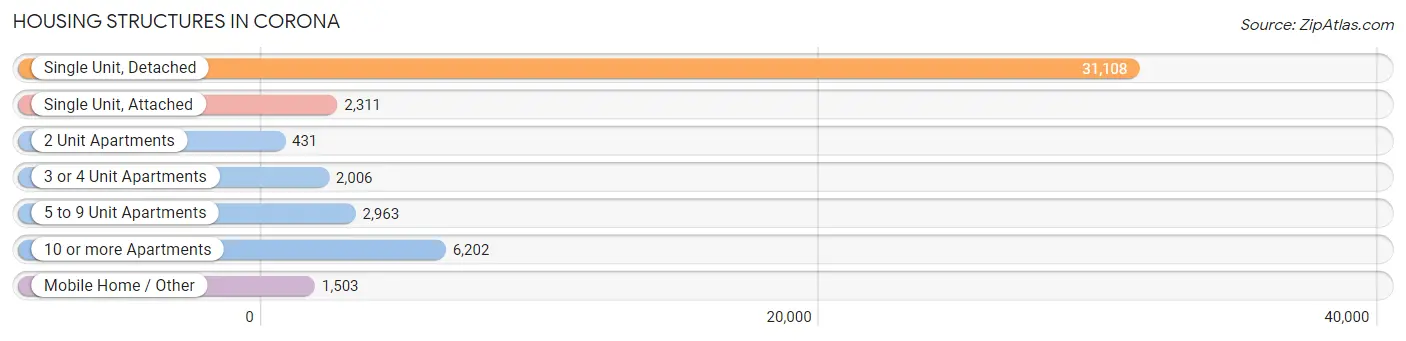
| Structure Type | # Housing Units | % Housing Units |
| Single Unit, Detached | 31,108 | 66.9% |
| Single Unit, Attached | 2,311 | 5.0% |
| 2 Unit Apartments | 431 | 0.9% |
| 3 or 4 Unit Apartments | 2,006 | 4.3% |
| 5 to 9 Unit Apartments | 2,963 | 6.4% |
| 10 or more Apartments | 6,202 | 13.3% |
| Mobile Home / Other | 1,503 | 3.2% |
| Total | 46,524 | 100.0% |
Housing Structures by Occupancy in Corona
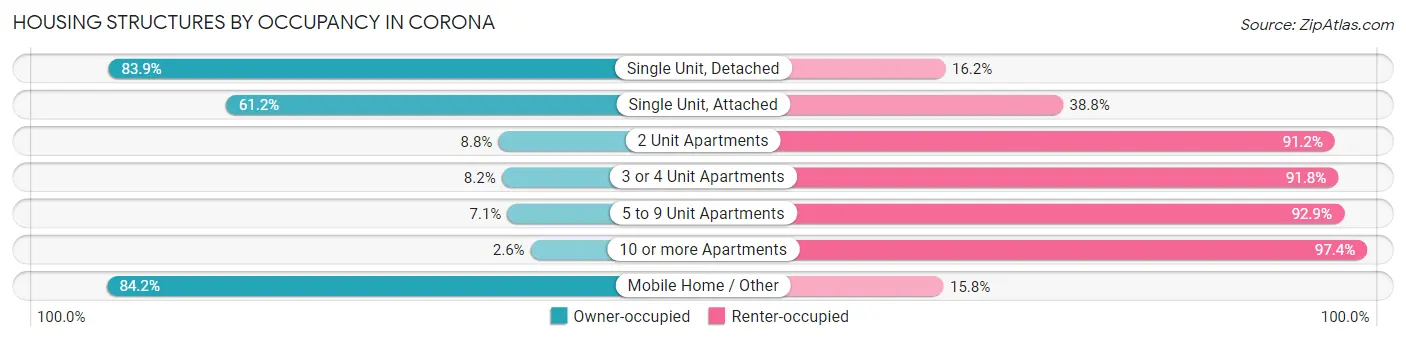
| Structure Type | Owner-occupied | Renter-occupied |
| Single Unit, Detached | 26,083 (83.9%) | 5,025 (16.2%) |
| Single Unit, Attached | 1,415 (61.2%) | 896 (38.8%) |
| 2 Unit Apartments | 38 (8.8%) | 393 (91.2%) |
| 3 or 4 Unit Apartments | 164 (8.2%) | 1,842 (91.8%) |
| 5 to 9 Unit Apartments | 210 (7.1%) | 2,753 (92.9%) |
| 10 or more Apartments | 162 (2.6%) | 6,040 (97.4%) |
| Mobile Home / Other | 1,266 (84.2%) | 237 (15.8%) |
| Total | 29,338 (63.1%) | 17,186 (36.9%) |
Housing Structures by Number of Rooms in Corona
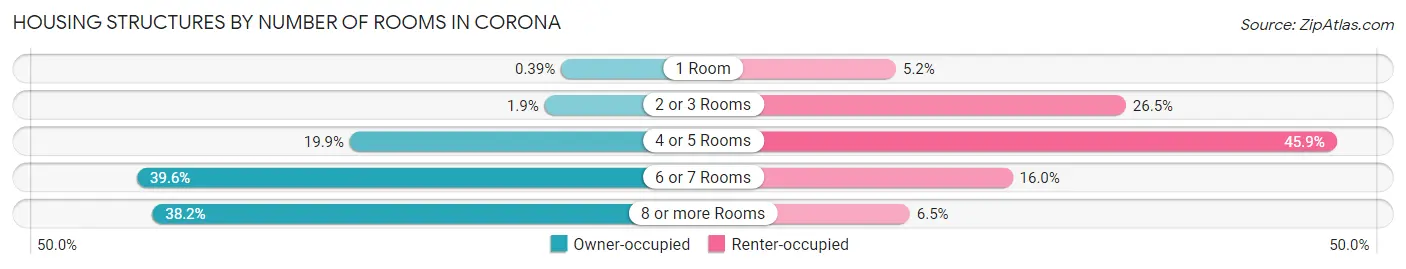
| Number of Rooms | Owner-occupied | Renter-occupied |
| 1 Room | 113 (0.4%) | 892 (5.2%) |
| 2 or 3 Rooms | 559 (1.9%) | 4,546 (26.5%) |
| 4 or 5 Rooms | 5,844 (19.9%) | 7,892 (45.9%) |
| 6 or 7 Rooms | 11,620 (39.6%) | 2,744 (16.0%) |
| 8 or more Rooms | 11,202 (38.2%) | 1,112 (6.5%) |
| Total | 29,338 (100.0%) | 17,186 (100.0%) |
Housing Structure by Heating Type in Corona
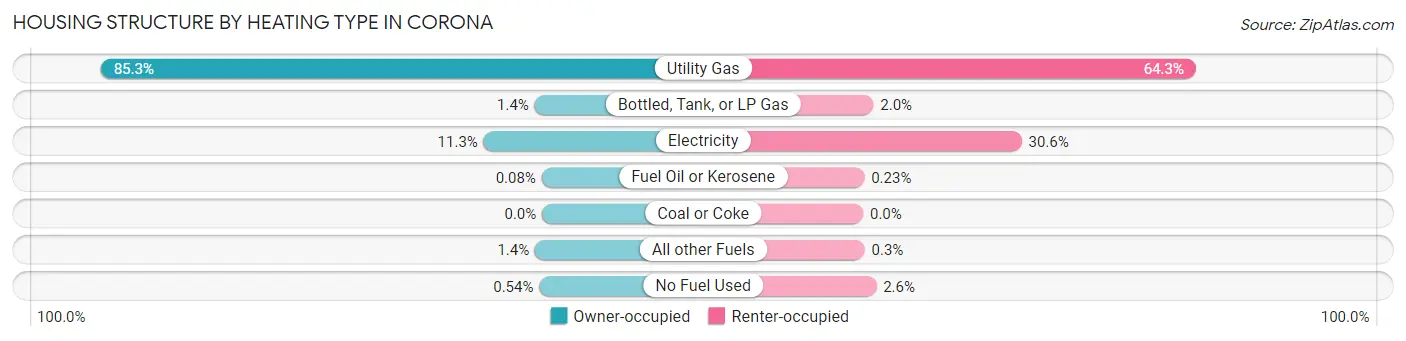
| Heating Type | Owner-occupied | Renter-occupied |
| Utility Gas | 25,023 (85.3%) | 11,051 (64.3%) |
| Bottled, Tank, or LP Gas | 422 (1.4%) | 342 (2.0%) |
| Electricity | 3,311 (11.3%) | 5,262 (30.6%) |
| Fuel Oil or Kerosene | 23 (0.1%) | 40 (0.2%) |
| Coal or Coke | 0 (0.0%) | 0 (0.0%) |
| All other Fuels | 401 (1.4%) | 52 (0.3%) |
| No Fuel Used | 158 (0.5%) | 439 (2.5%) |
| Total | 29,338 (100.0%) | 17,186 (100.0%) |
Household Vehicle Usage in Corona
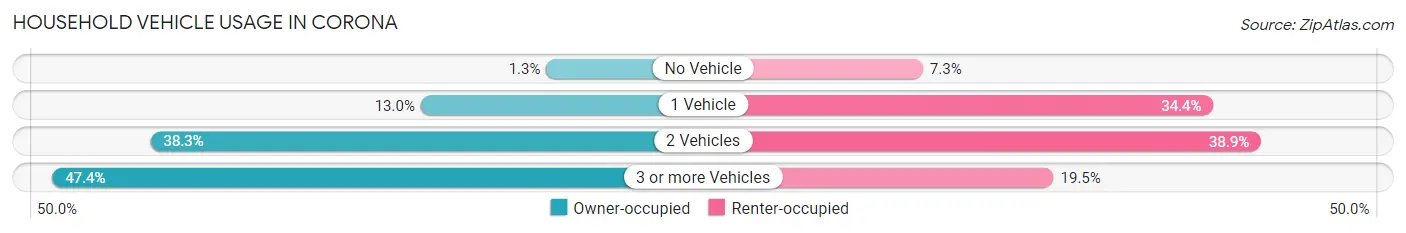
| Vehicles per Household | Owner-occupied | Renter-occupied |
| No Vehicle | 380 (1.3%) | 1,252 (7.3%) |
| 1 Vehicle | 3,821 (13.0%) | 5,910 (34.4%) |
| 2 Vehicles | 11,224 (38.3%) | 6,676 (38.9%) |
| 3 or more Vehicles | 13,913 (47.4%) | 3,348 (19.5%) |
| Total | 29,338 (100.0%) | 17,186 (100.0%) |
Real Estate & Mortgages in Corona
Real Estate and Mortgage Overview in Corona
| Characteristic | Without Mortgage | With Mortgage |
| Housing Units | 7,224 | 22,114 |
| Median Property Value | $577,500 | $636,900 |
| Median Household Income | $97,196 | $9,647 |
| Monthly Housing Costs | $711 | $8,972 |
| Real Estate Taxes | $3,577 | $308 |
Property Value by Mortgage Status in Corona
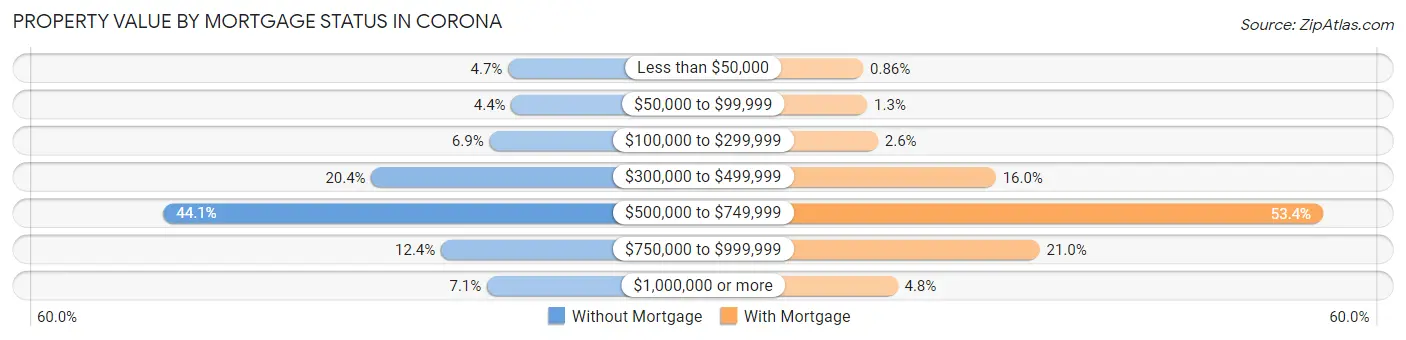
| Property Value | Without Mortgage | With Mortgage |
| Less than $50,000 | 342 (4.7%) | 190 (0.9%) |
| $50,000 to $99,999 | 315 (4.4%) | 294 (1.3%) |
| $100,000 to $299,999 | 496 (6.9%) | 565 (2.5%) |
| $300,000 to $499,999 | 1,471 (20.4%) | 3,543 (16.0%) |
| $500,000 to $749,999 | 3,188 (44.1%) | 11,810 (53.4%) |
| $750,000 to $999,999 | 896 (12.4%) | 4,651 (21.0%) |
| $1,000,000 or more | 516 (7.1%) | 1,061 (4.8%) |
| Total | 7,224 (100.0%) | 22,114 (100.0%) |
Household Income by Mortgage Status in Corona
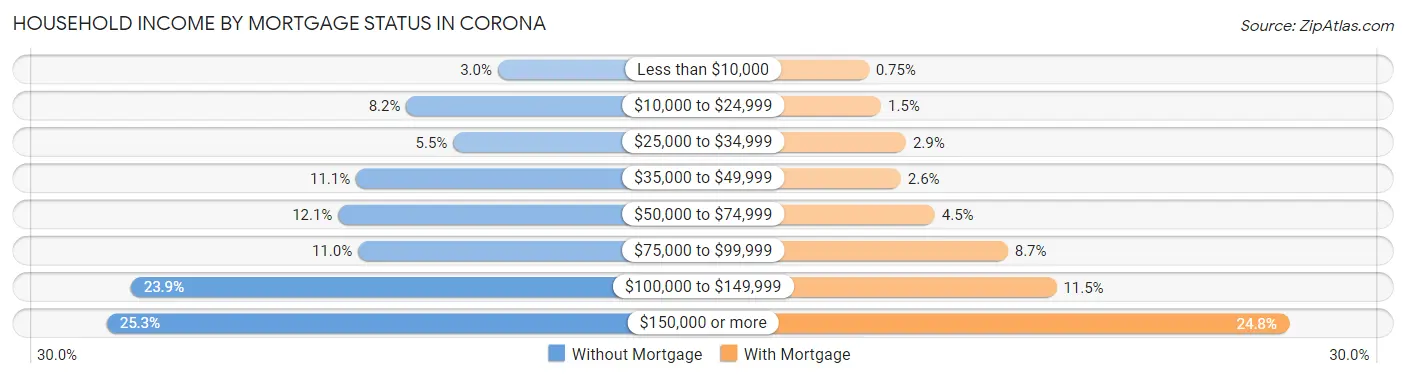
| Household Income | Without Mortgage | With Mortgage |
| Less than $10,000 | 214 (3.0%) | 166 (0.7%) |
| $10,000 to $24,999 | 592 (8.2%) | 322 (1.5%) |
| $25,000 to $34,999 | 398 (5.5%) | 636 (2.9%) |
| $35,000 to $49,999 | 799 (11.1%) | 572 (2.6%) |
| $50,000 to $74,999 | 873 (12.1%) | 1,001 (4.5%) |
| $75,000 to $99,999 | 791 (11.0%) | 1,923 (8.7%) |
| $100,000 to $149,999 | 1,729 (23.9%) | 2,538 (11.5%) |
| $150,000 or more | 1,828 (25.3%) | 5,475 (24.8%) |
| Total | 7,224 (100.0%) | 22,114 (100.0%) |
Property Value to Household Income Ratio in Corona
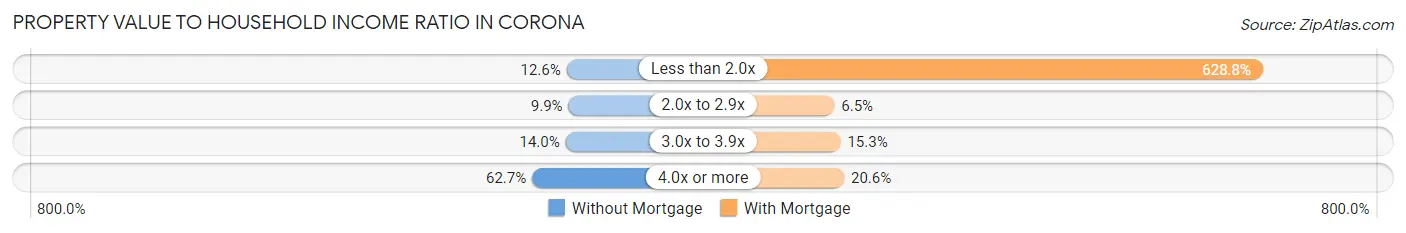
| Value-to-Income Ratio | Without Mortgage | With Mortgage |
| Less than 2.0x | 912 (12.6%) | 139,059 (628.8%) |
| 2.0x to 2.9x | 713 (9.9%) | 1,429 (6.5%) |
| 3.0x to 3.9x | 1,014 (14.0%) | 3,391 (15.3%) |
| 4.0x or more | 4,530 (62.7%) | 4,545 (20.5%) |
| Total | 7,224 (100.0%) | 22,114 (100.0%) |
Real Estate Taxes by Mortgage Status in Corona
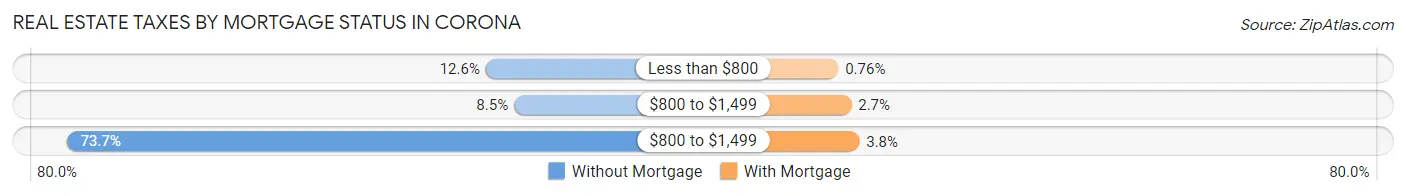
| Property Taxes | Without Mortgage | With Mortgage |
| Less than $800 | 912 (12.6%) | 169 (0.8%) |
| $800 to $1,499 | 613 (8.5%) | 589 (2.7%) |
| $800 to $1,499 | 5,326 (73.7%) | 847 (3.8%) |
| Total | 7,224 (100.0%) | 22,114 (100.0%) |
Health & Disability in Corona
Health Insurance Coverage by Age in Corona
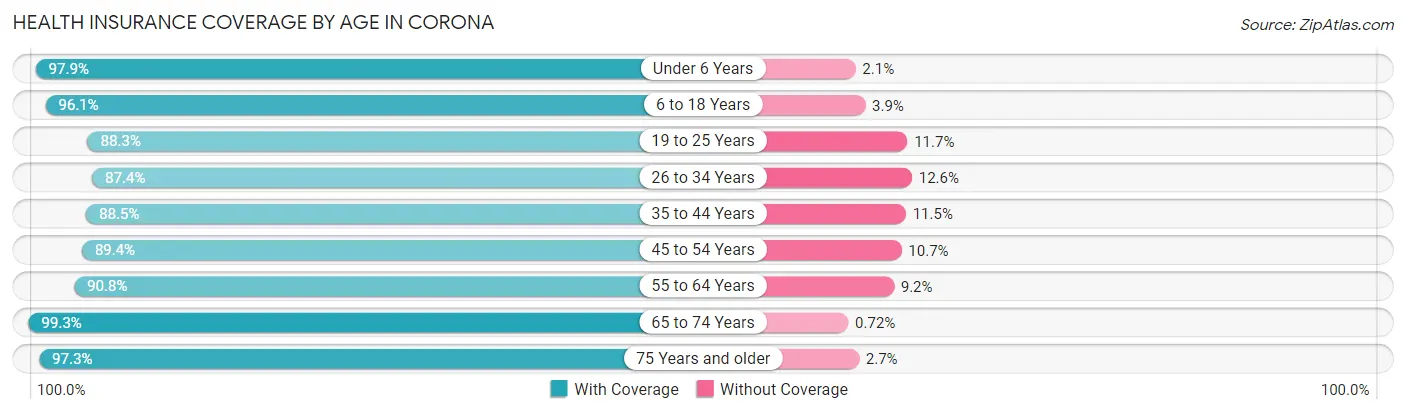
| Age Bracket | With Coverage | Without Coverage |
| Under 6 Years | 11,059 (97.9%) | 234 (2.1%) |
| 6 to 18 Years | 29,139 (96.1%) | 1,177 (3.9%) |
| 19 to 25 Years | 14,353 (88.3%) | 1,909 (11.7%) |
| 26 to 34 Years | 17,036 (87.4%) | 2,454 (12.6%) |
| 35 to 44 Years | 19,452 (88.5%) | 2,517 (11.5%) |
| 45 to 54 Years | 19,932 (89.3%) | 2,377 (10.6%) |
| 55 to 64 Years | 17,022 (90.8%) | 1,731 (9.2%) |
| 65 to 74 Years | 10,554 (99.3%) | 77 (0.7%) |
| 75 Years and older | 6,367 (97.3%) | 178 (2.7%) |
| Total | 144,914 (92.0%) | 12,654 (8.0%) |
Health Insurance Coverage by Citizenship Status in Corona
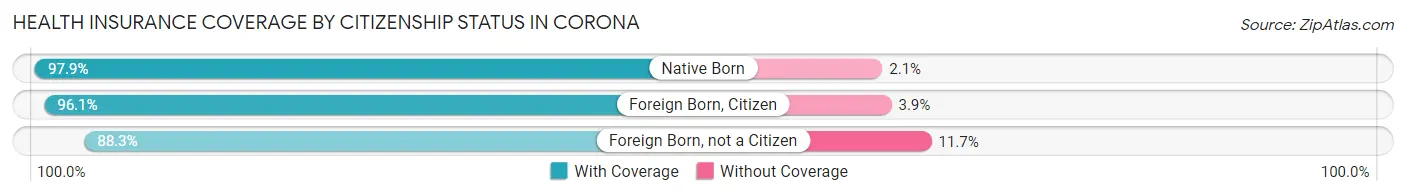
| Citizenship Status | With Coverage | Without Coverage |
| Native Born | 11,059 (97.9%) | 234 (2.1%) |
| Foreign Born, Citizen | 29,139 (96.1%) | 1,177 (3.9%) |
| Foreign Born, not a Citizen | 14,353 (88.3%) | 1,909 (11.7%) |
Health Insurance Coverage by Household Income in Corona
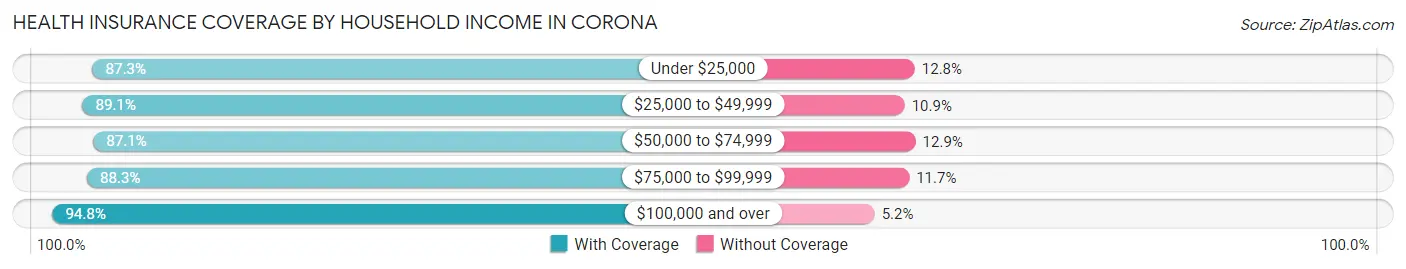
| Household Income | With Coverage | Without Coverage |
| Under $25,000 | 7,610 (87.3%) | 1,112 (12.8%) |
| $25,000 to $49,999 | 15,385 (89.1%) | 1,874 (10.9%) |
| $50,000 to $74,999 | 16,961 (87.1%) | 2,512 (12.9%) |
| $75,000 to $99,999 | 17,901 (88.3%) | 2,373 (11.7%) |
| $100,000 and over | 86,584 (94.8%) | 4,776 (5.2%) |
Public vs Private Health Insurance Coverage by Age in Corona
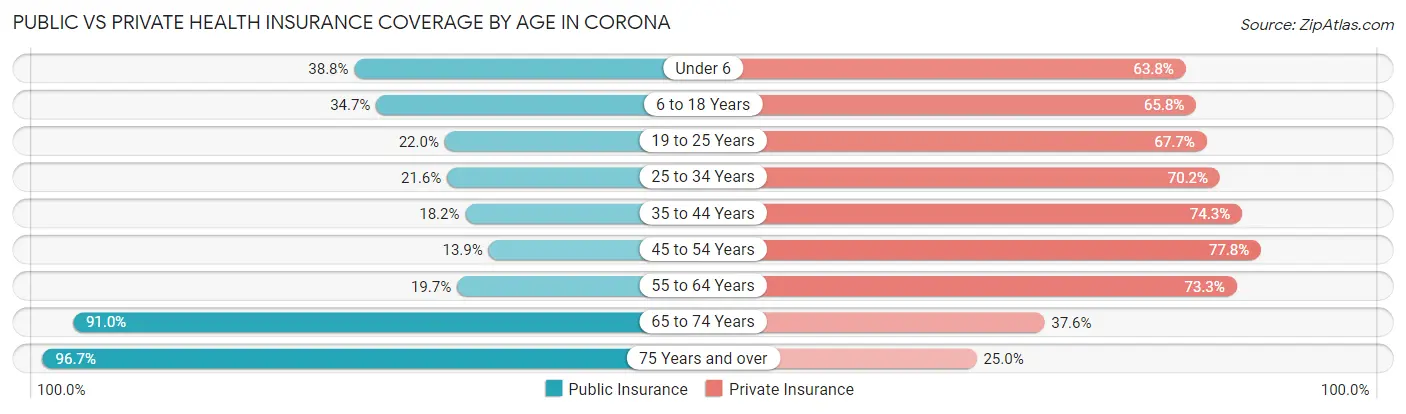
| Age Bracket | Public Insurance | Private Insurance |
| Under 6 | 4,381 (38.8%) | 7,207 (63.8%) |
| 6 to 18 Years | 10,533 (34.7%) | 19,940 (65.8%) |
| 19 to 25 Years | 3,581 (22.0%) | 11,012 (67.7%) |
| 25 to 34 Years | 4,206 (21.6%) | 13,677 (70.2%) |
| 35 to 44 Years | 3,999 (18.2%) | 16,323 (74.3%) |
| 45 to 54 Years | 3,096 (13.9%) | 17,359 (77.8%) |
| 55 to 64 Years | 3,701 (19.7%) | 13,742 (73.3%) |
| 65 to 74 Years | 9,676 (91.0%) | 3,996 (37.6%) |
| 75 Years and over | 6,326 (96.7%) | 1,636 (25.0%) |
| Total | 49,499 (31.4%) | 104,892 (66.6%) |
Disability Status by Sex by Age in Corona
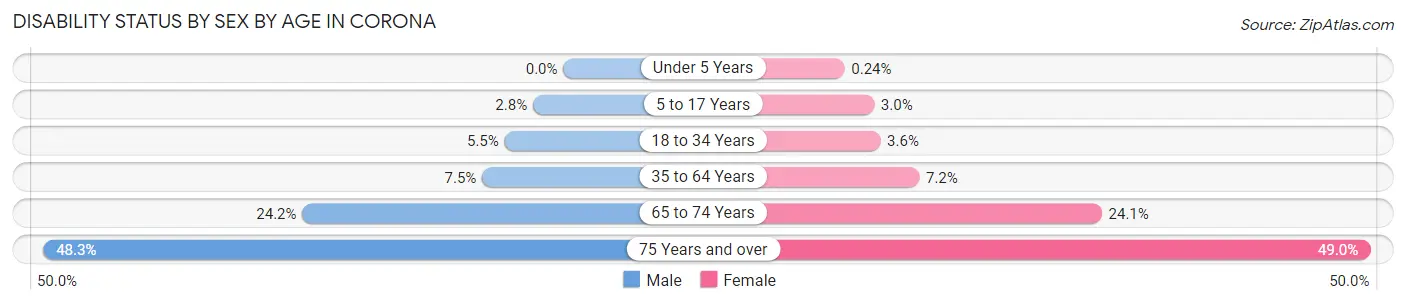
| Age Bracket | Male | Female |
| Under 5 Years | 0 (0.0%) | 11 (0.2%) |
| 5 to 17 Years | 448 (2.8%) | 410 (3.0%) |
| 18 to 34 Years | 1,058 (5.4%) | 673 (3.6%) |
| 35 to 64 Years | 2,342 (7.5%) | 2,289 (7.2%) |
| 65 to 74 Years | 1,260 (24.2%) | 1,309 (24.1%) |
| 75 Years and over | 1,339 (48.3%) | 1,849 (49.0%) |
Disability Class by Sex by Age in Corona
Disability Class: Hearing Difficulty
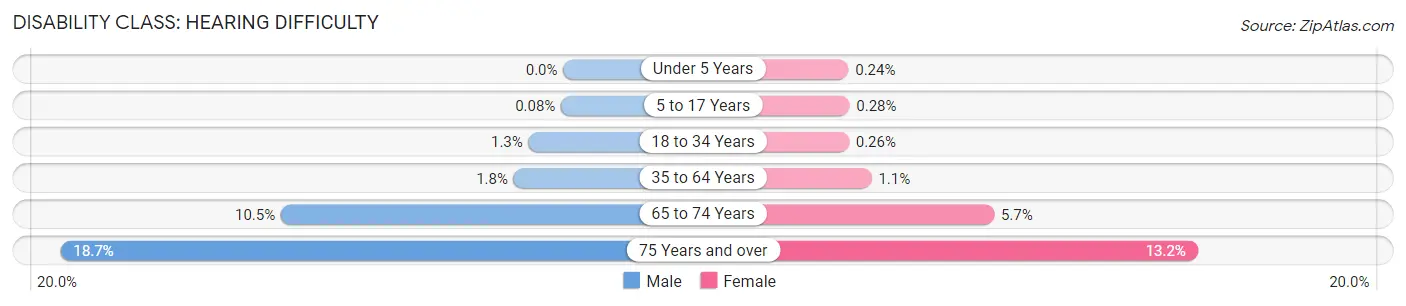
| Age Bracket | Male | Female |
| Under 5 Years | 0 (0.0%) | 11 (0.2%) |
| 5 to 17 Years | 13 (0.1%) | 38 (0.3%) |
| 18 to 34 Years | 250 (1.3%) | 50 (0.3%) |
| 35 to 64 Years | 571 (1.8%) | 352 (1.1%) |
| 65 to 74 Years | 545 (10.5%) | 307 (5.7%) |
| 75 Years and over | 518 (18.7%) | 498 (13.2%) |
Disability Class: Vision Difficulty
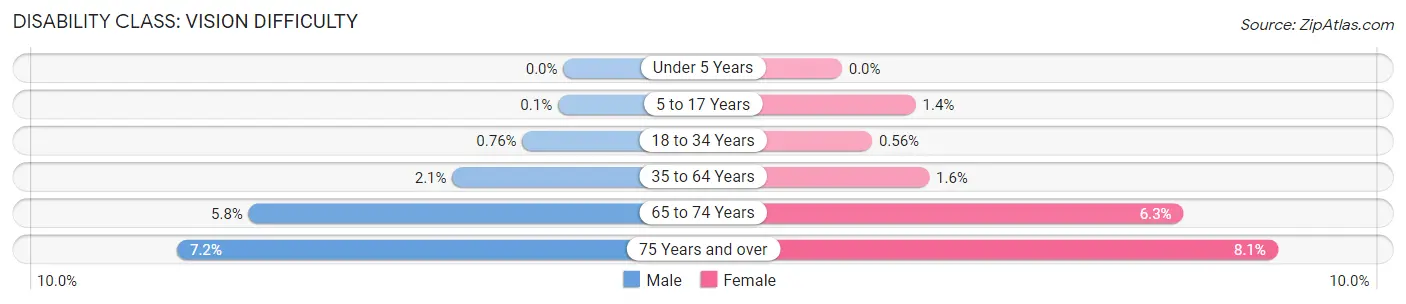
| Age Bracket | Male | Female |
| Under 5 Years | 0 (0.0%) | 0 (0.0%) |
| 5 to 17 Years | 16 (0.1%) | 188 (1.4%) |
| 18 to 34 Years | 148 (0.8%) | 106 (0.6%) |
| 35 to 64 Years | 640 (2.1%) | 518 (1.6%) |
| 65 to 74 Years | 304 (5.8%) | 344 (6.3%) |
| 75 Years and over | 199 (7.2%) | 305 (8.1%) |
Disability Class: Cognitive Difficulty
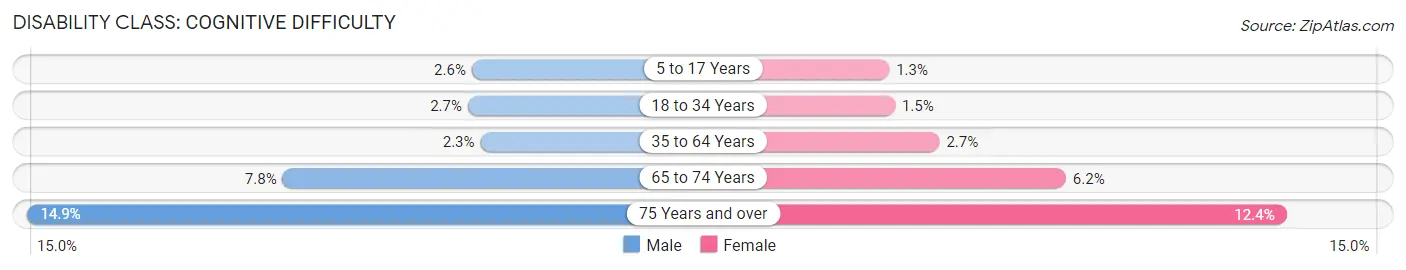
| Age Bracket | Male | Female |
| 5 to 17 Years | 405 (2.5%) | 181 (1.3%) |
| 18 to 34 Years | 516 (2.7%) | 280 (1.5%) |
| 35 to 64 Years | 719 (2.3%) | 868 (2.7%) |
| 65 to 74 Years | 407 (7.8%) | 339 (6.2%) |
| 75 Years and over | 414 (14.9%) | 467 (12.4%) |
Disability Class: Ambulatory Difficulty
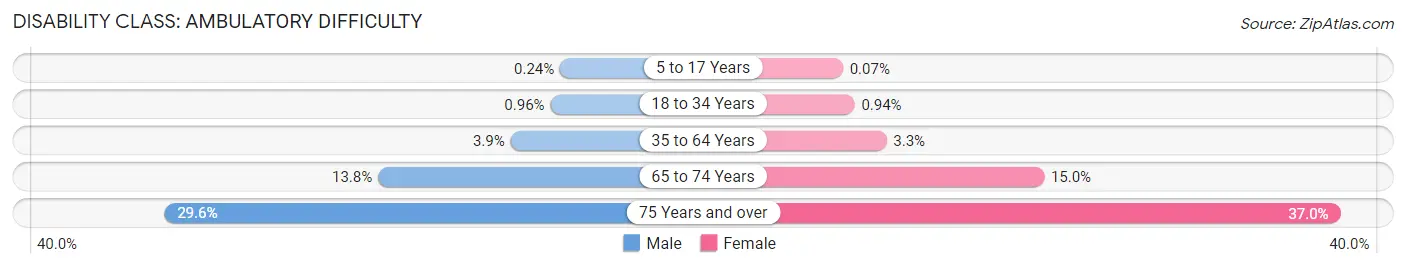
| Age Bracket | Male | Female |
| 5 to 17 Years | 38 (0.2%) | 9 (0.1%) |
| 18 to 34 Years | 186 (1.0%) | 177 (0.9%) |
| 35 to 64 Years | 1,219 (3.9%) | 1,056 (3.3%) |
| 65 to 74 Years | 716 (13.8%) | 815 (15.0%) |
| 75 Years and over | 822 (29.6%) | 1,396 (37.0%) |
Disability Class: Self-Care Difficulty
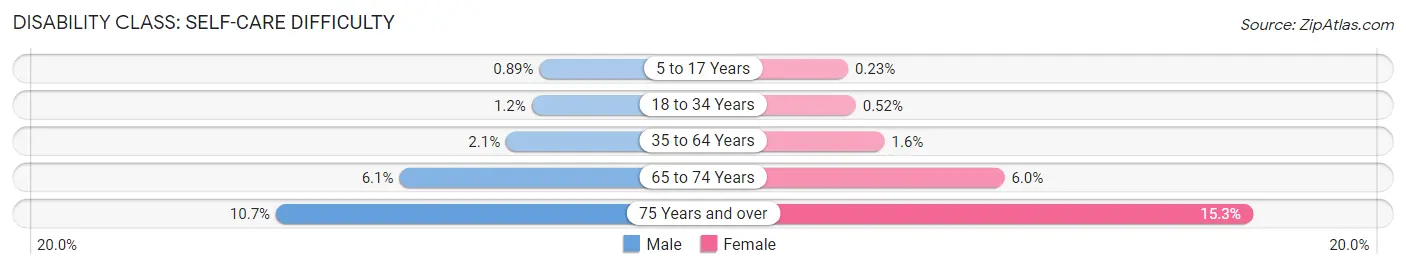
| Age Bracket | Male | Female |
| 5 to 17 Years | 141 (0.9%) | 31 (0.2%) |
| 18 to 34 Years | 230 (1.2%) | 98 (0.5%) |
| 35 to 64 Years | 662 (2.1%) | 508 (1.6%) |
| 65 to 74 Years | 317 (6.1%) | 328 (6.0%) |
| 75 Years and over | 296 (10.7%) | 575 (15.2%) |
Technology Access in Corona
Computing Device Access in Corona
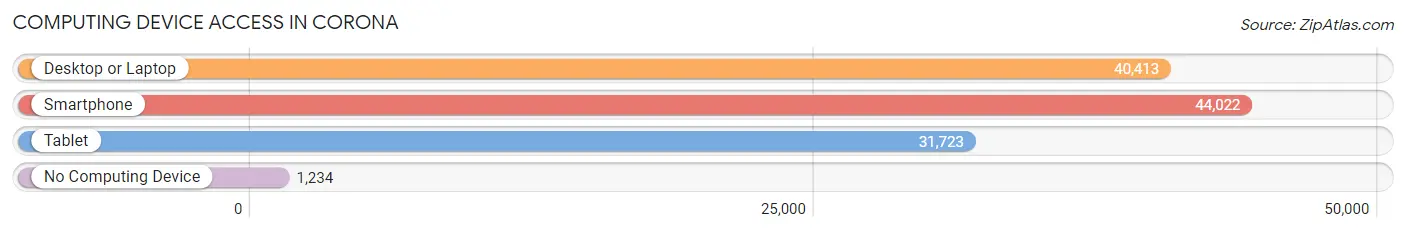
| Device Type | # Households | % Households |
| Desktop or Laptop | 40,413 | 86.9% |
| Smartphone | 44,022 | 94.6% |
| Tablet | 31,723 | 68.2% |
| No Computing Device | 1,234 | 2.6% |
| Total | 46,524 | 100.0% |
Internet Access in Corona
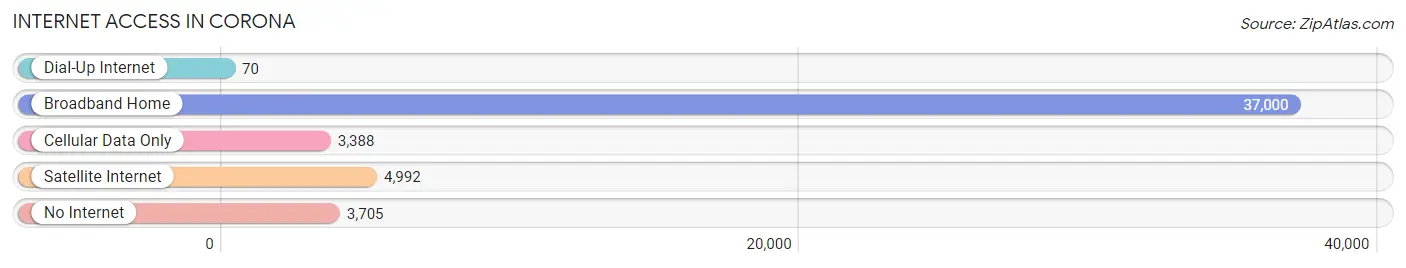
| Internet Type | # Households | % Households |
| Dial-Up Internet | 70 | 0.2% |
| Broadband Home | 37,000 | 79.5% |
| Cellular Data Only | 3,388 | 7.3% |
| Satellite Internet | 4,992 | 10.7% |
| No Internet | 3,705 | 8.0% |
| Total | 46,524 | 100.0% |
Corona Summary
Corona, California is a city located in Riverside County, California, United States. It is situated in the Inland Empire region of Southern California, about 45 miles (72 km) southeast of downtown Los Angeles. As of the 2010 census, the city had a population of 152,374, up from 124,966 at the 2000 census. The city of Corona is part of the Greater Los Angeles Area.
History
The area that is now Corona was originally inhabited by the Tongva Native Americans. The first Europeans to settle in the area were the Spanish, who established the Rancho La Sierra in 1776. The area was later annexed by the United States in 1848, and the city of Corona was founded in 1886. The city was named after the Spanish word for “crown”, and was originally a citrus-growing community.
Geography
Corona is located in Riverside County, California, at the junction of the 91 and 15 freeways. It is situated in the Inland Empire region of Southern California, about 45 miles (72 km) southeast of downtown Los Angeles. The city covers an area of 38.9 square miles (101 km2), with a population density of 3,912 people per square mile (1,509/km2).
Economy
Corona’s economy is largely based on manufacturing and distribution. The city is home to several large companies, including Fender Musical Instruments, Monster Beverage Corporation, and Corona Beer. The city also has a large retail sector, with several shopping centers and outlets.
Demographics
As of the 2010 census, the city had a population of 152,374, up from 124,966 at the 2000 census. The racial makeup of the city was 68.2% White, 4.2% African American, 0.7% Native American, 8.2% Asian, 0.3% Pacific Islander, 14.2% from other races, and 4.1% from two or more races. Hispanic or Latino of any race were 33.2% of the population.
The median income for a household in the city was $60,837, and the median income for a family was $68,906. The per capita income for the city was $25,845. About 11.2% of families and 14.2% of the population were below the poverty line, including 19.2% of those under age 18 and 8.2% of those age 65 or over.
Conclusion
Corona, California is a city located in Riverside County, California, United States. It is situated in the Inland Empire region of Southern California, about 45 miles (72 km) southeast of downtown Los Angeles. The city was founded in 1886 and was originally a citrus-growing community. The city covers an area of 38.9 square miles (101 km2), with a population density of 3,912 people per square mile (1,509/km2). The city’s economy is largely based on manufacturing and distribution, and it is home to several large companies. As of the 2010 census, the city had a population of 152,374, with a median income for a household of $60,837.
Common Questions
What is Per Capita Income in Corona?
Per Capita income in Corona is $38,353.
What is the Median Family Income in Corona?
Median Family Income in Corona is $113,508.
What is the Median Household income in Corona?
Median Household Income in Corona is $103,727.
What is Income or Wage Gap in Corona?
Income or Wage Gap in Corona is 25.2%.
Women in Corona earn 74.8 cents for every dollar earned by a man.
What is Family Income Deficit in Corona?
Family Income Deficit in Corona is $10,118.
Families that are below poverty line in Corona earn $10,118 less on average than the poverty threshold level.
What is Inequality or Gini Index in Corona?
Inequality or Gini Index in Corona is 0.42.
What is the Total Population of Corona?
Total Population of Corona is 158,346.
What is the Total Male Population of Corona?
Total Male Population of Corona is 79,651.
What is the Total Female Population of Corona?
Total Female Population of Corona is 78,695.
What is the Ratio of Males per 100 Females in Corona?
There are 101.21 Males per 100 Females in Corona.
What is the Ratio of Females per 100 Males in Corona?
There are 98.80 Females per 100 Males in Corona.
What is the Median Population Age in Corona?
Median Population Age in Corona is 35.9 Years.
What is the Average Family Size in Corona
Average Family Size in Corona is 3.7 People.
What is the Average Household Size in Corona
Average Household Size in Corona is 3.4 People.
How Large is the Labor Force in Corona?
There are 82,238 People in the Labor Forcein in Corona.
What is the Percentage of People in the Labor Force in Corona?
66.4% of People are in the Labor Force in Corona.
What is the Unemployment Rate in Corona?
Unemployment Rate in Corona is 4.6%.