Concord, CA Map & Demographics
Concord Map
Concord Overview
$48,628
PER CAPITA INCOME
$122,125
AVG FAMILY INCOME
$107,789
AVG HOUSEHOLD INCOME
24.7%
WAGE / INCOME GAP [ % ]
75.3¢/ $1
WAGE / INCOME GAP [ $ ]
$12,738
FAMILY INCOME DEFICIT
0.43
INEQUALITY / GINI INDEX
125,007
TOTAL POPULATION
62,319
MALE POPULATION
62,688
FEMALE POPULATION
99.41
MALES / 100 FEMALES
100.59
FEMALES / 100 MALES
38.8
MEDIAN AGE
3.3
AVG FAMILY SIZE
2.7
AVG HOUSEHOLD SIZE
68,472
LABOR FORCE [ PEOPLE ]
67.1%
PERCENT IN LABOR FORCE
4.9%
UNEMPLOYMENT RATE
Concord Area Codes
Income in Concord
Income Overview in Concord
Per Capita Income in Concord is $48,628, while median incomes of families and households are $122,125 and $107,789 respectively.
| Characteristic | Number | Measure |
| Per Capita Income | 125,007 | $48,628 |
| Median Family Income | 30,197 | $122,125 |
| Mean Family Income | 30,197 | $147,096 |
| Median Household Income | 45,574 | $107,789 |
| Mean Household Income | 45,574 | $130,276 |
| Income Deficit | 30,197 | $12,738 |
| Wage / Income Gap (%) | 125,007 | 24.74% |
| Wage / Income Gap ($) | 125,007 | 75.26¢ per $1 |
| Gini / Inequality Index | 125,007 | 0.43 |
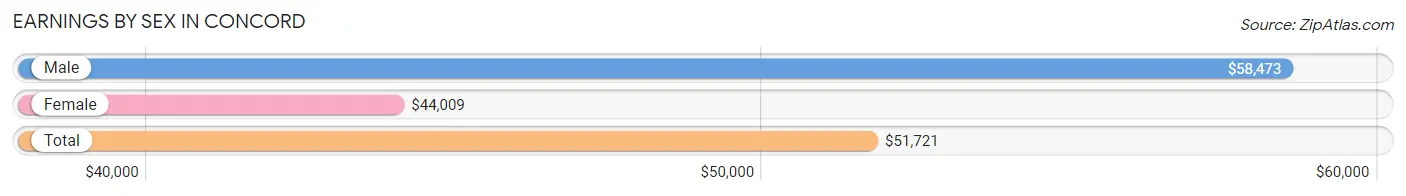
Earnings by Sex in Concord
Average Earnings in Concord are $51,721, $58,473 for men and $44,009 for women, a difference of 24.7%.
| Sex | Number | Average Earnings |
| Male | 36,741 (52.4%) | $58,473 |
| Female | 33,321 (47.6%) | $44,009 |
| Total | 70,062 (100.0%) | $51,721 |
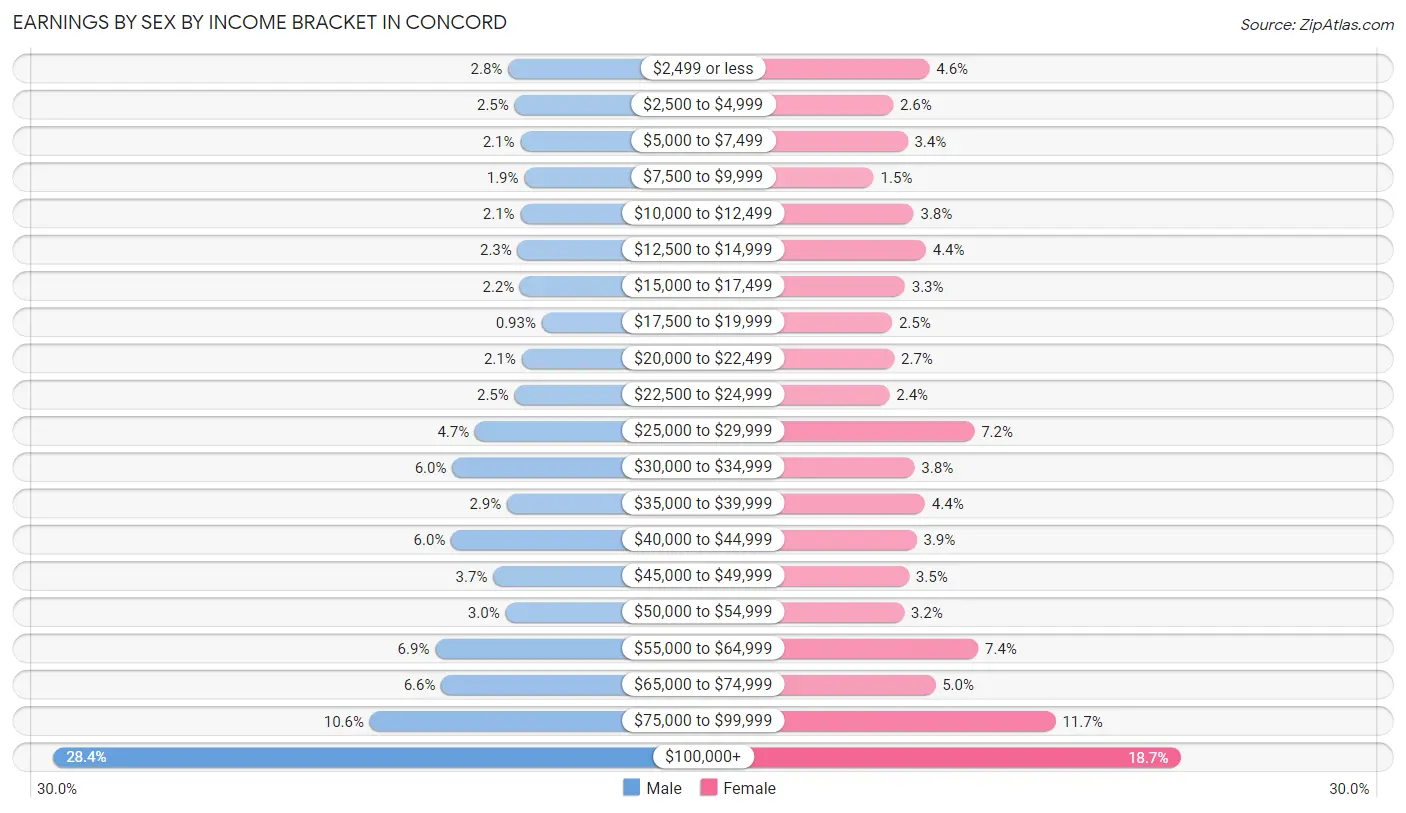
Earnings by Sex by Income Bracket in Concord
The most common earnings brackets in Concord are $100,000+ for men (10,430 | 28.4%) and $100,000+ for women (6,246 | 18.7%).
| Income | Male | Female |
| $2,499 or less | 1,036 (2.8%) | 1,547 (4.6%) |
| $2,500 to $4,999 | 903 (2.5%) | 868 (2.6%) |
| $5,000 to $7,499 | 786 (2.1%) | 1,137 (3.4%) |
| $7,500 to $9,999 | 703 (1.9%) | 503 (1.5%) |
| $10,000 to $12,499 | 782 (2.1%) | 1,251 (3.7%) |
| $12,500 to $14,999 | 841 (2.3%) | 1,478 (4.4%) |
| $15,000 to $17,499 | 789 (2.1%) | 1,087 (3.3%) |
| $17,500 to $19,999 | 340 (0.9%) | 846 (2.5%) |
| $20,000 to $22,499 | 759 (2.1%) | 885 (2.7%) |
| $22,500 to $24,999 | 902 (2.5%) | 796 (2.4%) |
| $25,000 to $29,999 | 1,719 (4.7%) | 2,386 (7.2%) |
| $30,000 to $34,999 | 2,188 (6.0%) | 1,267 (3.8%) |
| $35,000 to $39,999 | 1,059 (2.9%) | 1,463 (4.4%) |
| $40,000 to $44,999 | 2,212 (6.0%) | 1,305 (3.9%) |
| $45,000 to $49,999 | 1,344 (3.7%) | 1,164 (3.5%) |
| $50,000 to $54,999 | 1,093 (3.0%) | 1,070 (3.2%) |
| $55,000 to $64,999 | 2,543 (6.9%) | 2,458 (7.4%) |
| $65,000 to $74,999 | 2,419 (6.6%) | 1,656 (5.0%) |
| $75,000 to $99,999 | 3,893 (10.6%) | 3,908 (11.7%) |
| $100,000+ | 10,430 (28.4%) | 6,246 (18.7%) |
| Total | 36,741 (100.0%) | 33,321 (100.0%) |
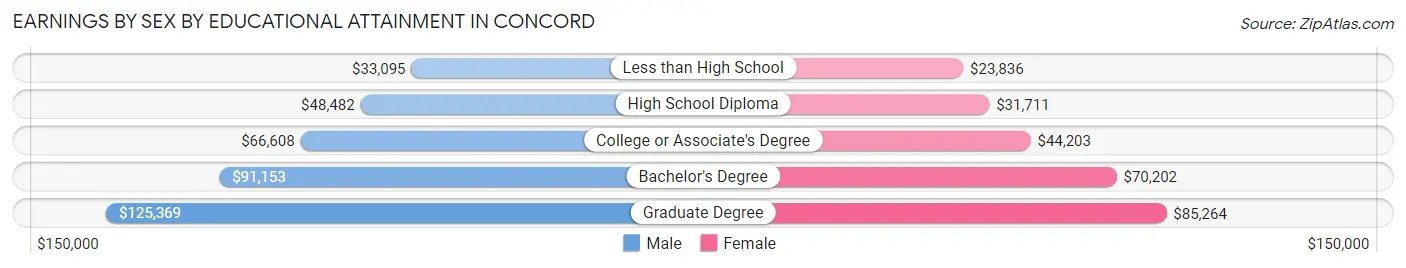
Earnings by Sex by Educational Attainment in Concord
Average earnings in Concord are $64,953 for men and $50,687 for women, a difference of 22.0%. Men with an educational attainment of graduate degree enjoy the highest average annual earnings of $125,369, while those with less than high school education earn the least with $33,095. Women with an educational attainment of graduate degree earn the most with the average annual earnings of $85,264, while those with less than high school education have the smallest earnings of $23,836.
| Educational Attainment | Male Income | Female Income |
| Less than High School | $33,095 | $23,836 |
| High School Diploma | $48,482 | $31,711 |
| College or Associate's Degree | $66,608 | $44,203 |
| Bachelor's Degree | $91,153 | $70,202 |
| Graduate Degree | $125,369 | $85,264 |
| Total | $64,953 | $50,687 |
Family Income in Concord
Family Income Brackets in Concord
According to the Concord family income data, there are 7,217 families falling into the $200,000+ income range, which is the most common income bracket and makes up 23.9% of all families. Conversely, the $10,000 to $14,999 income bracket is the least frequent group with only 574 families (1.9%) belonging to this category.
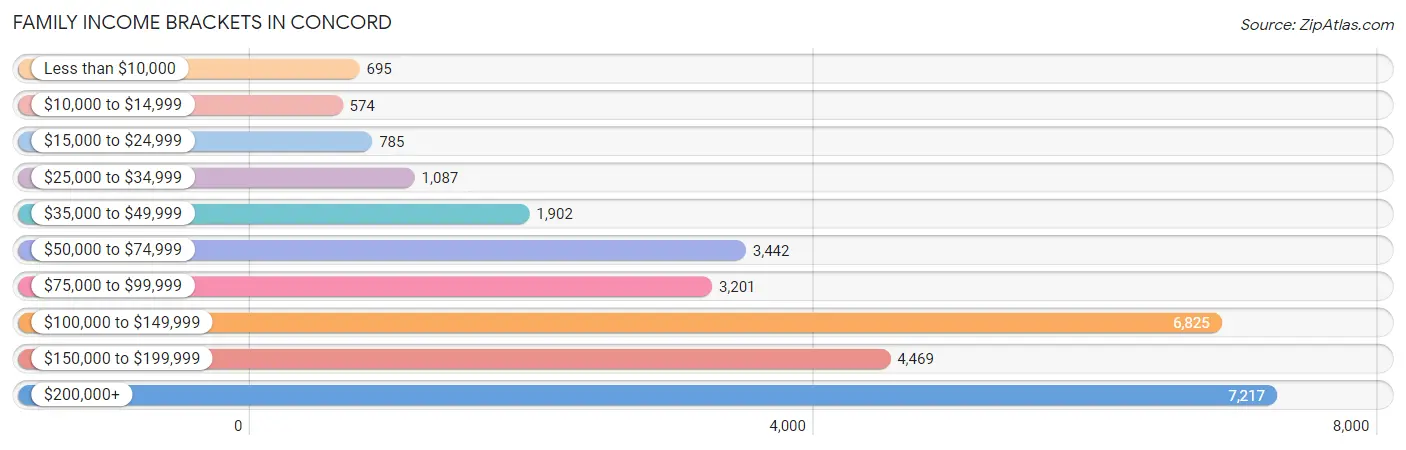
| Income Bracket | # Families | % Families |
| Less than $10,000 | 695 | 2.3% |
| $10,000 to $14,999 | 574 | 1.9% |
| $15,000 to $24,999 | 785 | 2.6% |
| $25,000 to $34,999 | 1,087 | 3.6% |
| $35,000 to $49,999 | 1,902 | 6.3% |
| $50,000 to $74,999 | 3,442 | 11.4% |
| $75,000 to $99,999 | 3,201 | 10.6% |
| $100,000 to $149,999 | 6,825 | 22.6% |
| $150,000 to $199,999 | 4,469 | 14.8% |
| $200,000+ | 7,217 | 23.9% |
Family Income by Famaliy Size in Concord
7+ person families (435 | 1.4%) account for the highest median family income in Concord with $187,917 per family, while 2-person families (12,494 | 41.4%) have the highest median income of $56,950 per family member.
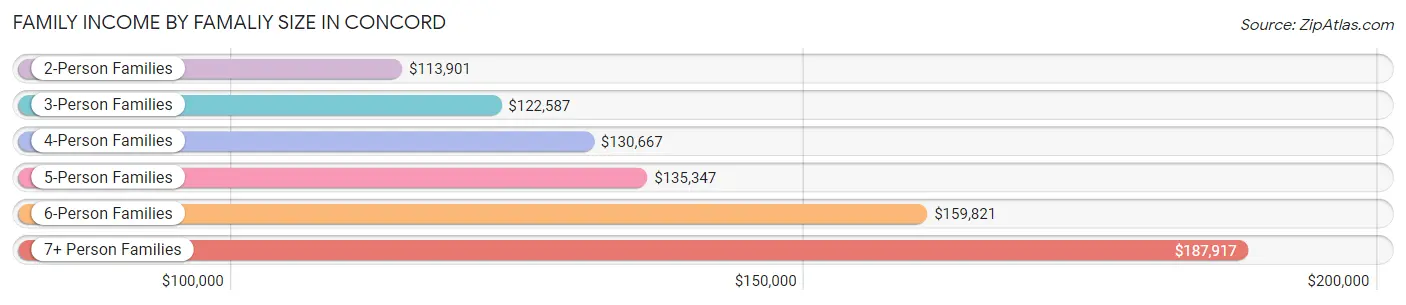
| Income Bracket | # Families | Median Income |
| 2-Person Families | 12,494 (41.4%) | $113,901 |
| 3-Person Families | 7,327 (24.3%) | $122,587 |
| 4-Person Families | 6,246 (20.7%) | $130,667 |
| 5-Person Families | 2,619 (8.7%) | $135,347 |
| 6-Person Families | 1,076 (3.6%) | $159,821 |
| 7+ Person Families | 435 (1.4%) | $187,917 |
| Total | 30,197 (100.0%) | $122,125 |
Family Income by Number of Earners in Concord
The median family income in Concord is $122,125, with families comprising 3+ earners (4,217) having the highest median family income of $162,829, while families with no earners (3,086) have the lowest median family income of $73,873, accounting for 14.0% and 10.2% of families, respectively.
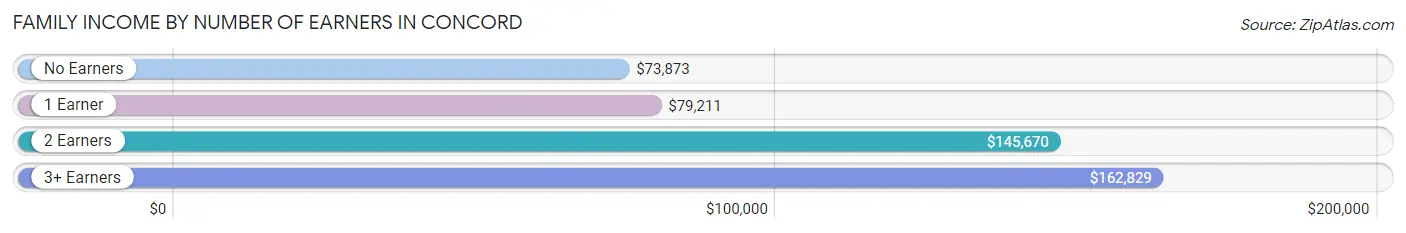
| Number of Earners | # Families | Median Income |
| No Earners | 3,086 (10.2%) | $73,873 |
| 1 Earner | 8,476 (28.1%) | $79,211 |
| 2 Earners | 14,418 (47.7%) | $145,670 |
| 3+ Earners | 4,217 (14.0%) | $162,829 |
| Total | 30,197 (100.0%) | $122,125 |
Household Income in Concord
Household Income Brackets in Concord
With 9,434 households falling in the category, the $100,000 to $149,999 income range is the most frequent in Concord, accounting for 20.7% of all households. In contrast, only 1,550 households (3.4%) fall into the $10,000 to $14,999 income bracket, making it the least populous group.
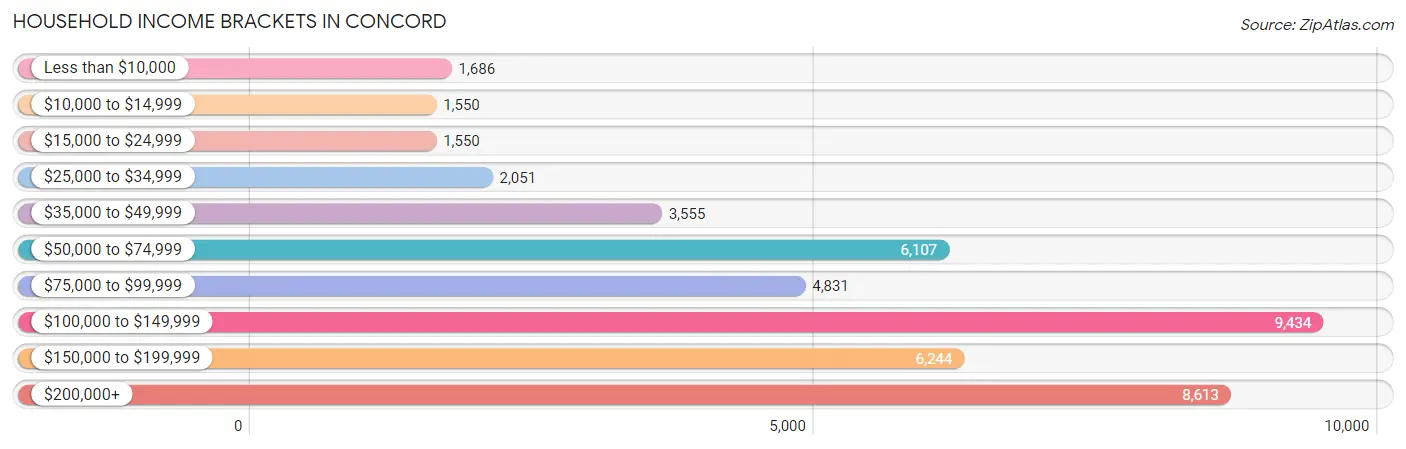
| Income Bracket | # Households | % Households |
| Less than $10,000 | 1,686 | 3.7% |
| $10,000 to $14,999 | 1,550 | 3.4% |
| $15,000 to $24,999 | 1,550 | 3.4% |
| $25,000 to $34,999 | 2,051 | 4.5% |
| $35,000 to $49,999 | 3,555 | 7.8% |
| $50,000 to $74,999 | 6,107 | 13.4% |
| $75,000 to $99,999 | 4,831 | 10.6% |
| $100,000 to $149,999 | 9,434 | 20.7% |
| $150,000 to $199,999 | 6,244 | 13.7% |
| $200,000+ | 8,613 | 18.9% |
Household Income by Householder Age in Concord
The median household income in Concord is $107,789, with the highest median household income of $121,034 found in the 45 to 64 years age bracket for the primary householder. A total of 17,012 households (37.3%) fall into this category. Meanwhile, the 15 to 24 years age bracket for the primary householder has the lowest median household income of $65,534, with 1,006 households (2.2%) in this group.
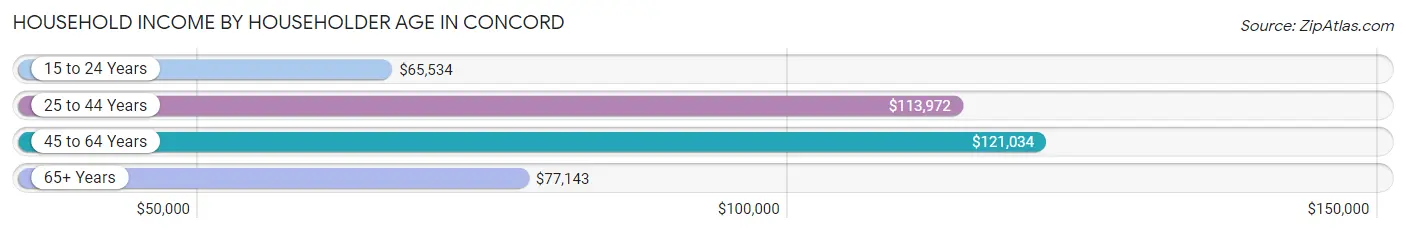
| Income Bracket | # Households | Median Income |
| 15 to 24 Years | 1,006 (2.2%) | $65,534 |
| 25 to 44 Years | 16,170 (35.5%) | $113,972 |
| 45 to 64 Years | 17,012 (37.3%) | $121,034 |
| 65+ Years | 11,386 (25.0%) | $77,143 |
| Total | 45,574 (100.0%) | $107,789 |
Poverty in Concord
Income Below Poverty by Sex and Age in Concord
With 8.7% poverty level for males and 9.7% for females among the residents of Concord, 5 year old males and 18 to 24 year old females are the most vulnerable to poverty, with 142 males (17.9%) and 664 females (15.1%) in their respective age groups living below the poverty level.
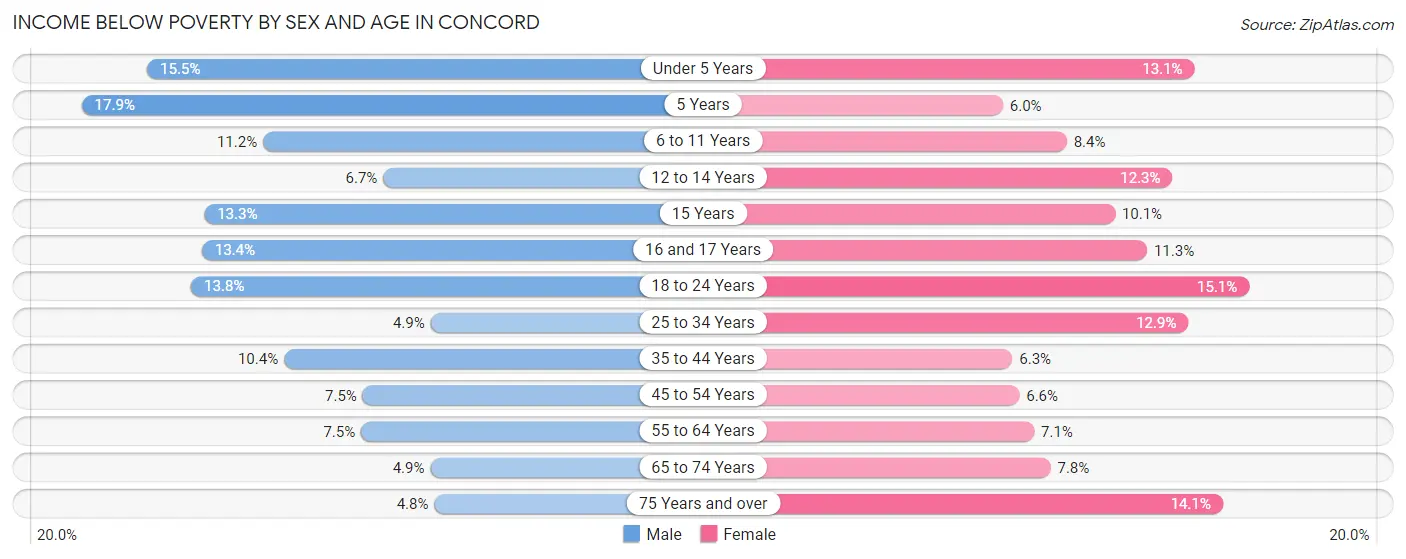
| Age Bracket | Male | Female |
| Under 5 Years | 637 (15.4%) | 526 (13.1%) |
| 5 Years | 142 (17.9%) | 47 (6.0%) |
| 6 to 11 Years | 449 (11.2%) | 326 (8.4%) |
| 12 to 14 Years | 145 (6.7%) | 188 (12.3%) |
| 15 Years | 98 (13.3%) | 45 (10.1%) |
| 16 and 17 Years | 159 (13.4%) | 171 (11.3%) |
| 18 to 24 Years | 644 (13.8%) | 664 (15.1%) |
| 25 to 34 Years | 494 (4.9%) | 1,265 (12.9%) |
| 35 to 44 Years | 1,045 (10.4%) | 529 (6.3%) |
| 45 to 54 Years | 569 (7.4%) | 490 (6.6%) |
| 55 to 64 Years | 598 (7.5%) | 645 (7.1%) |
| 65 to 74 Years | 281 (4.9%) | 494 (7.7%) |
| 75 Years and over | 135 (4.8%) | 629 (14.1%) |
| Total | 5,396 (8.7%) | 6,019 (9.7%) |
Income Above Poverty by Sex and Age in Concord
According to the poverty statistics in Concord, males aged 75 years and over and females aged 5 years are the age groups that are most secure financially, with 95.2% of males and 94.0% of females in these age groups living above the poverty line.
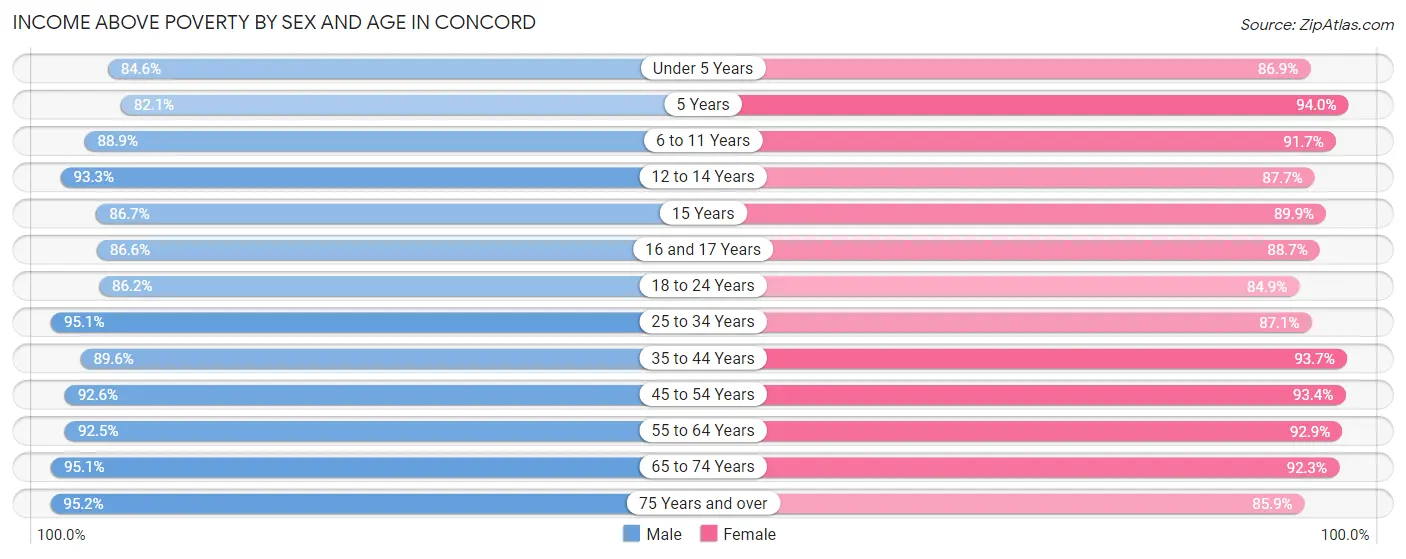
| Age Bracket | Male | Female |
| Under 5 Years | 3,487 (84.6%) | 3,491 (86.9%) |
| 5 Years | 652 (82.1%) | 739 (94.0%) |
| 6 to 11 Years | 3,579 (88.8%) | 3,580 (91.6%) |
| 12 to 14 Years | 2,024 (93.3%) | 1,344 (87.7%) |
| 15 Years | 637 (86.7%) | 399 (89.9%) |
| 16 and 17 Years | 1,026 (86.6%) | 1,338 (88.7%) |
| 18 to 24 Years | 4,017 (86.2%) | 3,727 (84.9%) |
| 25 to 34 Years | 9,520 (95.1%) | 8,574 (87.1%) |
| 35 to 44 Years | 9,032 (89.6%) | 7,834 (93.7%) |
| 45 to 54 Years | 7,069 (92.5%) | 6,945 (93.4%) |
| 55 to 64 Years | 7,362 (92.5%) | 8,383 (92.9%) |
| 65 to 74 Years | 5,411 (95.1%) | 5,877 (92.2%) |
| 75 Years and over | 2,685 (95.2%) | 3,820 (85.9%) |
| Total | 56,501 (91.3%) | 56,051 (90.3%) |
Income Below Poverty Among Married-Couple Families in Concord
The poverty statistics for married-couple families in Concord show that 4.2% or 948 of the total 22,671 families live below the poverty line. Families with 3 or 4 children have the highest poverty rate of 15.9%, comprising of 259 families. On the other hand, families with no children have the lowest poverty rate of 3.1%, which includes 383 families.
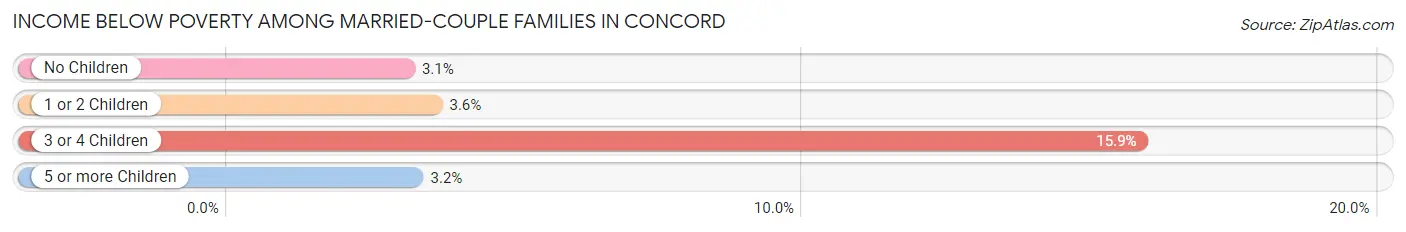
| Children | Above Poverty | Below Poverty |
| No Children | 12,047 (96.9%) | 383 (3.1%) |
| 1 or 2 Children | 8,241 (96.4%) | 304 (3.6%) |
| 3 or 4 Children | 1,375 (84.2%) | 259 (15.9%) |
| 5 or more Children | 60 (96.8%) | 2 (3.2%) |
| Total | 21,723 (95.8%) | 948 (4.2%) |
Income Below Poverty Among Single-Parent Households in Concord
According to the poverty data in Concord, 6.7% or 141 single-father households and 13.7% or 740 single-mother households are living below the poverty line. Among single-father households, those with 1 or 2 children have the highest poverty rate, with 141 households (15.4%) experiencing poverty. Likewise, among single-mother households, those with 5 or more children have the highest poverty rate, with 22 households (100.0%) falling below the poverty line.
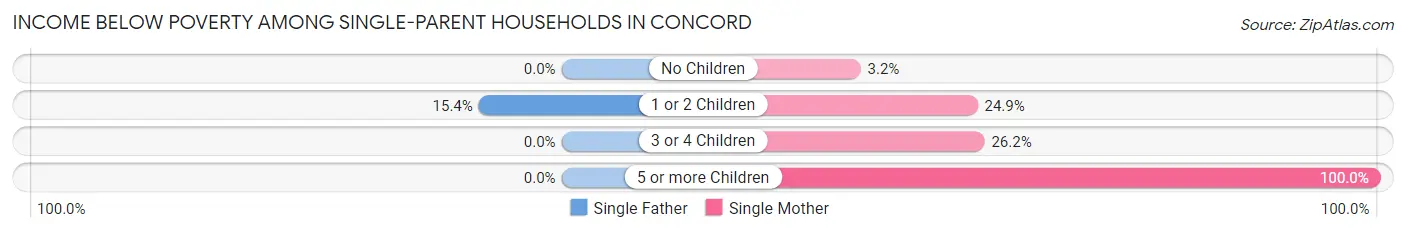
| Children | Single Father | Single Mother |
| No Children | 0 (0.0%) | 91 (3.2%) |
| 1 or 2 Children | 141 (15.4%) | 515 (24.9%) |
| 3 or 4 Children | 0 (0.0%) | 112 (26.2%) |
| 5 or more Children | 0 (0.0%) | 22 (100.0%) |
| Total | 141 (6.7%) | 740 (13.7%) |
Income Below Poverty Among Married-Couple vs Single-Parent Households in Concord
The poverty data for Concord shows that 948 of the married-couple family households (4.2%) and 881 of the single-parent households (11.7%) are living below the poverty level. Within the married-couple family households, those with 3 or 4 children have the highest poverty rate, with 259 households (15.9%) falling below the poverty line. Among the single-parent households, those with 5 or more children have the highest poverty rate, with 22 household (100.0%) living below poverty.
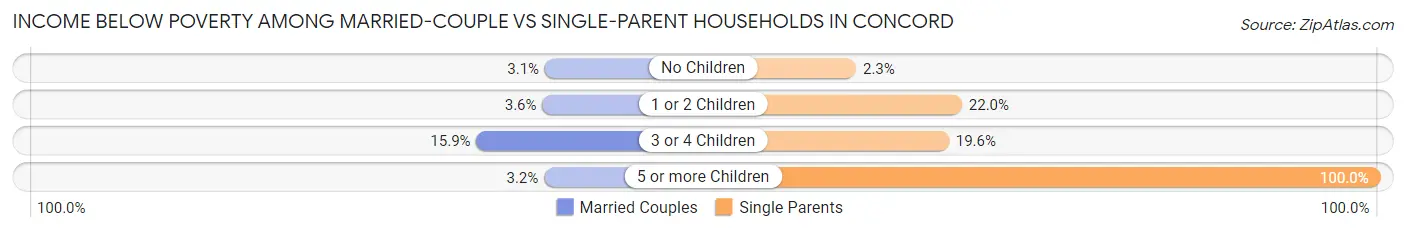
| Children | Married-Couple Families | Single-Parent Households |
| No Children | 383 (3.1%) | 91 (2.3%) |
| 1 or 2 Children | 304 (3.6%) | 656 (22.0%) |
| 3 or 4 Children | 259 (15.9%) | 112 (19.6%) |
| 5 or more Children | 2 (3.2%) | 22 (100.0%) |
| Total | 948 (4.2%) | 881 (11.7%) |
Race in Concord
The most populous races in Concord are White / Caucasian (64,215 | 51.4%), Hispanic or Latino (39,009 | 31.2%), and Two or more Races (20,066 | 16.1%).
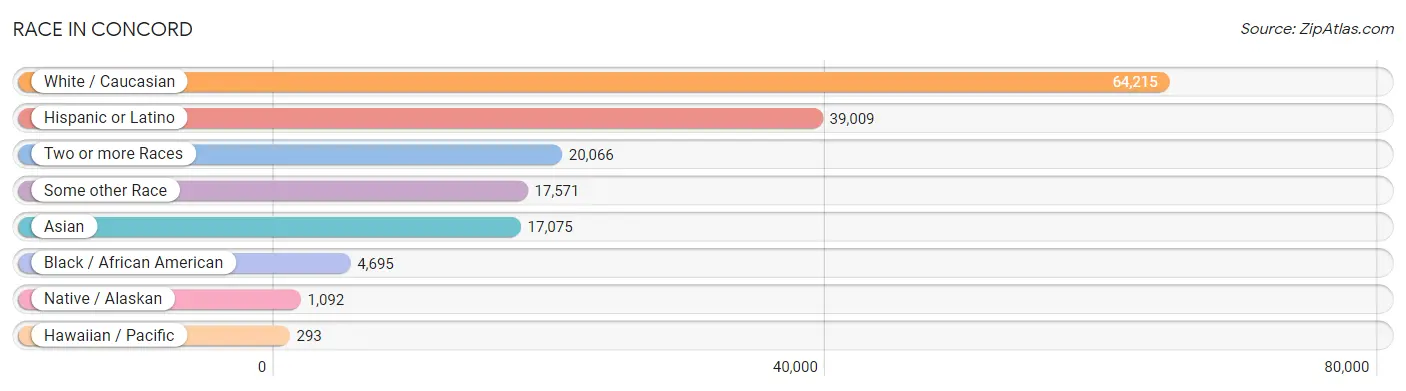
| Race | # Population | % Population |
| Asian | 17,075 | 13.7% |
| Black / African American | 4,695 | 3.8% |
| Hawaiian / Pacific | 293 | 0.2% |
| Hispanic or Latino | 39,009 | 31.2% |
| Native / Alaskan | 1,092 | 0.9% |
| White / Caucasian | 64,215 | 51.4% |
| Two or more Races | 20,066 | 16.1% |
| Some other Race | 17,571 | 14.1% |
| Total | 125,007 | 100.0% |
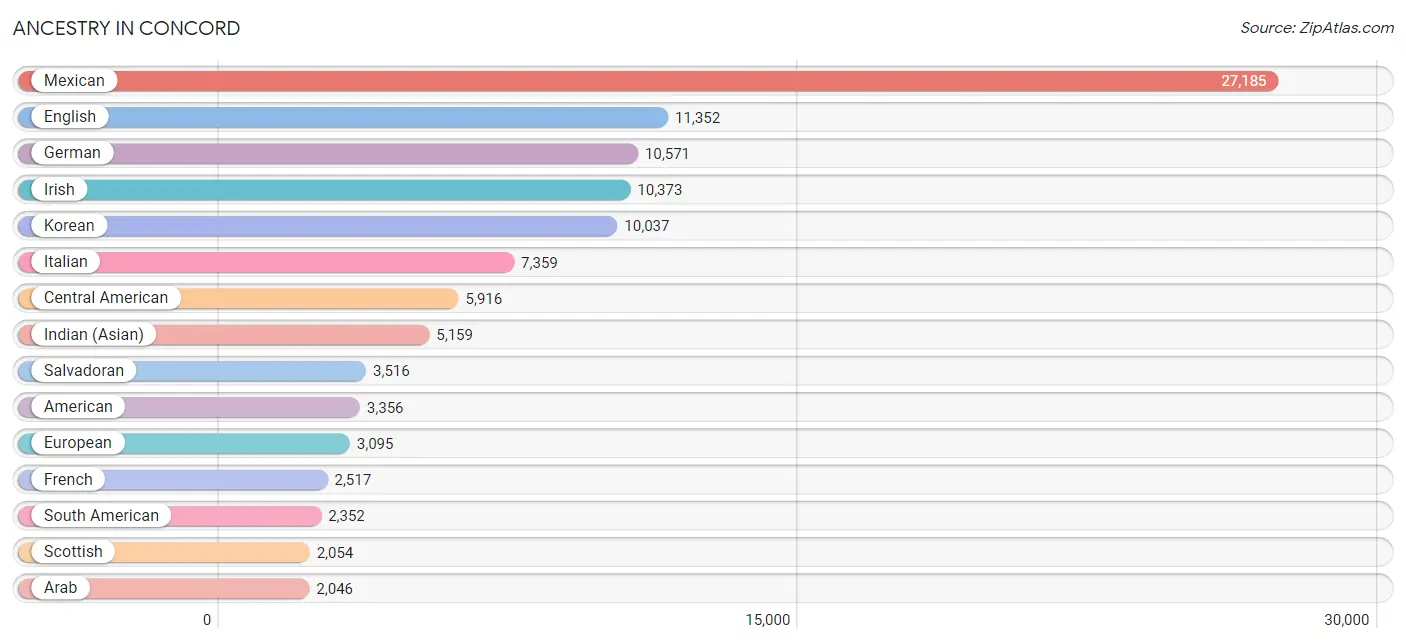
Ancestry in Concord
The most populous ancestries reported in Concord are Mexican (27,185 | 21.7%), English (11,352 | 9.1%), German (10,571 | 8.5%), Irish (10,373 | 8.3%), and Korean (10,037 | 8.0%), together accounting for 55.6% of all Concord residents.
| Ancestry | # Population | % Population |
| Afghan | 1,715 | 1.4% |
| African | 522 | 0.4% |
| Albanian | 1 | 0.0% |
| Alsatian | 7 | 0.0% |
| American | 3,356 | 2.7% |
| Apache | 205 | 0.2% |
| Arab | 2,046 | 1.6% |
| Argentinean | 171 | 0.1% |
| Armenian | 150 | 0.1% |
| Australian | 197 | 0.2% |
| Austrian | 199 | 0.2% |
| Bangladeshi | 25 | 0.0% |
| Barbadian | 58 | 0.1% |
| Basque | 43 | 0.0% |
| Belgian | 108 | 0.1% |
| Belizean | 75 | 0.1% |
| Bhutanese | 1,531 | 1.2% |
| Blackfeet | 396 | 0.3% |
| Brazilian | 163 | 0.1% |
| British | 1,015 | 0.8% |
| Bulgarian | 149 | 0.1% |
| Burmese | 843 | 0.7% |
| Canadian | 250 | 0.2% |
| Central American | 5,916 | 4.7% |
| Central American Indian | 301 | 0.2% |
| Cherokee | 591 | 0.5% |
| Chickasaw | 48 | 0.0% |
| Chilean | 178 | 0.1% |
| Chippewa | 4 | 0.0% |
| Choctaw | 119 | 0.1% |
| Colombian | 671 | 0.5% |
| Costa Rican | 19 | 0.0% |
| Cree | 10 | 0.0% |
| Croatian | 141 | 0.1% |
| Cuban | 215 | 0.2% |
| Cypriot | 16 | 0.0% |
| Czech | 346 | 0.3% |
| Czechoslovakian | 76 | 0.1% |
| Danish | 878 | 0.7% |
| Delaware | 8 | 0.0% |
| Dominican | 27 | 0.0% |
| Dutch | 840 | 0.7% |
| Eastern European | 310 | 0.3% |
| Ecuadorian | 50 | 0.0% |
| Egyptian | 408 | 0.3% |
| English | 11,352 | 9.1% |
| Ethiopian | 158 | 0.1% |
| European | 3,095 | 2.5% |
| Fijian | 2 | 0.0% |
| Filipino | 208 | 0.2% |
| Finnish | 297 | 0.2% |
| French | 2,517 | 2.0% |
| French Canadian | 305 | 0.2% |
| German | 10,571 | 8.5% |
| Ghanaian | 191 | 0.2% |
| Greek | 266 | 0.2% |
| Guamanian / Chamorro | 50 | 0.0% |
| Guatemalan | 1,417 | 1.1% |
| Honduran | 41 | 0.0% |
| Houma | 20 | 0.0% |
| Hungarian | 371 | 0.3% |
| Icelander | 13 | 0.0% |
| Indian (Asian) | 5,159 | 4.1% |
| Indonesian | 101 | 0.1% |
| Inupiat | 26 | 0.0% |
| Iranian | 355 | 0.3% |
| Irish | 10,373 | 8.3% |
| Iroquois | 36 | 0.0% |
| Israeli | 103 | 0.1% |
| Italian | 7,359 | 5.9% |
| Jamaican | 671 | 0.5% |
| Japanese | 71 | 0.1% |
| Jordanian | 158 | 0.1% |
| Kenyan | 41 | 0.0% |
| Korean | 10,037 | 8.0% |
| Laotian | 181 | 0.1% |
| Latvian | 98 | 0.1% |
| Lebanese | 167 | 0.1% |
| Lithuanian | 132 | 0.1% |
| Malaysian | 28 | 0.0% |
| Maltese | 31 | 0.0% |
| Mexican | 27,185 | 21.7% |
| Mexican American Indian | 400 | 0.3% |
| Moroccan | 46 | 0.0% |
| Native Hawaiian | 283 | 0.2% |
| Nepalese | 16 | 0.0% |
| Nicaraguan | 917 | 0.7% |
| Nigerian | 142 | 0.1% |
| Northern European | 155 | 0.1% |
| Norwegian | 1,539 | 1.2% |
| Paiute | 4 | 0.0% |
| Pakistani | 483 | 0.4% |
| Palestinian | 218 | 0.2% |
| Panamanian | 6 | 0.0% |
| Pennsylvania German | 40 | 0.0% |
| Peruvian | 880 | 0.7% |
| Polish | 1,815 | 1.5% |
| Portuguese | 1,645 | 1.3% |
| Pueblo | 13 | 0.0% |
| Puerto Rican | 1,323 | 1.1% |
| Romanian | 188 | 0.2% |
| Russian | 1,221 | 1.0% |
| Salvadoran | 3,516 | 2.8% |
| Samoan | 148 | 0.1% |
| Scandinavian | 237 | 0.2% |
| Scotch-Irish | 947 | 0.8% |
| Scottish | 2,054 | 1.6% |
| Seminole | 35 | 0.0% |
| Serbian | 17 | 0.0% |
| Sioux | 130 | 0.1% |
| Slavic | 219 | 0.2% |
| Slovak | 26 | 0.0% |
| Slovene | 37 | 0.0% |
| South African | 38 | 0.0% |
| South American | 2,352 | 1.9% |
| South American Indian | 136 | 0.1% |
| Spaniard | 561 | 0.4% |
| Spanish | 594 | 0.5% |
| Sri Lankan | 1,071 | 0.9% |
| Subsaharan African | 1,227 | 1.0% |
| Swedish | 1,888 | 1.5% |
| Swiss | 331 | 0.3% |
| Syrian | 72 | 0.1% |
| Thai | 1,746 | 1.4% |
| Tongan | 125 | 0.1% |
| Trinidadian and Tobagonian | 21 | 0.0% |
| Turkish | 81 | 0.1% |
| Ukrainian | 529 | 0.4% |
| Uruguayan | 8 | 0.0% |
| Venezuelan | 394 | 0.3% |
| Welsh | 561 | 0.4% |
| West Indian | 70 | 0.1% |
| Yaqui | 358 | 0.3% |
| Yugoslavian | 64 | 0.1% | View All 134 Rows |
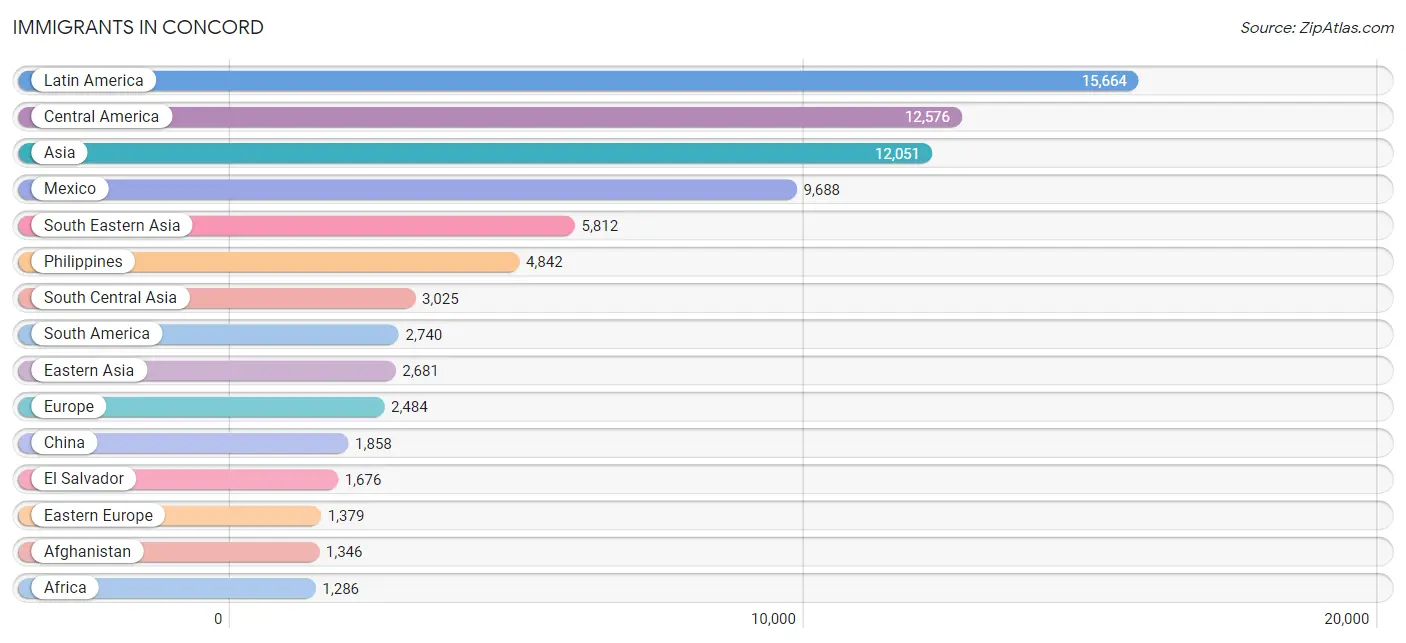
Immigrants in Concord
The most numerous immigrant groups reported in Concord came from Latin America (15,664 | 12.5%), Central America (12,576 | 10.1%), Asia (12,051 | 9.6%), Mexico (9,688 | 7.7%), and South Eastern Asia (5,812 | 4.6%), together accounting for 44.6% of all Concord residents.
| Immigration Origin | # Population | % Population |
| Afghanistan | 1,346 | 1.1% |
| Africa | 1,286 | 1.0% |
| Argentina | 136 | 0.1% |
| Armenia | 30 | 0.0% |
| Asia | 12,051 | 9.6% |
| Australia | 113 | 0.1% |
| Austria | 7 | 0.0% |
| Barbados | 70 | 0.1% |
| Belarus | 48 | 0.0% |
| Belgium | 35 | 0.0% |
| Belize | 19 | 0.0% |
| Bolivia | 80 | 0.1% |
| Bosnia and Herzegovina | 16 | 0.0% |
| Brazil | 370 | 0.3% |
| Bulgaria | 116 | 0.1% |
| Cambodia | 9 | 0.0% |
| Cameroon | 13 | 0.0% |
| Canada | 319 | 0.3% |
| Caribbean | 348 | 0.3% |
| Central America | 12,576 | 10.1% |
| Chile | 320 | 0.3% |
| China | 1,858 | 1.5% |
| Colombia | 585 | 0.5% |
| Costa Rica | 10 | 0.0% |
| Croatia | 32 | 0.0% |
| Cuba | 63 | 0.1% |
| Czechoslovakia | 64 | 0.1% |
| Denmark | 46 | 0.0% |
| Eastern Africa | 182 | 0.2% |
| Eastern Asia | 2,681 | 2.1% |
| Eastern Europe | 1,379 | 1.1% |
| Ecuador | 63 | 0.1% |
| Egypt | 229 | 0.2% |
| El Salvador | 1,676 | 1.3% |
| England | 156 | 0.1% |
| Eritrea | 22 | 0.0% |
| Ethiopia | 117 | 0.1% |
| Europe | 2,484 | 2.0% |
| Fiji | 53 | 0.0% |
| France | 119 | 0.1% |
| Germany | 206 | 0.2% |
| Ghana | 97 | 0.1% |
| Greece | 36 | 0.0% |
| Guatemala | 592 | 0.5% |
| Guyana | 3 | 0.0% |
| Honduras | 25 | 0.0% |
| Hong Kong | 347 | 0.3% |
| Hungary | 105 | 0.1% |
| India | 947 | 0.8% |
| Indonesia | 50 | 0.0% |
| Iran | 352 | 0.3% |
| Iraq | 12 | 0.0% |
| Ireland | 32 | 0.0% |
| Israel | 16 | 0.0% |
| Italy | 69 | 0.1% |
| Jamaica | 215 | 0.2% |
| Japan | 355 | 0.3% |
| Jordan | 147 | 0.1% |
| Kazakhstan | 103 | 0.1% |
| Kenya | 41 | 0.0% |
| Korea | 468 | 0.4% |
| Kuwait | 62 | 0.1% |
| Laos | 16 | 0.0% |
| Latin America | 15,664 | 12.5% |
| Latvia | 68 | 0.1% |
| Lebanon | 79 | 0.1% |
| Malaysia | 20 | 0.0% |
| Mexico | 9,688 | 7.7% |
| Middle Africa | 38 | 0.0% |
| Moldova | 64 | 0.1% |
| Morocco | 29 | 0.0% |
| Nepal | 117 | 0.1% |
| Nicaragua | 560 | 0.4% |
| Nigeria | 10 | 0.0% |
| Northern Africa | 896 | 0.7% |
| Northern Europe | 405 | 0.3% |
| Oceania | 169 | 0.1% |
| Pakistan | 100 | 0.1% |
| Panama | 6 | 0.0% |
| Peru | 631 | 0.5% |
| Philippines | 4,842 | 3.9% |
| Poland | 68 | 0.1% |
| Portugal | 46 | 0.0% |
| Romania | 125 | 0.1% |
| Russia | 136 | 0.1% |
| Scotland | 23 | 0.0% |
| Singapore | 19 | 0.0% |
| South Africa | 63 | 0.1% |
| South America | 2,740 | 2.2% |
| South Central Asia | 3,025 | 2.4% |
| South Eastern Asia | 5,812 | 4.6% |
| Southern Europe | 264 | 0.2% |
| Spain | 86 | 0.1% |
| Sudan | 1 | 0.0% |
| Switzerland | 69 | 0.1% |
| Syria | 15 | 0.0% |
| Taiwan | 358 | 0.3% |
| Thailand | 230 | 0.2% |
| Turkey | 45 | 0.0% |
| Uganda | 2 | 0.0% |
| Ukraine | 514 | 0.4% |
| Uruguay | 8 | 0.0% |
| Uzbekistan | 60 | 0.1% |
| Venezuela | 380 | 0.3% |
| Vietnam | 583 | 0.5% |
| Western Africa | 107 | 0.1% |
| Western Asia | 431 | 0.3% |
| Western Europe | 436 | 0.4% | View All 108 Rows |
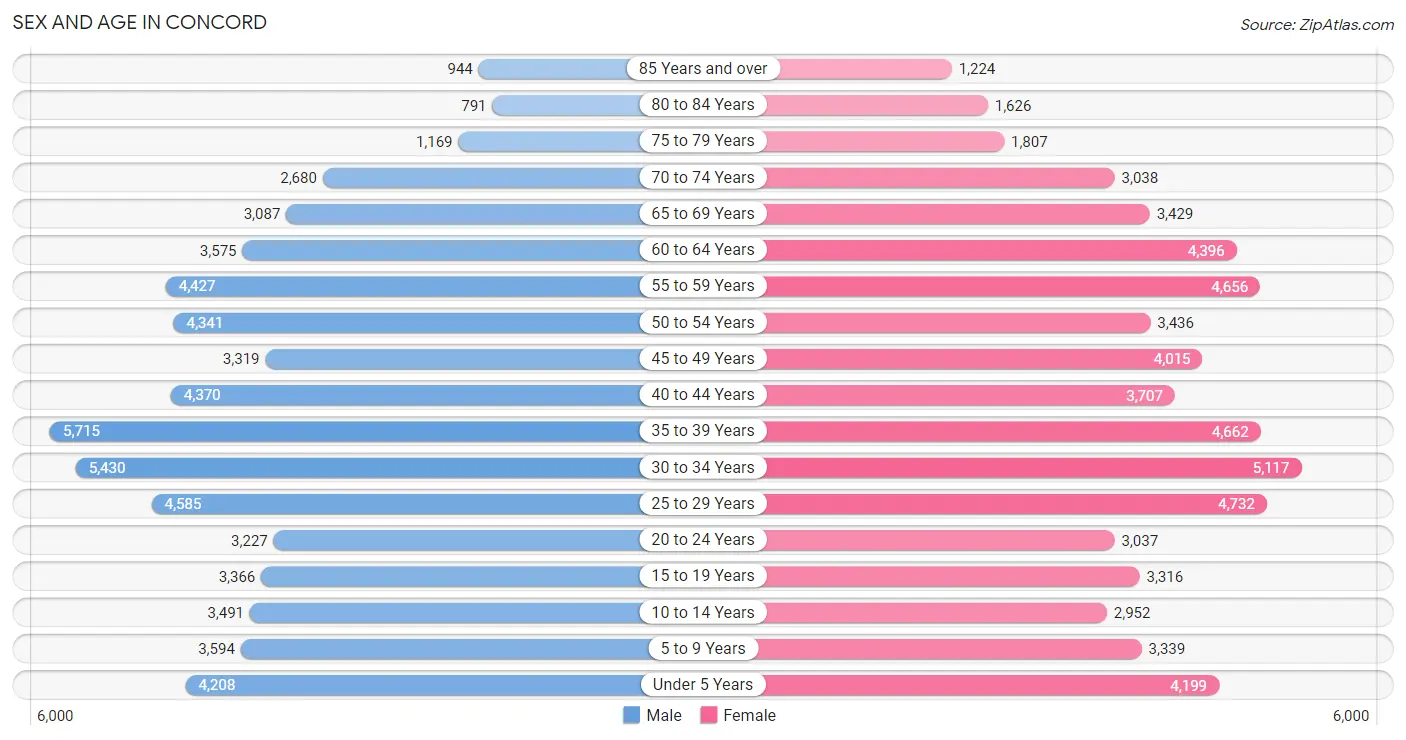
Sex and Age in Concord
Sex and Age in Concord
The most populous age groups in Concord are 35 to 39 Years (5,715 | 9.2%) for men and 30 to 34 Years (5,117 | 8.2%) for women.
| Age Bracket | Male | Female |
| Under 5 Years | 4,208 (6.8%) | 4,199 (6.7%) |
| 5 to 9 Years | 3,594 (5.8%) | 3,339 (5.3%) |
| 10 to 14 Years | 3,491 (5.6%) | 2,952 (4.7%) |
| 15 to 19 Years | 3,366 (5.4%) | 3,316 (5.3%) |
| 20 to 24 Years | 3,227 (5.2%) | 3,037 (4.8%) |
| 25 to 29 Years | 4,585 (7.4%) | 4,732 (7.5%) |
| 30 to 34 Years | 5,430 (8.7%) | 5,117 (8.2%) |
| 35 to 39 Years | 5,715 (9.2%) | 4,662 (7.4%) |
| 40 to 44 Years | 4,370 (7.0%) | 3,707 (5.9%) |
| 45 to 49 Years | 3,319 (5.3%) | 4,015 (6.4%) |
| 50 to 54 Years | 4,341 (7.0%) | 3,436 (5.5%) |
| 55 to 59 Years | 4,427 (7.1%) | 4,656 (7.4%) |
| 60 to 64 Years | 3,575 (5.7%) | 4,396 (7.0%) |
| 65 to 69 Years | 3,087 (5.0%) | 3,429 (5.5%) |
| 70 to 74 Years | 2,680 (4.3%) | 3,038 (4.9%) |
| 75 to 79 Years | 1,169 (1.9%) | 1,807 (2.9%) |
| 80 to 84 Years | 791 (1.3%) | 1,626 (2.6%) |
| 85 Years and over | 944 (1.5%) | 1,224 (1.9%) |
| Total | 62,319 (100.0%) | 62,688 (100.0%) |
Families and Households in Concord
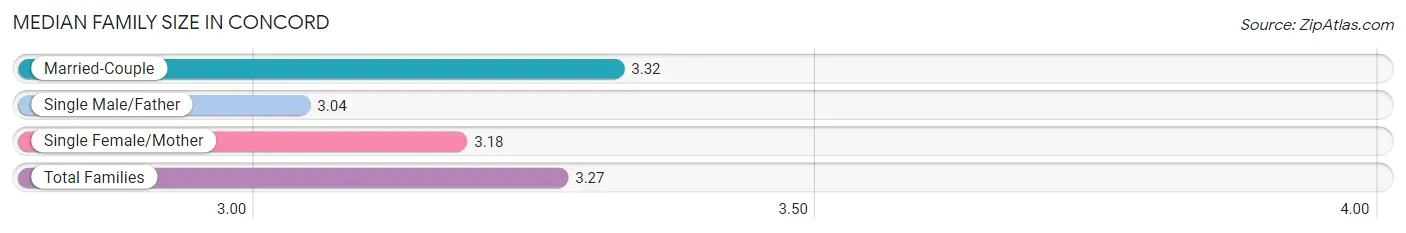
Median Family Size in Concord
The median family size in Concord is 3.27 persons per family, with married-couple families (22,671 | 75.1%) accounting for the largest median family size of 3.32 persons per family. On the other hand, single male/father families (2,120 | 7.0%) represent the smallest median family size with 3.04 persons per family.
| Family Type | # Families | Family Size |
| Married-Couple | 22,671 (75.1%) | 3.32 |
| Single Male/Father | 2,120 (7.0%) | 3.04 |
| Single Female/Mother | 5,406 (17.9%) | 3.18 |
| Total Families | 30,197 (100.0%) | 3.27 |
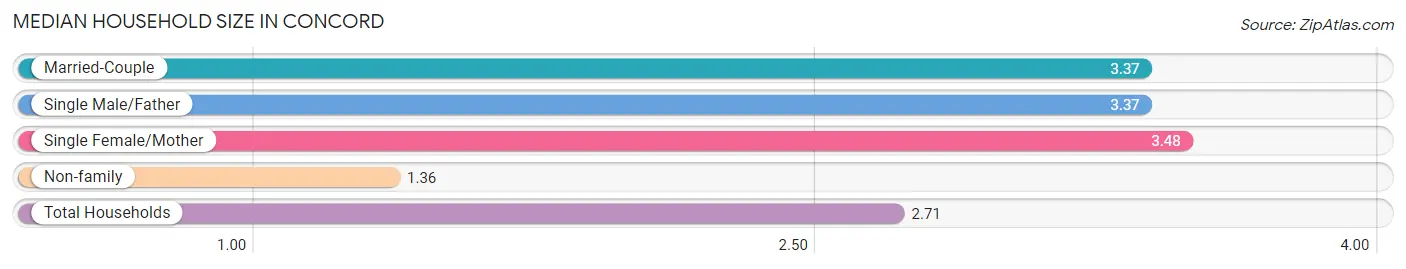
Median Household Size in Concord
The median household size in Concord is 2.71 persons per household, with single female/mother households (5,406 | 11.9%) accounting for the largest median household size of 3.48 persons per household. non-family households (15,377 | 33.7%) represent the smallest median household size with 1.36 persons per household.
| Household Type | # Households | Household Size |
| Married-Couple | 22,671 (49.7%) | 3.37 |
| Single Male/Father | 2,120 (4.6%) | 3.37 |
| Single Female/Mother | 5,406 (11.9%) | 3.48 |
| Non-family | 15,377 (33.7%) | 1.36 |
| Total Households | 45,574 (100.0%) | 2.71 |
Household Size by Marriage Status in Concord
Out of a total of 45,574 households in Concord, 30,197 (66.3%) are family households, while 15,377 (33.7%) are nonfamily households. The most numerous type of family households are 2-person households, comprising 11,456, and the most common type of nonfamily households are 1-person households, comprising 11,318.
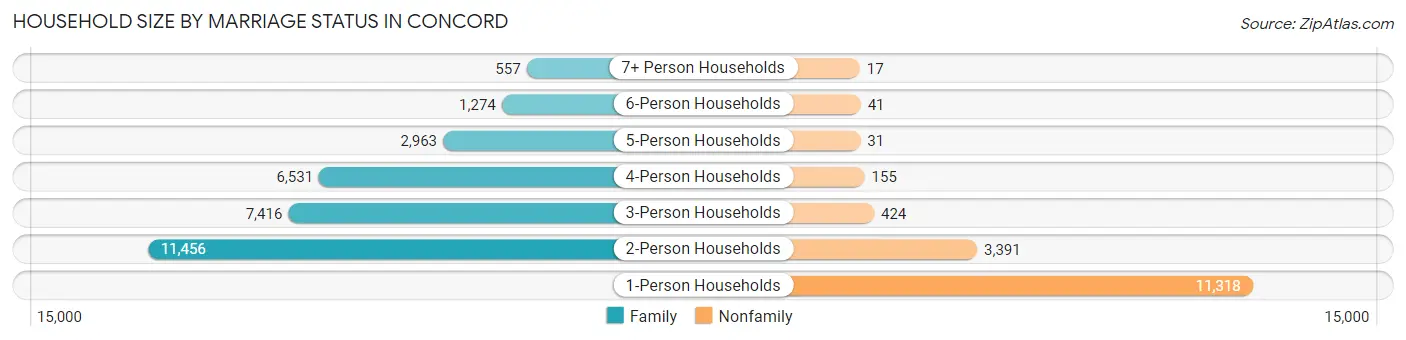
| Household Size | Family Households | Nonfamily Households |
| 1-Person Households | - | 11,318 (24.8%) |
| 2-Person Households | 11,456 (25.1%) | 3,391 (7.4%) |
| 3-Person Households | 7,416 (16.3%) | 424 (0.9%) |
| 4-Person Households | 6,531 (14.3%) | 155 (0.3%) |
| 5-Person Households | 2,963 (6.5%) | 31 (0.1%) |
| 6-Person Households | 1,274 (2.8%) | 41 (0.1%) |
| 7+ Person Households | 557 (1.2%) | 17 (0.0%) |
| Total | 30,197 (66.3%) | 15,377 (33.7%) |
Female Fertility in Concord
Fertility by Age in Concord
Average fertility rate in Concord is 68.0 births per 1,000 women. Women in the age bracket of 20 to 34 years have the highest fertility rate with 97.0 births per 1,000 women. Women in the age bracket of 20 to 34 years acount for 62.4% of all women with births.
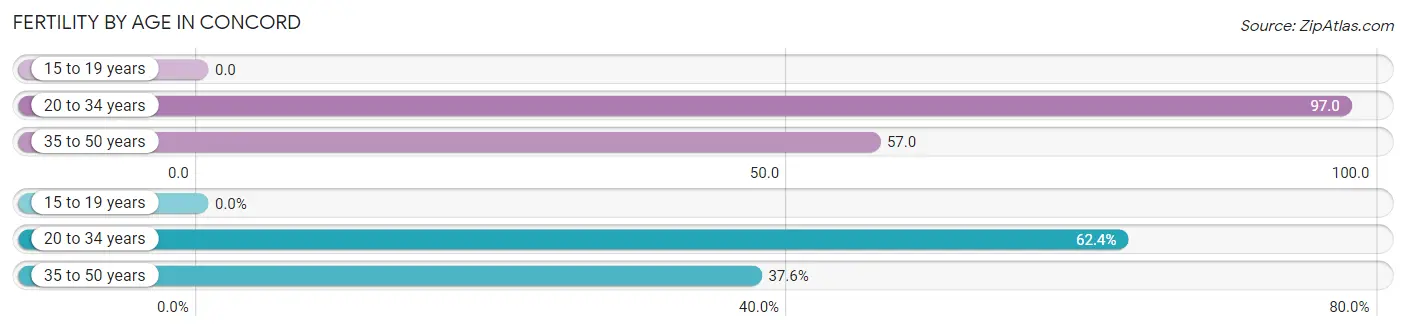
| Age Bracket | Women with Births | Births / 1,000 Women |
| 15 to 19 years | 0 (0.0%) | 0.0 |
| 20 to 34 years | 1,247 (62.4%) | 97.0 |
| 35 to 50 years | 750 (37.6%) | 57.0 |
| Total | 1,997 (100.0%) | 68.0 |
Fertility by Age by Marriage Status in Concord
73.7% of women with births (1,997) in Concord are married. The highest percentage of unmarried women with births falls into 20 to 34 years age bracket with 32.6% of them unmarried at the time of birth, while the lowest percentage of unmarried women with births belong to 35 to 50 years age bracket with 15.9% of them unmarried.
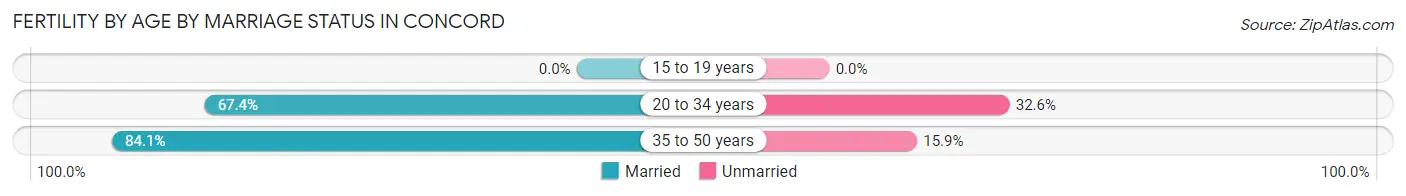
| Age Bracket | Married | Unmarried |
| 15 to 19 years | 0 (0.0%) | 0 (0.0%) |
| 20 to 34 years | 840 (67.4%) | 407 (32.6%) |
| 35 to 50 years | 631 (84.1%) | 119 (15.9%) |
| Total | 1,472 (73.7%) | 525 (26.3%) |
Fertility by Education in Concord
Average fertility rate in Concord is 68.0 births per 1,000 women. Women with the education attainment of bachelor's degree have the highest fertility rate of 113.0 births per 1,000 women, while women with the education attainment of less than high school have the lowest fertility at 11.0 births per 1,000 women. Women with the education attainment of bachelor's degree represent 45.6% of all women with births.
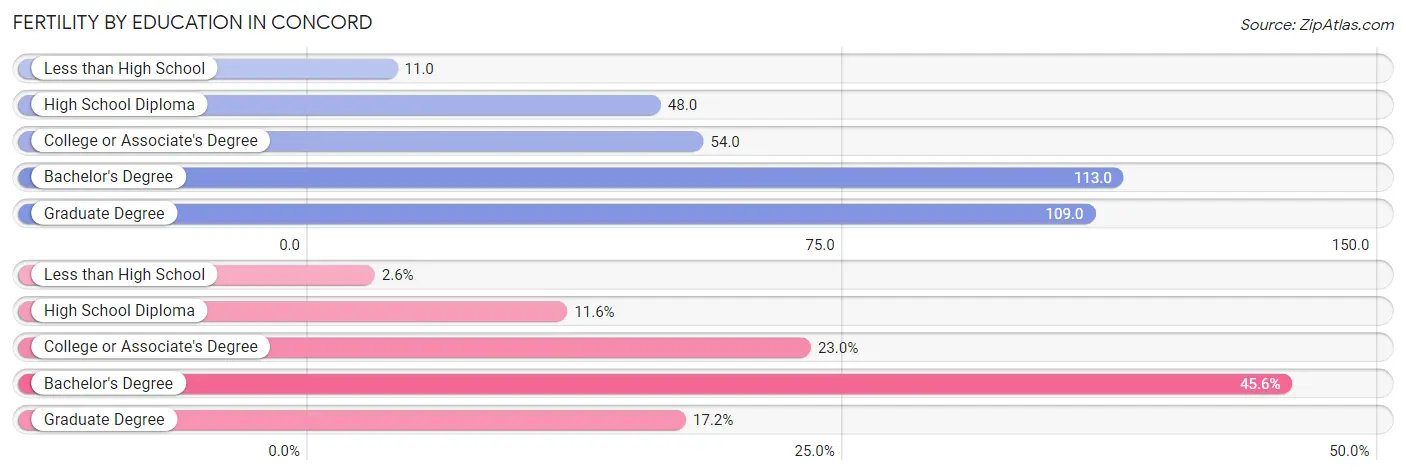
| Educational Attainment | Women with Births | Births / 1,000 Women |
| Less than High School | 52 (2.6%) | 11.0 |
| High School Diploma | 232 (11.6%) | 48.0 |
| College or Associate's Degree | 460 (23.0%) | 54.0 |
| Bachelor's Degree | 910 (45.6%) | 113.0 |
| Graduate Degree | 343 (17.2%) | 109.0 |
| Total | 1,997 (100.0%) | 68.0 |
Fertility by Education by Marriage Status in Concord
26.3% of women with births in Concord are unmarried. Women with the educational attainment of graduate degree are most likely to be married with 92.7% of them married at childbirth, while women with the educational attainment of less than high school are least likely to be married with 46.2% of them unmarried at childbirth.
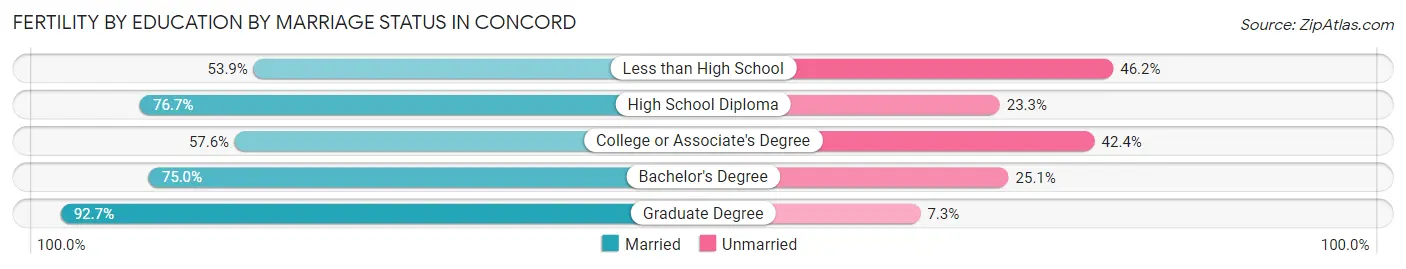
| Educational Attainment | Married | Unmarried |
| Less than High School | 28 (53.8%) | 24 (46.2%) |
| High School Diploma | 178 (76.7%) | 54 (23.3%) |
| College or Associate's Degree | 265 (57.6%) | 195 (42.4%) |
| Bachelor's Degree | 682 (75.0%) | 228 (25.1%) |
| Graduate Degree | 318 (92.7%) | 25 (7.3%) |
| Total | 1,472 (73.7%) | 525 (26.3%) |
Employment Characteristics in Concord
Employment by Class of Employer in Concord
Among the 62,980 employed individuals in Concord, private company employees (41,656 | 66.1%), not-for-profit organizations (5,335 | 8.5%), and local government employees (5,204 | 8.3%) make up the most common classes of employment.
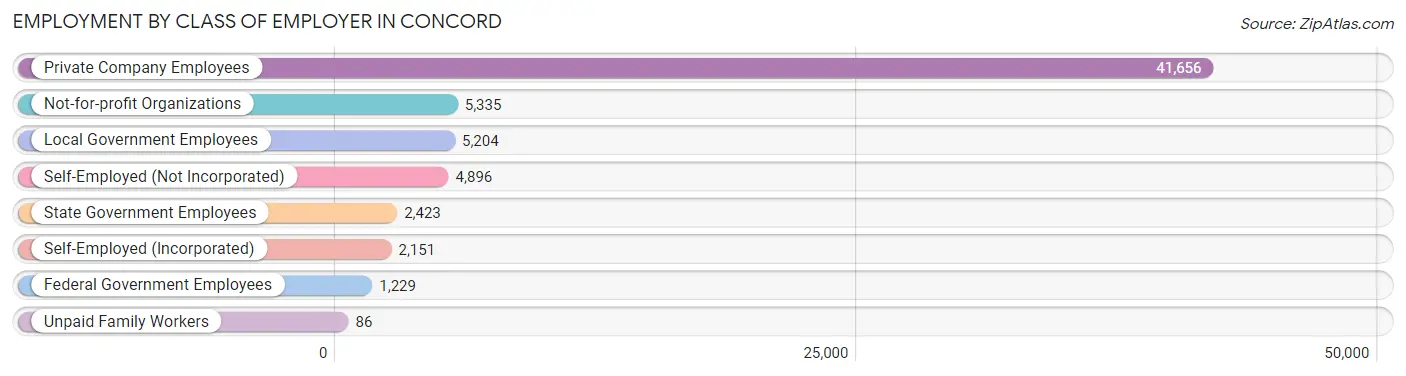
| Employer Class | # Employees | % Employees |
| Private Company Employees | 41,656 | 66.1% |
| Self-Employed (Incorporated) | 2,151 | 3.4% |
| Self-Employed (Not Incorporated) | 4,896 | 7.8% |
| Not-for-profit Organizations | 5,335 | 8.5% |
| Local Government Employees | 5,204 | 8.3% |
| State Government Employees | 2,423 | 3.8% |
| Federal Government Employees | 1,229 | 1.9% |
| Unpaid Family Workers | 86 | 0.1% |
| Total | 62,980 | 100.0% |
Employment Status by Age in Concord
According to the labor force statistics for Concord, out of the total population over 16 years of age (102,045), 67.1% or 68,472 individuals are in the labor force, with 4.9% or 3,355 of them unemployed. The age group with the highest labor force participation rate is 45 to 54 years, with 85.9% or 12,980 individuals in the labor force. Within the labor force, the 75 years and over age range has the highest percentage of unemployed individuals, with 16.0% or 54 of them being unemployed.
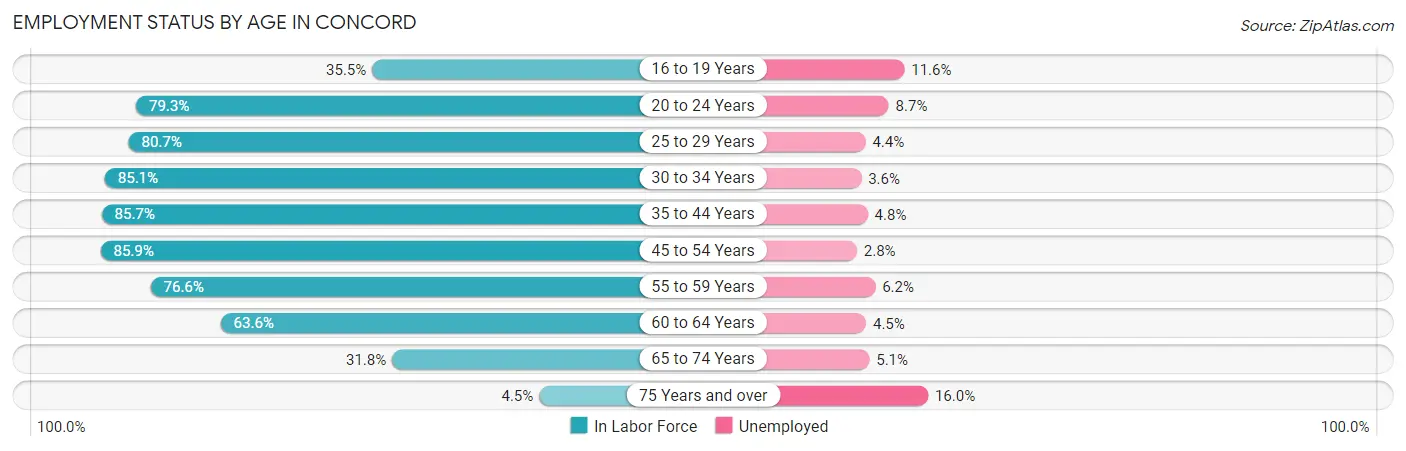
| Age Bracket | In Labor Force | Unemployed |
| 16 to 19 Years | 1,954 (35.5%) | 227 (11.6%) |
| 20 to 24 Years | 4,967 (79.3%) | 432 (8.7%) |
| 25 to 29 Years | 7,519 (80.7%) | 331 (4.4%) |
| 30 to 34 Years | 8,975 (85.1%) | 323 (3.6%) |
| 35 to 44 Years | 15,815 (85.7%) | 759 (4.8%) |
| 45 to 54 Years | 12,980 (85.9%) | 363 (2.8%) |
| 55 to 59 Years | 6,958 (76.6%) | 431 (6.2%) |
| 60 to 64 Years | 5,070 (63.6%) | 228 (4.5%) |
| 65 to 74 Years | 3,890 (31.8%) | 198 (5.1%) |
| 75 Years and over | 340 (4.5%) | 54 (16.0%) |
| Total | 68,472 (67.1%) | 3,355 (4.9%) |
Employment Status by Educational Attainment in Concord
According to labor force statistics for Concord, 81.3% of individuals (57,303) out of the total population between 25 and 64 years of age (70,483) are in the labor force, with 4.3% or 2,464 of them being unemployed. The group with the highest labor force participation rate are those with the educational attainment of bachelor's degree or higher, with 87.7% or 23,299 individuals in the labor force. Within the labor force, individuals with college / associate degree education have the highest percentage of unemployment, with 5.8% or 1,073 of them being unemployed.
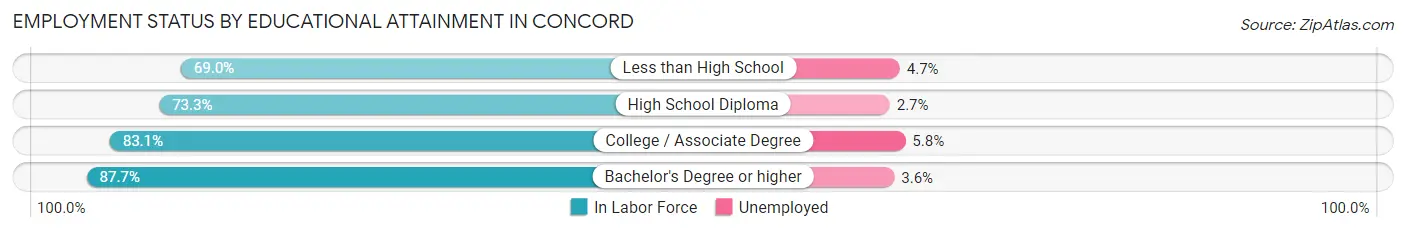
| Educational Attainment | In Labor Force | Unemployed |
| Less than High School | 5,644 (69.0%) | 384 (4.7%) |
| High School Diploma | 9,870 (73.3%) | 364 (2.7%) |
| College / Associate Degree | 18,508 (83.1%) | 1,292 (5.8%) |
| Bachelor's Degree or higher | 23,299 (87.7%) | 956 (3.6%) |
| Total | 57,303 (81.3%) | 3,031 (4.3%) |
Employment Occupations by Sex in Concord
Management, Business, Science and Arts Occupations
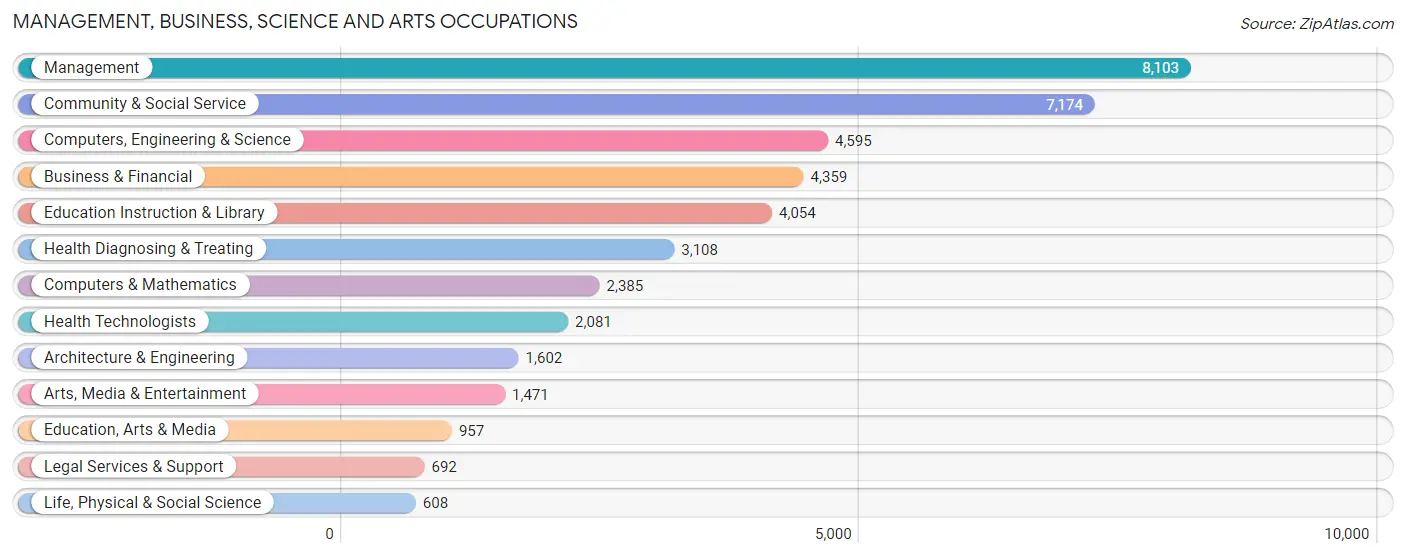
The most common Management, Business, Science and Arts occupations in Concord are Management (8,103 | 12.5%), Community & Social Service (7,174 | 11.0%), Computers, Engineering & Science (4,595 | 7.1%), Business & Financial (4,359 | 6.7%), and Education Instruction & Library (4,054 | 6.2%).
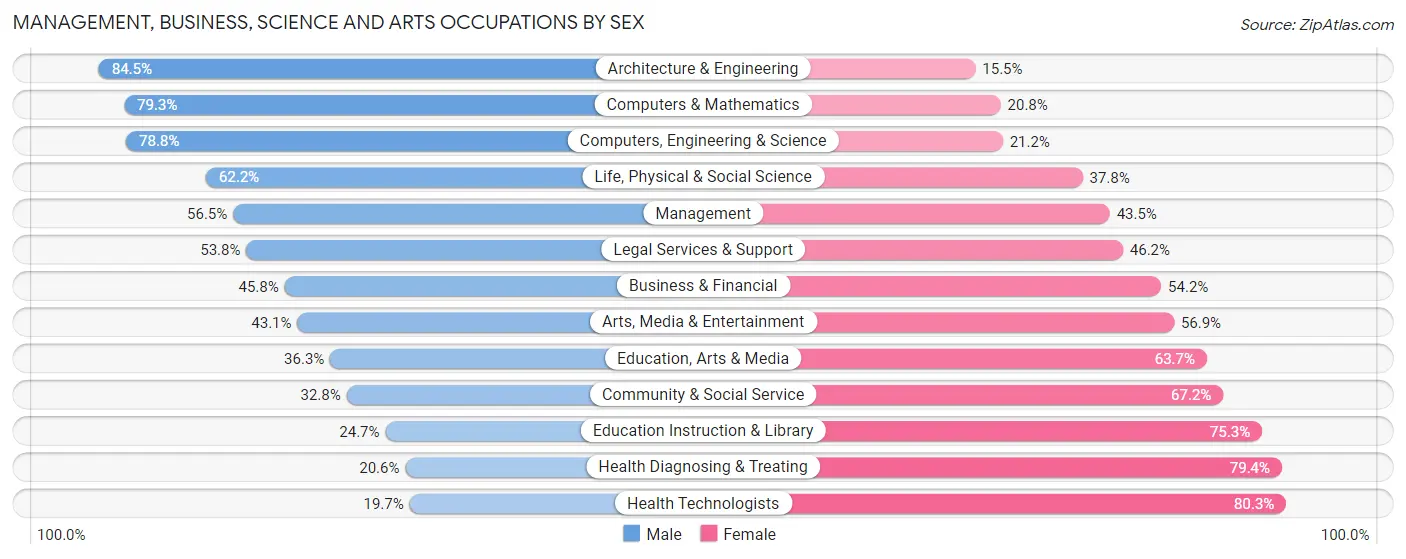
Management, Business, Science and Arts Occupations by Sex
Within the Management, Business, Science and Arts occupations in Concord, the most male-oriented occupations are Architecture & Engineering (84.5%), Computers & Mathematics (79.2%), and Computers, Engineering & Science (78.8%), while the most female-oriented occupations are Health Technologists (80.3%), Health Diagnosing & Treating (79.4%), and Education Instruction & Library (75.3%).
| Occupation | Male | Female |
| Management | 4,578 (56.5%) | 3,525 (43.5%) |
| Business & Financial | 1,995 (45.8%) | 2,364 (54.2%) |
| Computers, Engineering & Science | 3,622 (78.8%) | 973 (21.2%) |
| Computers & Mathematics | 1,890 (79.2%) | 495 (20.7%) |
| Architecture & Engineering | 1,354 (84.5%) | 248 (15.5%) |
| Life, Physical & Social Science | 378 (62.2%) | 230 (37.8%) |
| Community & Social Service | 2,356 (32.8%) | 4,818 (67.2%) |
| Education, Arts & Media | 347 (36.3%) | 610 (63.7%) |
| Legal Services & Support | 372 (53.8%) | 320 (46.2%) |
| Education Instruction & Library | 1,003 (24.7%) | 3,051 (75.3%) |
| Arts, Media & Entertainment | 634 (43.1%) | 837 (56.9%) |
| Health Diagnosing & Treating | 640 (20.6%) | 2,468 (79.4%) |
| Health Technologists | 410 (19.7%) | 1,671 (80.3%) |
| Total (Category) | 13,191 (48.2%) | 14,148 (51.7%) |
| Total (Overall) | 34,230 (52.7%) | 30,760 (47.3%) |
Services Occupations
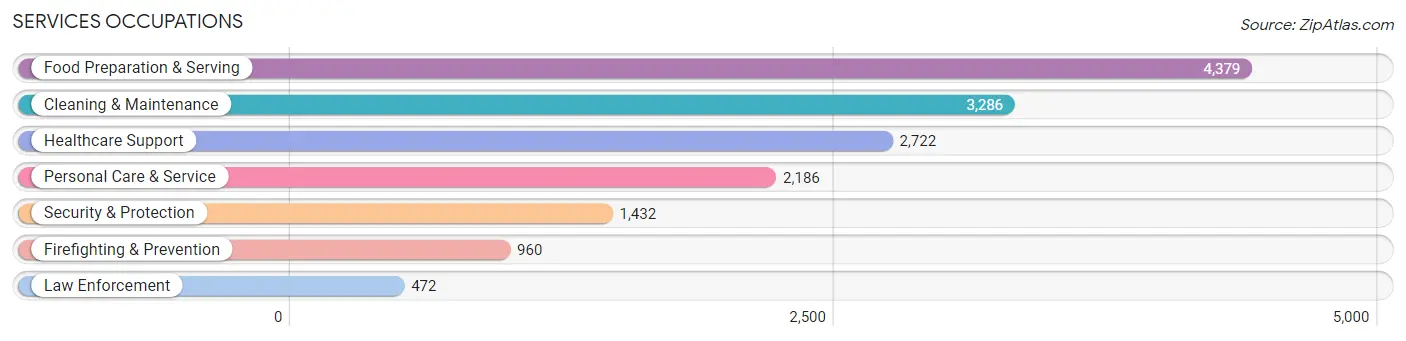
The most common Services occupations in Concord are Food Preparation & Serving (4,379 | 6.7%), Cleaning & Maintenance (3,286 | 5.1%), Healthcare Support (2,722 | 4.2%), Personal Care & Service (2,186 | 3.4%), and Security & Protection (1,432 | 2.2%).
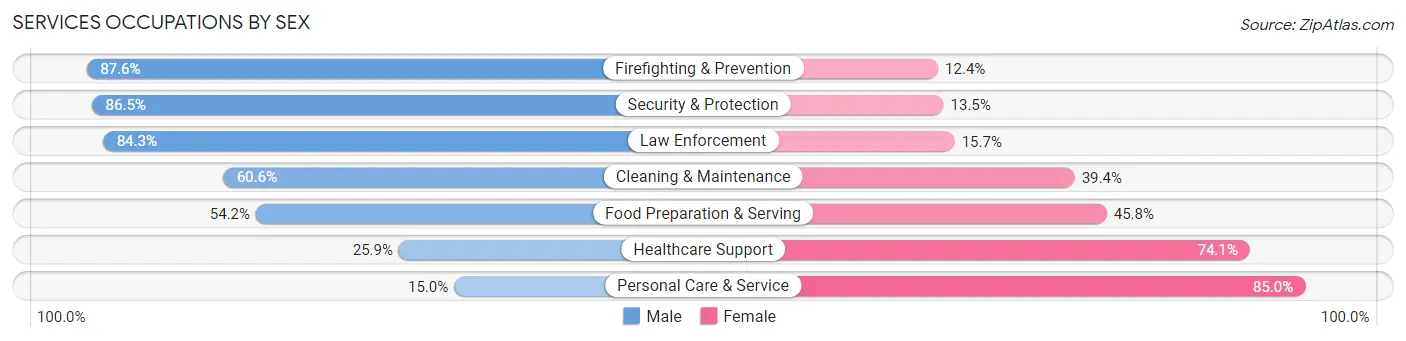
Services Occupations by Sex
Within the Services occupations in Concord, the most male-oriented occupations are Firefighting & Prevention (87.6%), Security & Protection (86.5%), and Law Enforcement (84.3%), while the most female-oriented occupations are Personal Care & Service (85.0%), Healthcare Support (74.1%), and Food Preparation & Serving (45.8%).
| Occupation | Male | Female |
| Healthcare Support | 705 (25.9%) | 2,017 (74.1%) |
| Security & Protection | 1,239 (86.5%) | 193 (13.5%) |
| Firefighting & Prevention | 841 (87.6%) | 119 (12.4%) |
| Law Enforcement | 398 (84.3%) | 74 (15.7%) |
| Food Preparation & Serving | 2,374 (54.2%) | 2,005 (45.8%) |
| Cleaning & Maintenance | 1,990 (60.6%) | 1,296 (39.4%) |
| Personal Care & Service | 327 (15.0%) | 1,859 (85.0%) |
| Total (Category) | 6,635 (47.4%) | 7,370 (52.6%) |
| Total (Overall) | 34,230 (52.7%) | 30,760 (47.3%) |
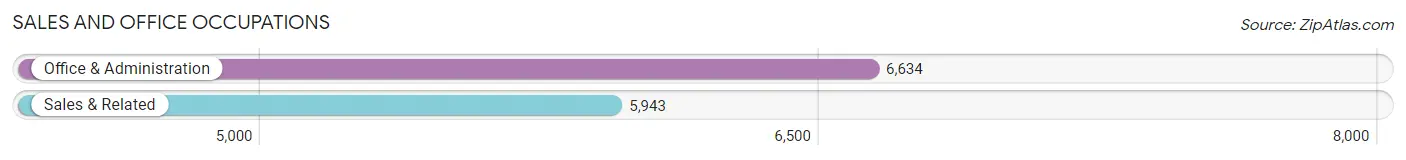
Sales and Office Occupations
The most common Sales and Office occupations in Concord are Office & Administration (6,634 | 10.2%), and Sales & Related (5,943 | 9.1%).
Sales and Office Occupations by Sex
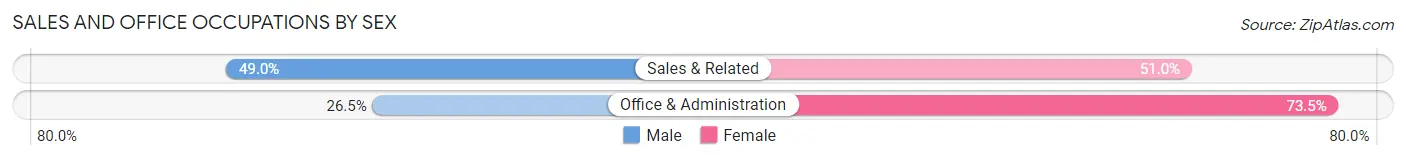
| Occupation | Male | Female |
| Sales & Related | 2,913 (49.0%) | 3,030 (51.0%) |
| Office & Administration | 1,756 (26.5%) | 4,878 (73.5%) |
| Total (Category) | 4,669 (37.1%) | 7,908 (62.9%) |
| Total (Overall) | 34,230 (52.7%) | 30,760 (47.3%) |
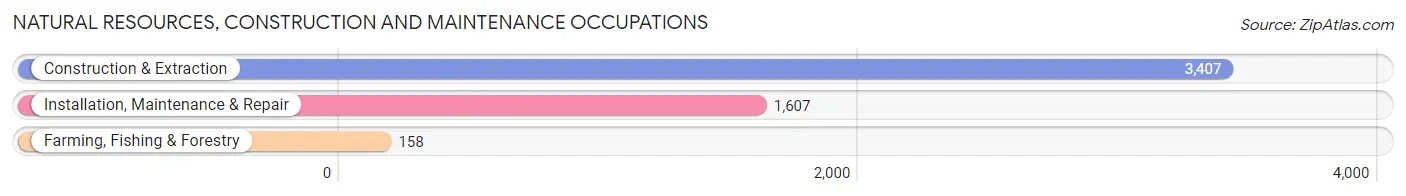
Natural Resources, Construction and Maintenance Occupations
The most common Natural Resources, Construction and Maintenance occupations in Concord are Construction & Extraction (3,407 | 5.2%), Installation, Maintenance & Repair (1,607 | 2.5%), and Farming, Fishing & Forestry (158 | 0.2%).
Natural Resources, Construction and Maintenance Occupations by Sex
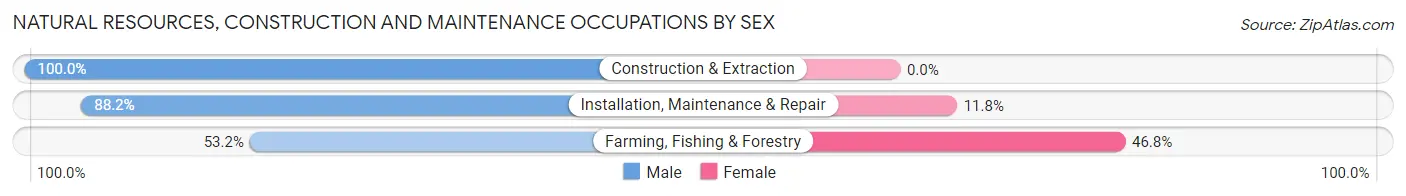
| Occupation | Male | Female |
| Farming, Fishing & Forestry | 84 (53.2%) | 74 (46.8%) |
| Construction & Extraction | 3,407 (100.0%) | 0 (0.0%) |
| Installation, Maintenance & Repair | 1,417 (88.2%) | 190 (11.8%) |
| Total (Category) | 4,908 (94.9%) | 264 (5.1%) |
| Total (Overall) | 34,230 (52.7%) | 30,760 (47.3%) |
Production, Transportation and Moving Occupations
The most common Production, Transportation and Moving occupations in Concord are Transportation (2,169 | 3.3%), Production (2,015 | 3.1%), and Material Moving (1,713 | 2.6%).
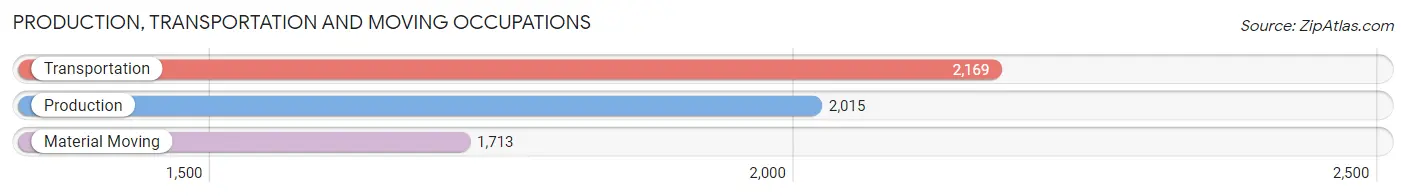
Production, Transportation and Moving Occupations by Sex
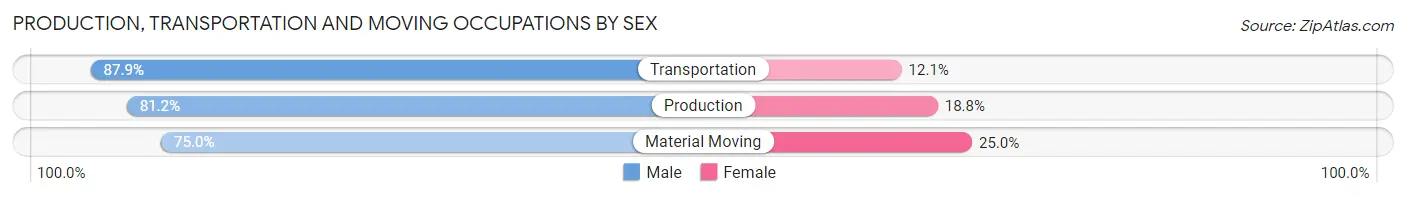
| Occupation | Male | Female |
| Production | 1,637 (81.2%) | 378 (18.8%) |
| Transportation | 1,906 (87.9%) | 263 (12.1%) |
| Material Moving | 1,284 (75.0%) | 429 (25.0%) |
| Total (Category) | 4,827 (81.9%) | 1,070 (18.1%) |
| Total (Overall) | 34,230 (52.7%) | 30,760 (47.3%) |
Employment Industries by Sex in Concord
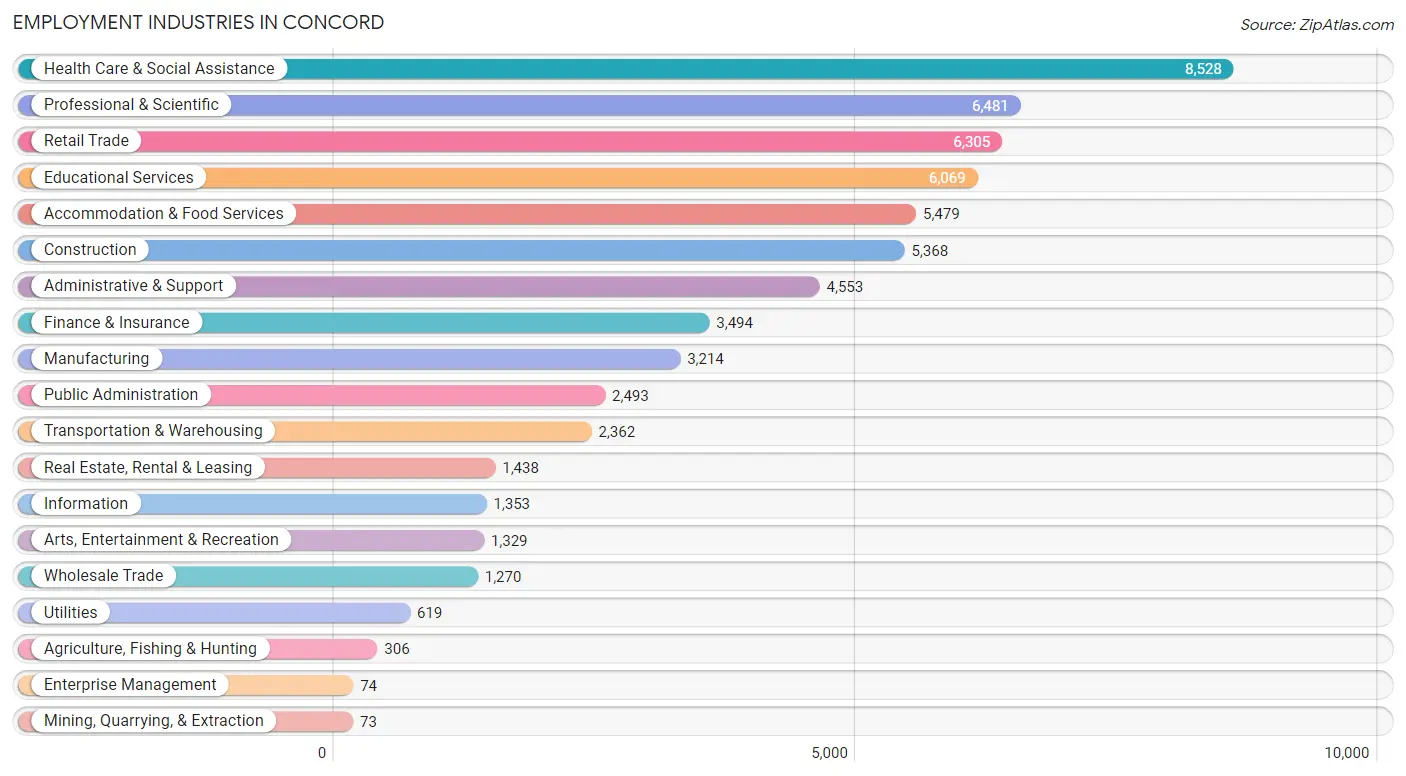
Employment Industries in Concord
The major employment industries in Concord include Health Care & Social Assistance (8,528 | 13.1%), Professional & Scientific (6,481 | 10.0%), Retail Trade (6,305 | 9.7%), Educational Services (6,069 | 9.3%), and Accommodation & Food Services (5,479 | 8.4%).
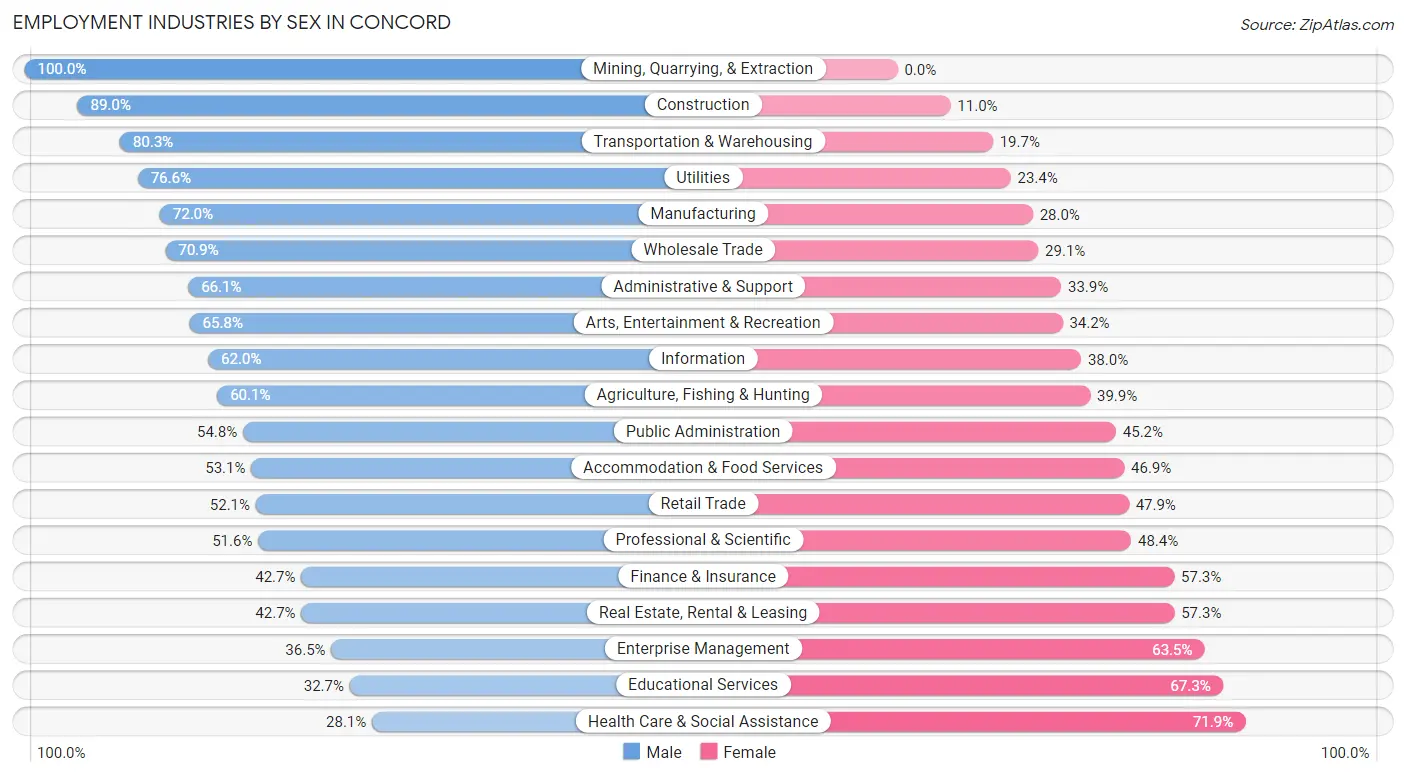
Employment Industries by Sex in Concord
The Concord industries that see more men than women are Mining, Quarrying, & Extraction (100.0%), Construction (89.0%), and Transportation & Warehousing (80.3%), whereas the industries that tend to have a higher number of women are Health Care & Social Assistance (71.9%), Educational Services (67.3%), and Enterprise Management (63.5%).
| Industry | Male | Female |
| Agriculture, Fishing & Hunting | 184 (60.1%) | 122 (39.9%) |
| Mining, Quarrying, & Extraction | 73 (100.0%) | 0 (0.0%) |
| Construction | 4,779 (89.0%) | 589 (11.0%) |
| Manufacturing | 2,314 (72.0%) | 900 (28.0%) |
| Wholesale Trade | 900 (70.9%) | 370 (29.1%) |
| Retail Trade | 3,287 (52.1%) | 3,018 (47.9%) |
| Transportation & Warehousing | 1,896 (80.3%) | 466 (19.7%) |
| Utilities | 474 (76.6%) | 145 (23.4%) |
| Information | 839 (62.0%) | 514 (38.0%) |
| Finance & Insurance | 1,493 (42.7%) | 2,001 (57.3%) |
| Real Estate, Rental & Leasing | 614 (42.7%) | 824 (57.3%) |
| Professional & Scientific | 3,347 (51.6%) | 3,134 (48.4%) |
| Enterprise Management | 27 (36.5%) | 47 (63.5%) |
| Administrative & Support | 3,011 (66.1%) | 1,542 (33.9%) |
| Educational Services | 1,984 (32.7%) | 4,085 (67.3%) |
| Health Care & Social Assistance | 2,394 (28.1%) | 6,134 (71.9%) |
| Arts, Entertainment & Recreation | 875 (65.8%) | 454 (34.2%) |
| Accommodation & Food Services | 2,908 (53.1%) | 2,571 (46.9%) |
| Public Administration | 1,366 (54.8%) | 1,127 (45.2%) |
| Total | 34,230 (52.7%) | 30,760 (47.3%) |
Education in Concord
School Enrollment in Concord
The most common levels of schooling among the 27,436 students in Concord are college / undergraduate (6,513 | 23.7%), high school (5,763 | 21.0%), and elementary school (5,186 | 18.9%).
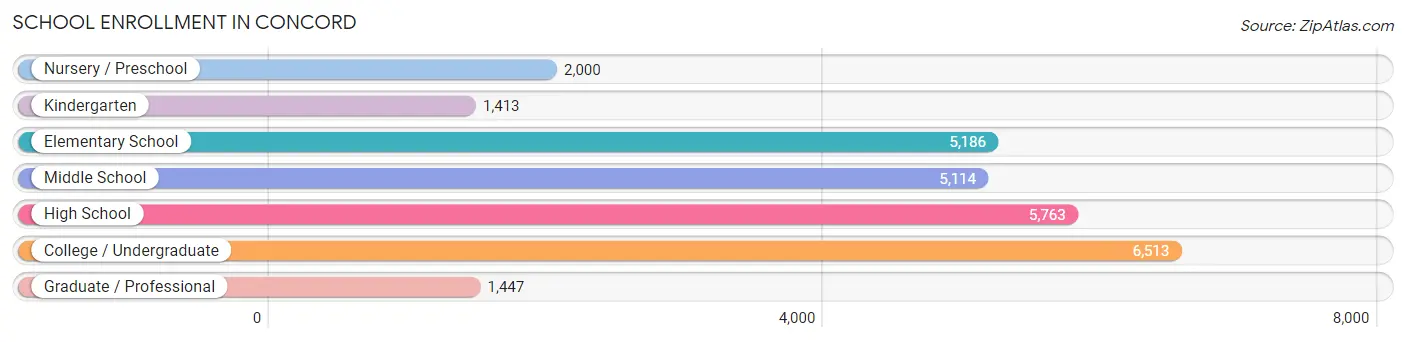
| School Level | # Students | % Students |
| Nursery / Preschool | 2,000 | 7.3% |
| Kindergarten | 1,413 | 5.1% |
| Elementary School | 5,186 | 18.9% |
| Middle School | 5,114 | 18.6% |
| High School | 5,763 | 21.0% |
| College / Undergraduate | 6,513 | 23.7% |
| Graduate / Professional | 1,447 | 5.3% |
| Total | 27,436 | 100.0% |
School Enrollment by Age by Funding Source in Concord
Out of a total of 27,436 students who are enrolled in schools in Concord, 5,597 (20.4%) attend a private institution, while the remaining 21,839 (79.6%) are enrolled in public schools. The age group of 3 to 4 year olds has the highest likelihood of being enrolled in private schools, with 804 (47.0% in the age bracket) enrolled. Conversely, the age group of 20 to 24 year olds has the lowest likelihood of being enrolled in a private school, with 2,008 (84.7% in the age bracket) attending a public institution.
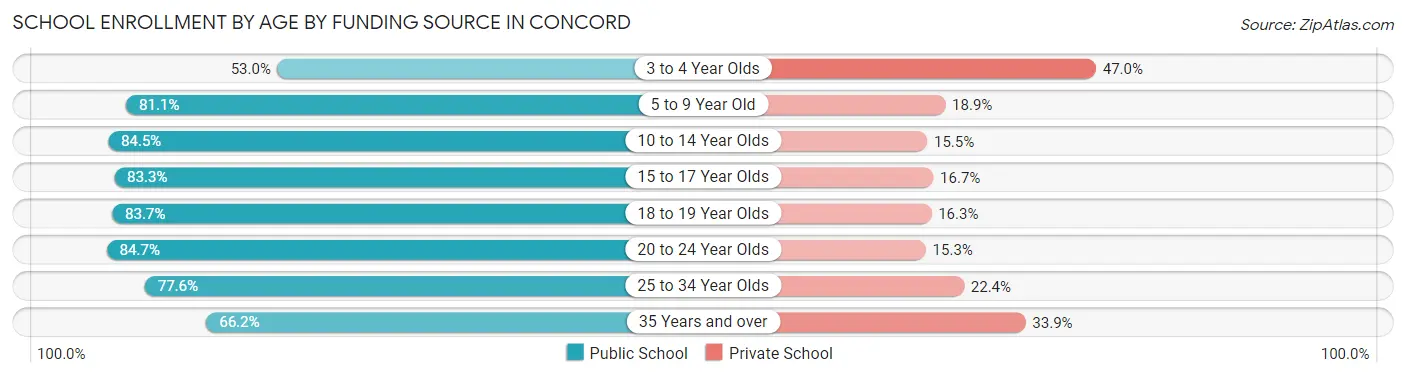
| Age Bracket | Public School | Private School |
| 3 to 4 Year Olds | 908 (53.0%) | 804 (47.0%) |
| 5 to 9 Year Old | 5,265 (81.1%) | 1,227 (18.9%) |
| 10 to 14 Year Olds | 5,228 (84.5%) | 961 (15.5%) |
| 15 to 17 Year Olds | 3,170 (83.3%) | 634 (16.7%) |
| 18 to 19 Year Olds | 1,939 (83.7%) | 378 (16.3%) |
| 20 to 24 Year Olds | 2,008 (84.7%) | 362 (15.3%) |
| 25 to 34 Year Olds | 2,038 (77.6%) | 588 (22.4%) |
| 35 Years and over | 1,274 (66.1%) | 652 (33.9%) |
| Total | 21,839 (79.6%) | 5,597 (20.4%) |
Educational Attainment by Field of Study in Concord
Business (6,704 | 18.8%), science & technology (3,345 | 9.4%), social sciences (3,237 | 9.1%), engineering (3,075 | 8.6%), and education (2,591 | 7.3%) are the most common fields of study among 35,591 individuals in Concord who have obtained a bachelor's degree or higher.
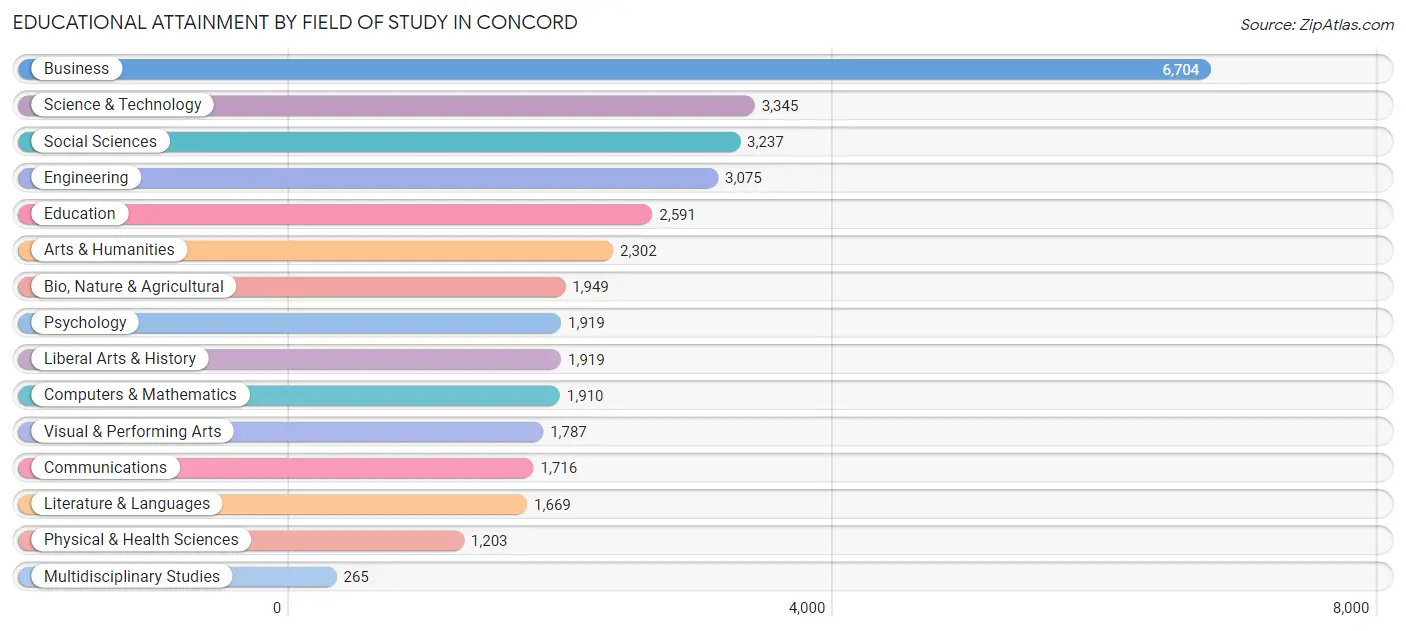
| Field of Study | # Graduates | % Graduates |
| Computers & Mathematics | 1,910 | 5.4% |
| Bio, Nature & Agricultural | 1,949 | 5.5% |
| Physical & Health Sciences | 1,203 | 3.4% |
| Psychology | 1,919 | 5.4% |
| Social Sciences | 3,237 | 9.1% |
| Engineering | 3,075 | 8.6% |
| Multidisciplinary Studies | 265 | 0.7% |
| Science & Technology | 3,345 | 9.4% |
| Business | 6,704 | 18.8% |
| Education | 2,591 | 7.3% |
| Literature & Languages | 1,669 | 4.7% |
| Liberal Arts & History | 1,919 | 5.4% |
| Visual & Performing Arts | 1,787 | 5.0% |
| Communications | 1,716 | 4.8% |
| Arts & Humanities | 2,302 | 6.5% |
| Total | 35,591 | 100.0% |
Transportation & Commute in Concord
Vehicle Availability by Sex in Concord
The most prevalent vehicle ownership categories in Concord are males with 2 vehicles (13,163, accounting for 39.4%) and females with 2 vehicles (11,851, making up 44.8%).
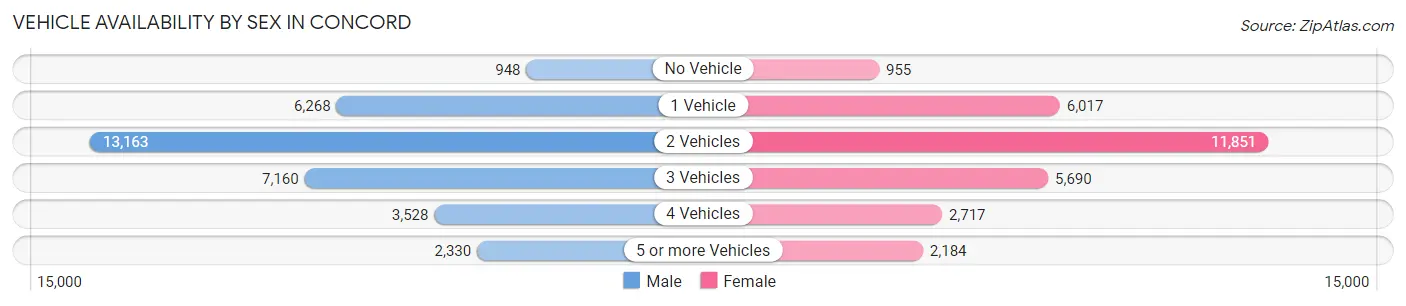
| Vehicles Available | Male | Female |
| No Vehicle | 948 (2.8%) | 955 (3.3%) |
| 1 Vehicle | 6,268 (18.8%) | 6,017 (20.5%) |
| 2 Vehicles | 13,163 (39.4%) | 11,851 (40.3%) |
| 3 Vehicles | 7,160 (21.4%) | 5,690 (19.3%) |
| 4 Vehicles | 3,528 (10.6%) | 2,717 (9.2%) |
| 5 or more Vehicles | 2,330 (7.0%) | 2,184 (7.4%) |
| Total | 33,397 (100.0%) | 29,414 (100.0%) |
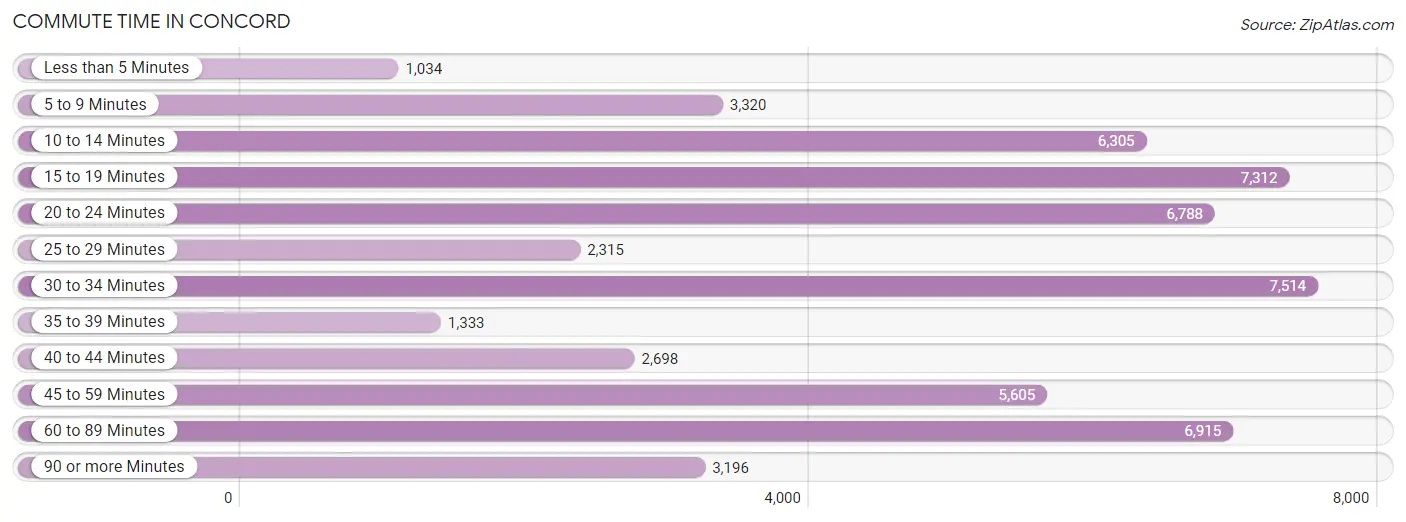
Commute Time in Concord
The most frequently occuring commute durations in Concord are 30 to 34 minutes (7,514 commuters, 13.8%), 15 to 19 minutes (7,312 commuters, 13.5%), and 60 to 89 minutes (6,915 commuters, 12.7%).
| Commute Time | # Commuters | % Commuters |
| Less than 5 Minutes | 1,034 | 1.9% |
| 5 to 9 Minutes | 3,320 | 6.1% |
| 10 to 14 Minutes | 6,305 | 11.6% |
| 15 to 19 Minutes | 7,312 | 13.5% |
| 20 to 24 Minutes | 6,788 | 12.5% |
| 25 to 29 Minutes | 2,315 | 4.3% |
| 30 to 34 Minutes | 7,514 | 13.8% |
| 35 to 39 Minutes | 1,333 | 2.5% |
| 40 to 44 Minutes | 2,698 | 5.0% |
| 45 to 59 Minutes | 5,605 | 10.3% |
| 60 to 89 Minutes | 6,915 | 12.7% |
| 90 or more Minutes | 3,196 | 5.9% |
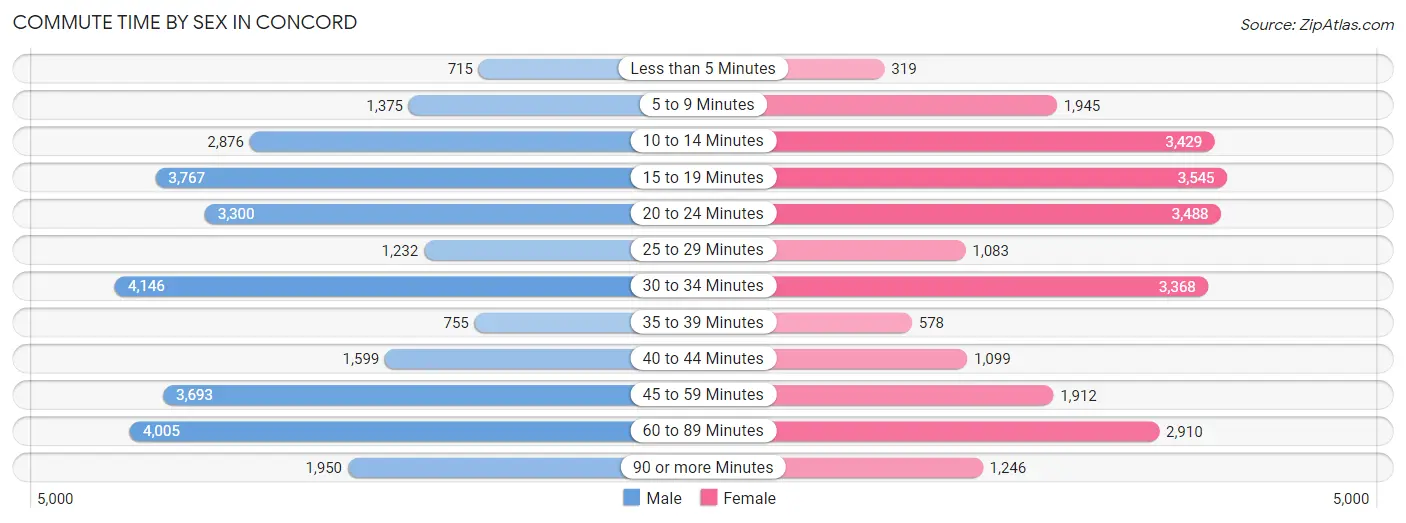
Commute Time by Sex in Concord
The most common commute times in Concord are 30 to 34 minutes (4,146 commuters, 14.1%) for males and 15 to 19 minutes (3,545 commuters, 14.2%) for females.
| Commute Time | Male | Female |
| Less than 5 Minutes | 715 (2.4%) | 319 (1.3%) |
| 5 to 9 Minutes | 1,375 (4.7%) | 1,945 (7.8%) |
| 10 to 14 Minutes | 2,876 (9.8%) | 3,429 (13.8%) |
| 15 to 19 Minutes | 3,767 (12.8%) | 3,545 (14.2%) |
| 20 to 24 Minutes | 3,300 (11.2%) | 3,488 (14.0%) |
| 25 to 29 Minutes | 1,232 (4.2%) | 1,083 (4.3%) |
| 30 to 34 Minutes | 4,146 (14.1%) | 3,368 (13.5%) |
| 35 to 39 Minutes | 755 (2.6%) | 578 (2.3%) |
| 40 to 44 Minutes | 1,599 (5.4%) | 1,099 (4.4%) |
| 45 to 59 Minutes | 3,693 (12.6%) | 1,912 (7.7%) |
| 60 to 89 Minutes | 4,005 (13.6%) | 2,910 (11.7%) |
| 90 or more Minutes | 1,950 (6.6%) | 1,246 (5.0%) |
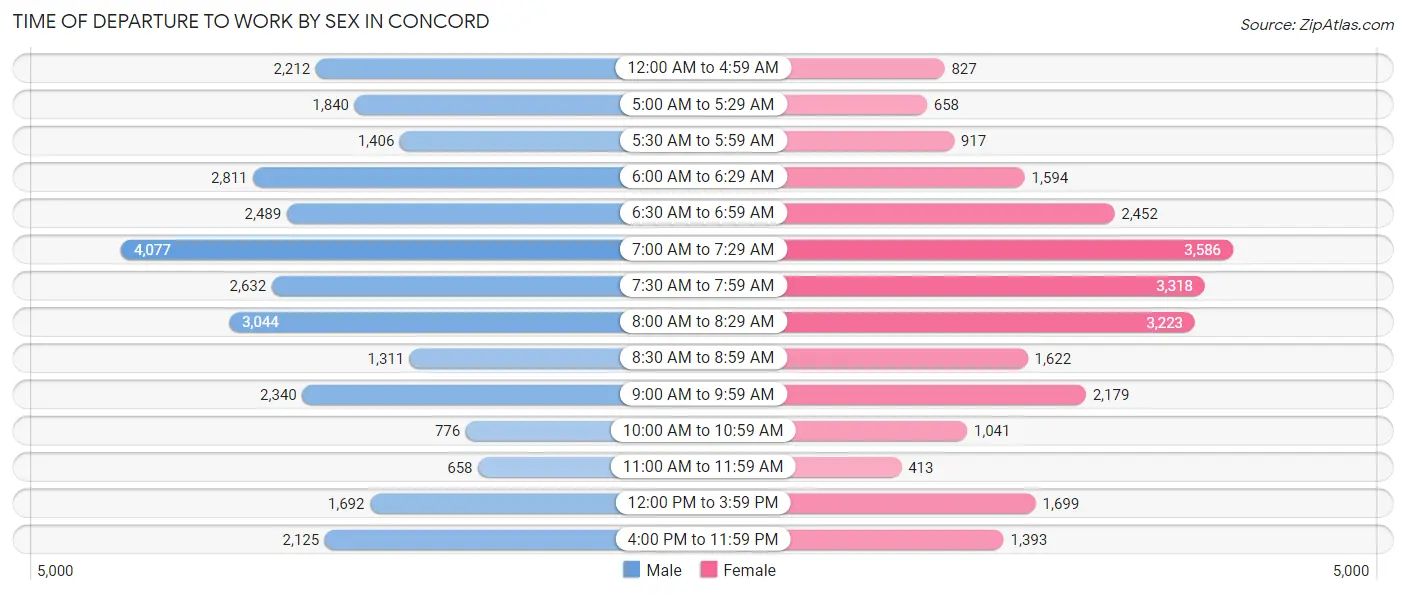
Time of Departure to Work by Sex in Concord
The most frequent times of departure to work in Concord are 7:00 AM to 7:29 AM (4,077, 13.9%) for males and 7:00 AM to 7:29 AM (3,586, 14.4%) for females.
| Time of Departure | Male | Female |
| 12:00 AM to 4:59 AM | 2,212 (7.5%) | 827 (3.3%) |
| 5:00 AM to 5:29 AM | 1,840 (6.3%) | 658 (2.6%) |
| 5:30 AM to 5:59 AM | 1,406 (4.8%) | 917 (3.7%) |
| 6:00 AM to 6:29 AM | 2,811 (9.6%) | 1,594 (6.4%) |
| 6:30 AM to 6:59 AM | 2,489 (8.5%) | 2,452 (9.8%) |
| 7:00 AM to 7:29 AM | 4,077 (13.9%) | 3,586 (14.4%) |
| 7:30 AM to 7:59 AM | 2,632 (8.9%) | 3,318 (13.3%) |
| 8:00 AM to 8:29 AM | 3,044 (10.3%) | 3,223 (12.9%) |
| 8:30 AM to 8:59 AM | 1,311 (4.5%) | 1,622 (6.5%) |
| 9:00 AM to 9:59 AM | 2,340 (8.0%) | 2,179 (8.7%) |
| 10:00 AM to 10:59 AM | 776 (2.6%) | 1,041 (4.2%) |
| 11:00 AM to 11:59 AM | 658 (2.2%) | 413 (1.7%) |
| 12:00 PM to 3:59 PM | 1,692 (5.8%) | 1,699 (6.8%) |
| 4:00 PM to 11:59 PM | 2,125 (7.2%) | 1,393 (5.6%) |
| Total | 29,413 (100.0%) | 24,922 (100.0%) |
Housing Occupancy in Concord
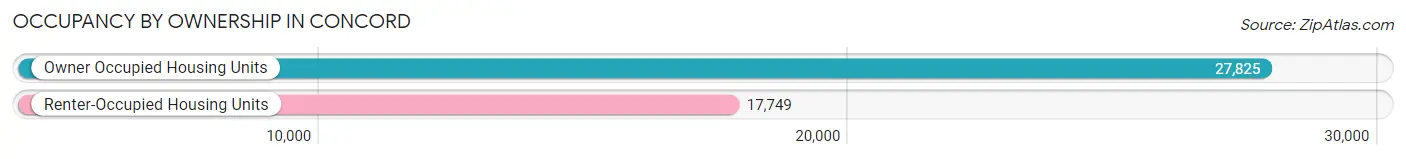
Occupancy by Ownership in Concord
Of the total 45,574 dwellings in Concord, owner-occupied units account for 27,825 (61.1%), while renter-occupied units make up 17,749 (39.0%).
| Occupancy | # Housing Units | % Housing Units |
| Owner Occupied Housing Units | 27,825 | 61.1% |
| Renter-Occupied Housing Units | 17,749 | 39.0% |
| Total Occupied Housing Units | 45,574 | 100.0% |
Occupancy by Household Size in Concord
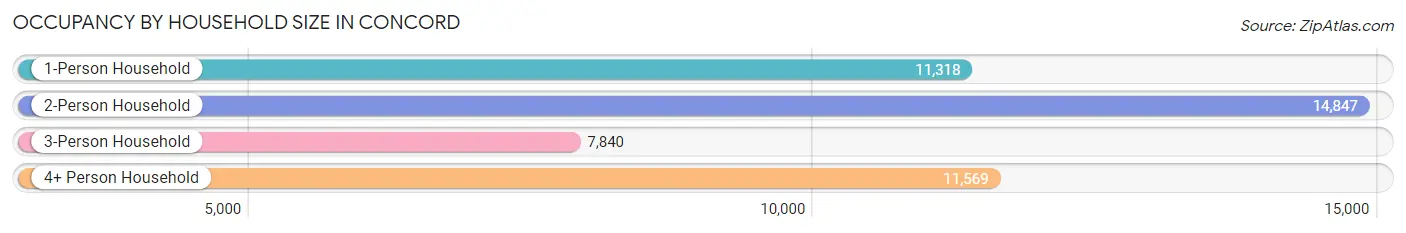
| Household Size | # Housing Units | % Housing Units |
| 1-Person Household | 11,318 | 24.8% |
| 2-Person Household | 14,847 | 32.6% |
| 3-Person Household | 7,840 | 17.2% |
| 4+ Person Household | 11,569 | 25.4% |
| Total Housing Units | 45,574 | 100.0% |
Occupancy by Ownership by Household Size in Concord
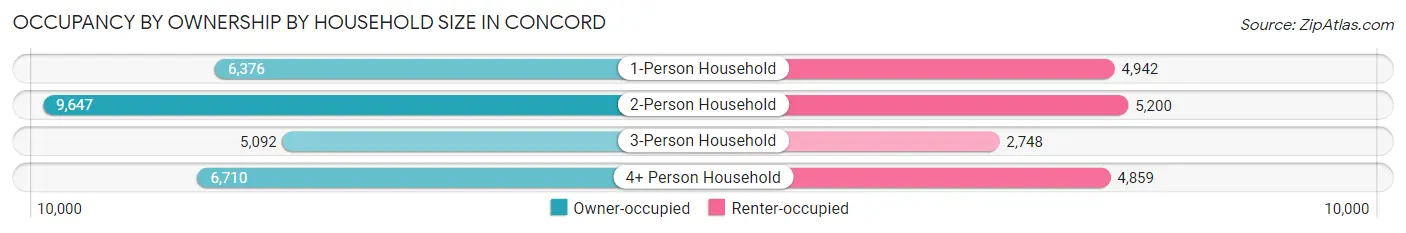
| Household Size | Owner-occupied | Renter-occupied |
| 1-Person Household | 6,376 (56.3%) | 4,942 (43.7%) |
| 2-Person Household | 9,647 (65.0%) | 5,200 (35.0%) |
| 3-Person Household | 5,092 (64.9%) | 2,748 (35.0%) |
| 4+ Person Household | 6,710 (58.0%) | 4,859 (42.0%) |
| Total Housing Units | 27,825 (61.1%) | 17,749 (39.0%) |
Occupancy by Educational Attainment in Concord
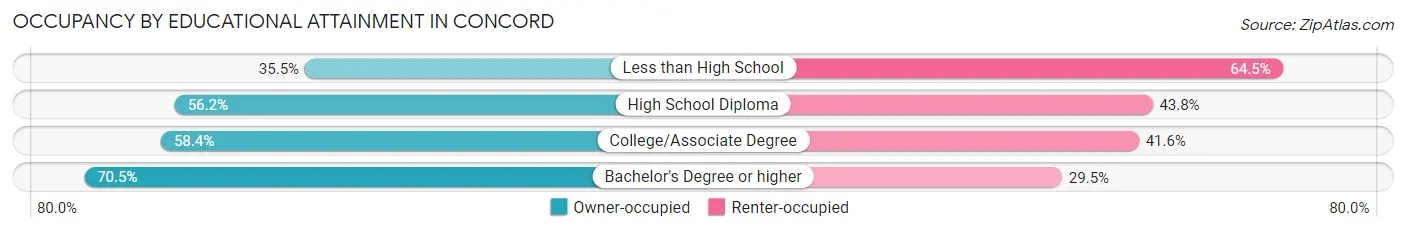
| Household Size | Owner-occupied | Renter-occupied |
| Less than High School | 1,405 (35.5%) | 2,548 (64.5%) |
| High School Diploma | 4,179 (56.2%) | 3,260 (43.8%) |
| College/Associate Degree | 8,964 (58.4%) | 6,395 (41.6%) |
| Bachelor's Degree or higher | 13,277 (70.5%) | 5,546 (29.5%) |
Occupancy by Age of Householder in Concord
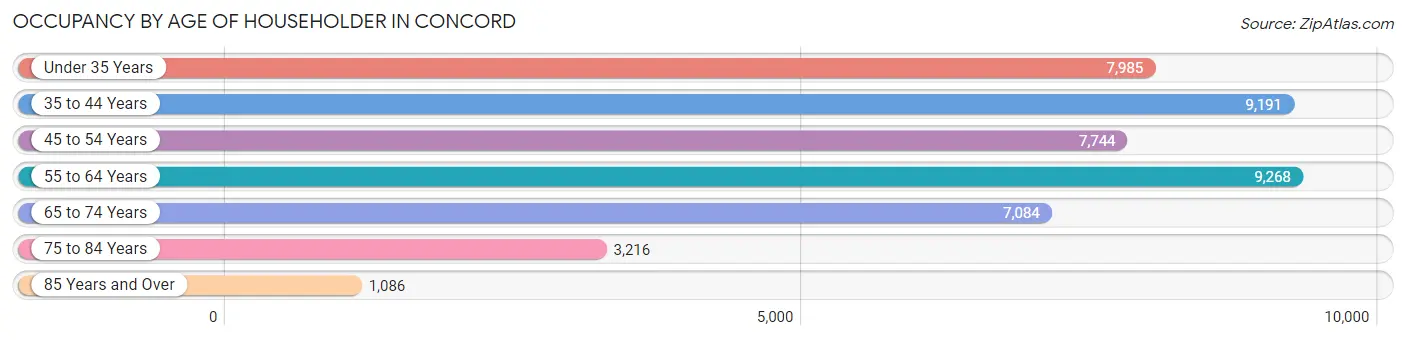
| Age Bracket | # Households | % Households |
| Under 35 Years | 7,985 | 17.5% |
| 35 to 44 Years | 9,191 | 20.2% |
| 45 to 54 Years | 7,744 | 17.0% |
| 55 to 64 Years | 9,268 | 20.3% |
| 65 to 74 Years | 7,084 | 15.5% |
| 75 to 84 Years | 3,216 | 7.1% |
| 85 Years and Over | 1,086 | 2.4% |
| Total | 45,574 | 100.0% |
Housing Finances in Concord
Median Income by Occupancy in Concord
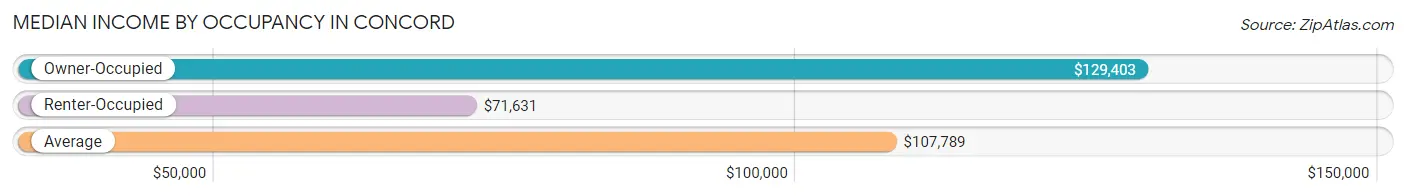
| Occupancy Type | # Households | Median Income |
| Owner-Occupied | 27,825 (61.1%) | $129,403 |
| Renter-Occupied | 17,749 (39.0%) | $71,631 |
| Average | 45,574 (100.0%) | $107,789 |
Occupancy by Householder Income Bracket in Concord
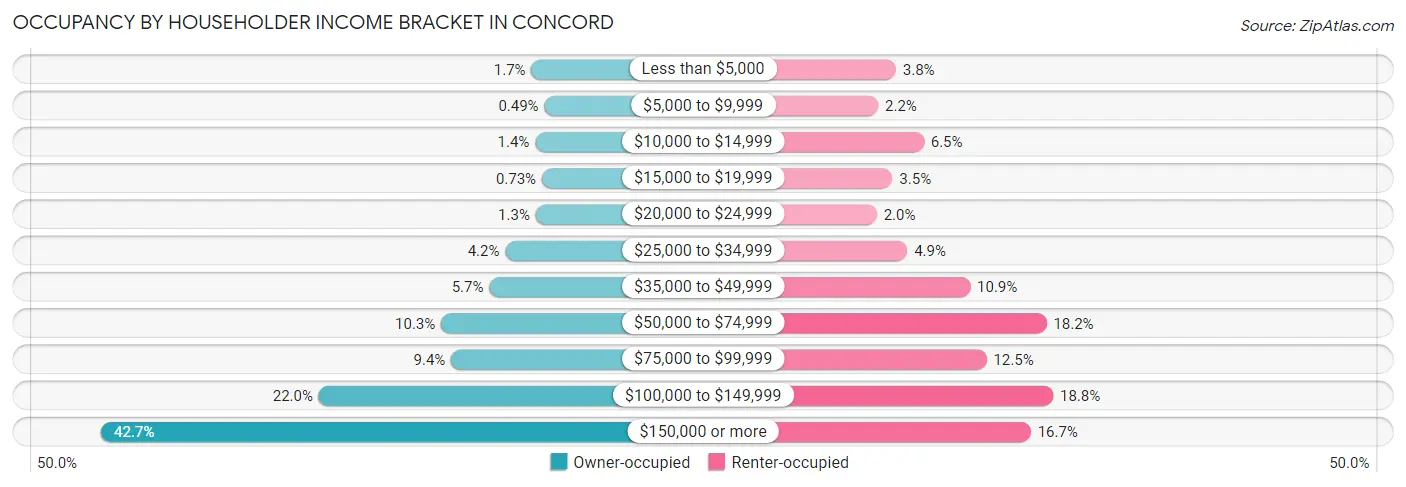
| Income Bracket | Owner-occupied | Renter-occupied |
| Less than $5,000 | 481 (1.7%) | 682 (3.8%) |
| $5,000 to $9,999 | 136 (0.5%) | 382 (2.1%) |
| $10,000 to $14,999 | 382 (1.4%) | 1,153 (6.5%) |
| $15,000 to $19,999 | 203 (0.7%) | 623 (3.5%) |
| $20,000 to $24,999 | 368 (1.3%) | 359 (2.0%) |
| $25,000 to $34,999 | 1,175 (4.2%) | 873 (4.9%) |
| $35,000 to $49,999 | 1,598 (5.7%) | 1,937 (10.9%) |
| $50,000 to $74,999 | 2,873 (10.3%) | 3,227 (18.2%) |
| $75,000 to $99,999 | 2,607 (9.4%) | 2,213 (12.5%) |
| $100,000 to $149,999 | 6,117 (22.0%) | 3,339 (18.8%) |
| $150,000 or more | 11,885 (42.7%) | 2,961 (16.7%) |
| Total | 27,825 (100.0%) | 17,749 (100.0%) |
Monthly Housing Cost Tiers in Concord
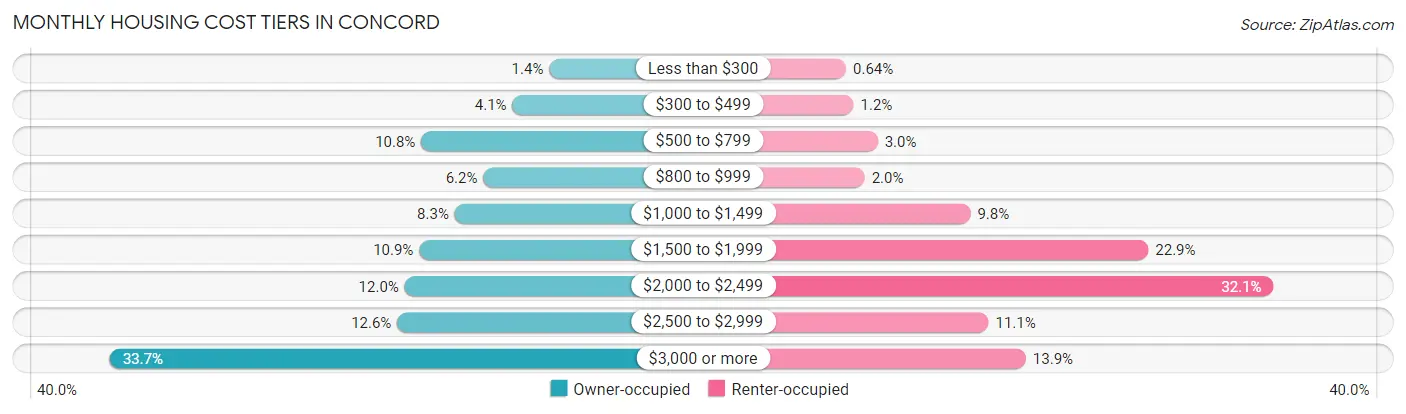
| Monthly Cost | Owner-occupied | Renter-occupied |
| Less than $300 | 378 (1.4%) | 113 (0.6%) |
| $300 to $499 | 1,132 (4.1%) | 211 (1.2%) |
| $500 to $799 | 3,001 (10.8%) | 528 (3.0%) |
| $800 to $999 | 1,731 (6.2%) | 357 (2.0%) |
| $1,000 to $1,499 | 2,315 (8.3%) | 1,739 (9.8%) |
| $1,500 to $1,999 | 3,044 (10.9%) | 4,065 (22.9%) |
| $2,000 to $2,499 | 3,343 (12.0%) | 5,700 (32.1%) |
| $2,500 to $2,999 | 3,496 (12.6%) | 1,976 (11.1%) |
| $3,000 or more | 9,385 (33.7%) | 2,463 (13.9%) |
| Total | 27,825 (100.0%) | 17,749 (100.0%) |
Physical Housing Characteristics in Concord
Housing Structures in Concord
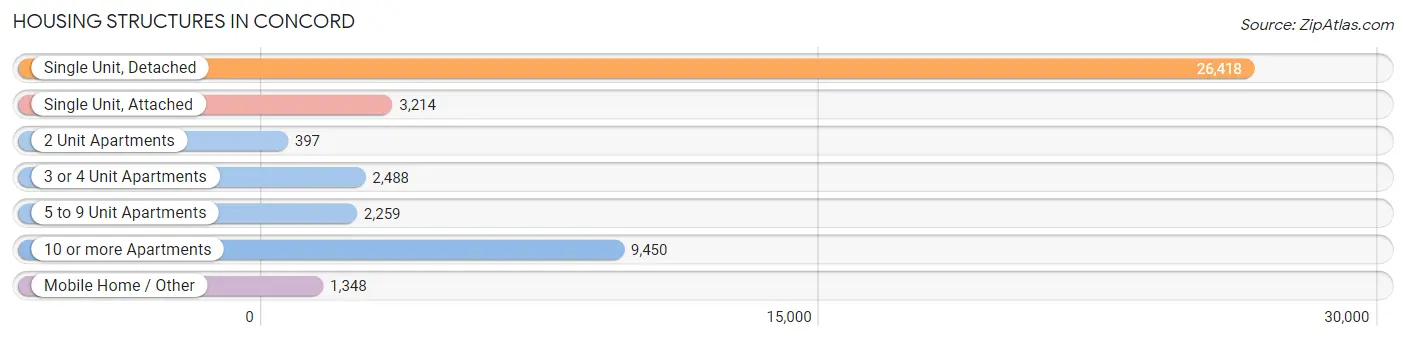
| Structure Type | # Housing Units | % Housing Units |
| Single Unit, Detached | 26,418 | 58.0% |
| Single Unit, Attached | 3,214 | 7.0% |
| 2 Unit Apartments | 397 | 0.9% |
| 3 or 4 Unit Apartments | 2,488 | 5.5% |
| 5 to 9 Unit Apartments | 2,259 | 5.0% |
| 10 or more Apartments | 9,450 | 20.7% |
| Mobile Home / Other | 1,348 | 3.0% |
| Total | 45,574 | 100.0% |
Housing Structures by Occupancy in Concord
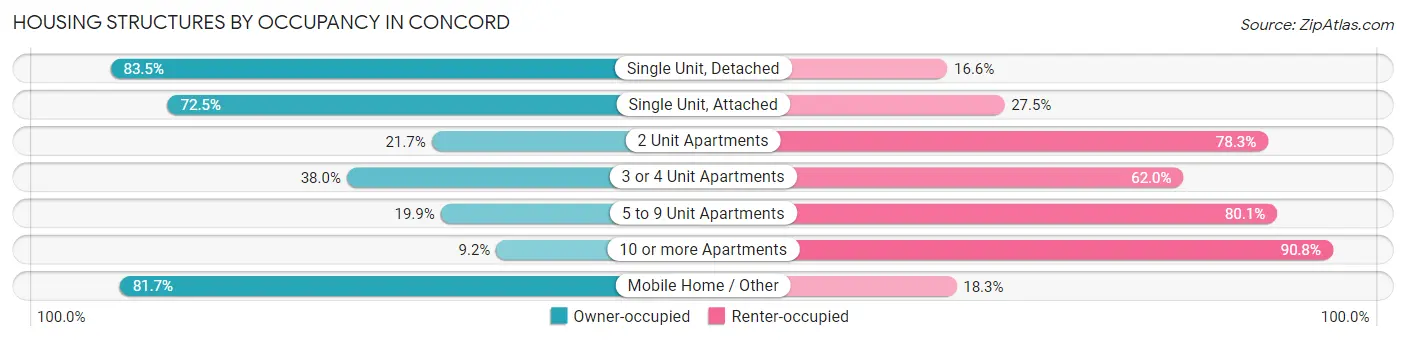
| Structure Type | Owner-occupied | Renter-occupied |
| Single Unit, Detached | 22,045 (83.5%) | 4,373 (16.6%) |
| Single Unit, Attached | 2,329 (72.5%) | 885 (27.5%) |
| 2 Unit Apartments | 86 (21.7%) | 311 (78.3%) |
| 3 or 4 Unit Apartments | 945 (38.0%) | 1,543 (62.0%) |
| 5 to 9 Unit Apartments | 450 (19.9%) | 1,809 (80.1%) |
| 10 or more Apartments | 869 (9.2%) | 8,581 (90.8%) |
| Mobile Home / Other | 1,101 (81.7%) | 247 (18.3%) |
| Total | 27,825 (61.1%) | 17,749 (39.0%) |
Housing Structures by Number of Rooms in Concord
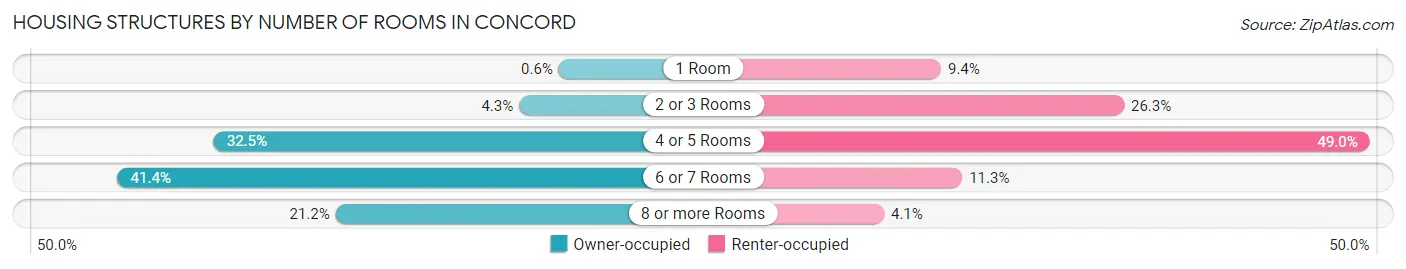
| Number of Rooms | Owner-occupied | Renter-occupied |
| 1 Room | 166 (0.6%) | 1,660 (9.3%) |
| 2 or 3 Rooms | 1,187 (4.3%) | 4,665 (26.3%) |
| 4 or 5 Rooms | 9,044 (32.5%) | 8,693 (49.0%) |
| 6 or 7 Rooms | 11,518 (41.4%) | 2,007 (11.3%) |
| 8 or more Rooms | 5,910 (21.2%) | 724 (4.1%) |
| Total | 27,825 (100.0%) | 17,749 (100.0%) |
Housing Structure by Heating Type in Concord
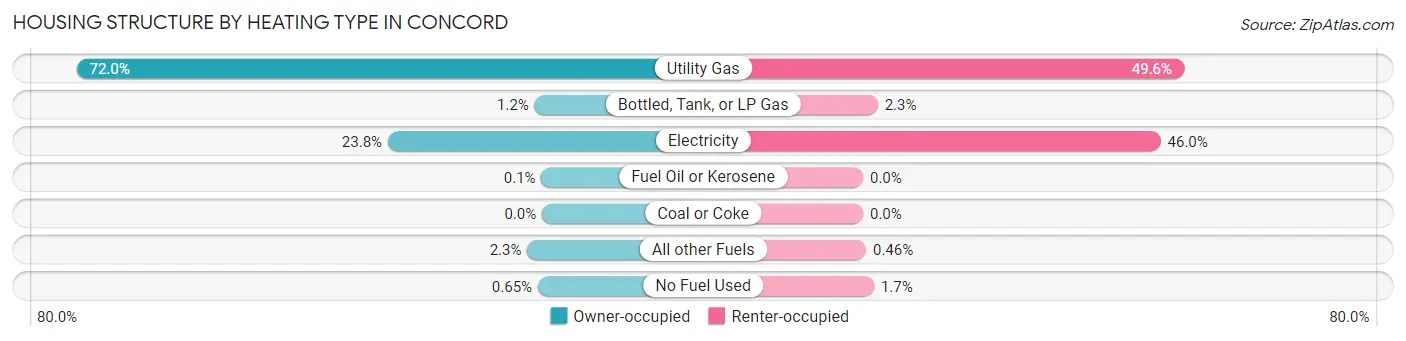
| Heating Type | Owner-occupied | Renter-occupied |
| Utility Gas | 20,025 (72.0%) | 8,801 (49.6%) |
| Bottled, Tank, or LP Gas | 321 (1.1%) | 403 (2.3%) |
| Electricity | 6,634 (23.8%) | 8,164 (46.0%) |
| Fuel Oil or Kerosene | 28 (0.1%) | 0 (0.0%) |
| Coal or Coke | 0 (0.0%) | 0 (0.0%) |
| All other Fuels | 637 (2.3%) | 81 (0.5%) |
| No Fuel Used | 180 (0.6%) | 300 (1.7%) |
| Total | 27,825 (100.0%) | 17,749 (100.0%) |
Household Vehicle Usage in Concord
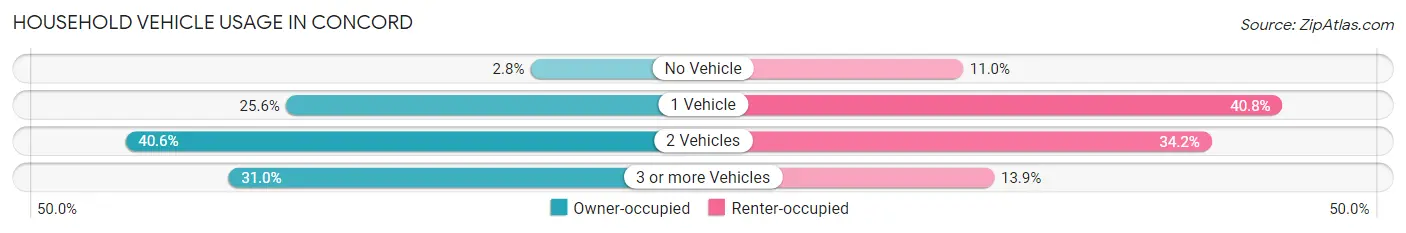
| Vehicles per Household | Owner-occupied | Renter-occupied |
| No Vehicle | 778 (2.8%) | 1,954 (11.0%) |
| 1 Vehicle | 7,132 (25.6%) | 7,248 (40.8%) |
| 2 Vehicles | 11,296 (40.6%) | 6,076 (34.2%) |
| 3 or more Vehicles | 8,619 (31.0%) | 2,471 (13.9%) |
| Total | 27,825 (100.0%) | 17,749 (100.0%) |
Real Estate & Mortgages in Concord
Real Estate and Mortgage Overview in Concord
| Characteristic | Without Mortgage | With Mortgage |
| Housing Units | 7,053 | 20,772 |
| Median Property Value | $645,900 | $726,300 |
| Median Household Income | $88,926 | $10,167 |
| Monthly Housing Costs | $717 | $9,359 |
| Real Estate Taxes | $3,435 | $576 |
Property Value by Mortgage Status in Concord
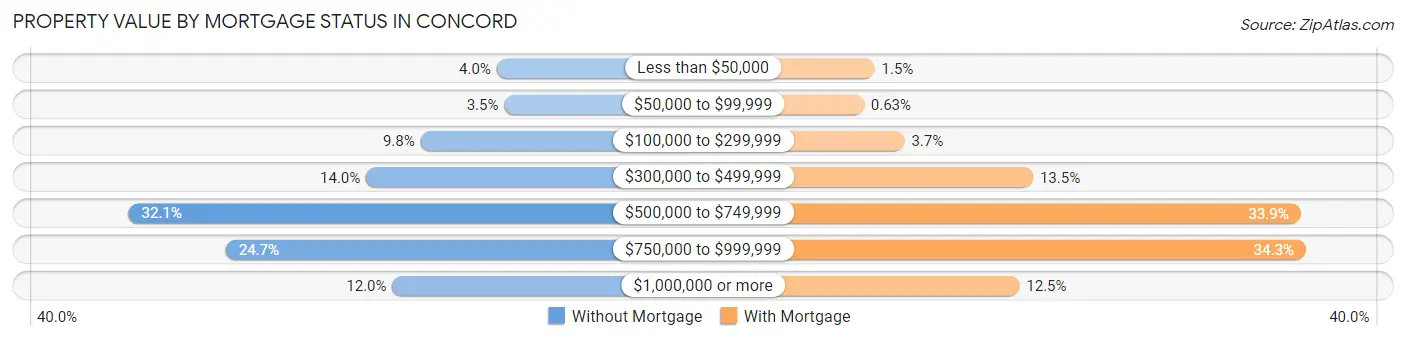
| Property Value | Without Mortgage | With Mortgage |
| Less than $50,000 | 284 (4.0%) | 301 (1.5%) |
| $50,000 to $99,999 | 243 (3.5%) | 130 (0.6%) |
| $100,000 to $299,999 | 693 (9.8%) | 774 (3.7%) |
| $300,000 to $499,999 | 986 (14.0%) | 2,808 (13.5%) |
| $500,000 to $749,999 | 2,262 (32.1%) | 7,041 (33.9%) |
| $750,000 to $999,999 | 1,740 (24.7%) | 7,126 (34.3%) |
| $1,000,000 or more | 845 (12.0%) | 2,592 (12.5%) |
| Total | 7,053 (100.0%) | 20,772 (100.0%) |
Household Income by Mortgage Status in Concord
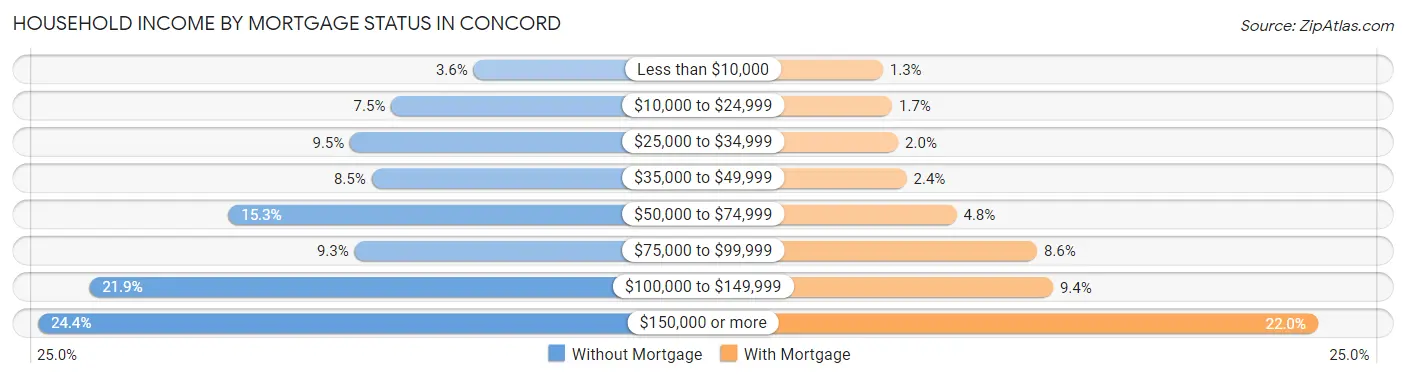
| Household Income | Without Mortgage | With Mortgage |
| Less than $10,000 | 255 (3.6%) | 270 (1.3%) |
| $10,000 to $24,999 | 532 (7.5%) | 362 (1.7%) |
| $25,000 to $34,999 | 670 (9.5%) | 421 (2.0%) |
| $35,000 to $49,999 | 598 (8.5%) | 505 (2.4%) |
| $50,000 to $74,999 | 1,079 (15.3%) | 1,000 (4.8%) |
| $75,000 to $99,999 | 655 (9.3%) | 1,794 (8.6%) |
| $100,000 to $149,999 | 1,546 (21.9%) | 1,952 (9.4%) |
| $150,000 or more | 1,718 (24.4%) | 4,571 (22.0%) |
| Total | 7,053 (100.0%) | 20,772 (100.0%) |
Property Value to Household Income Ratio in Concord
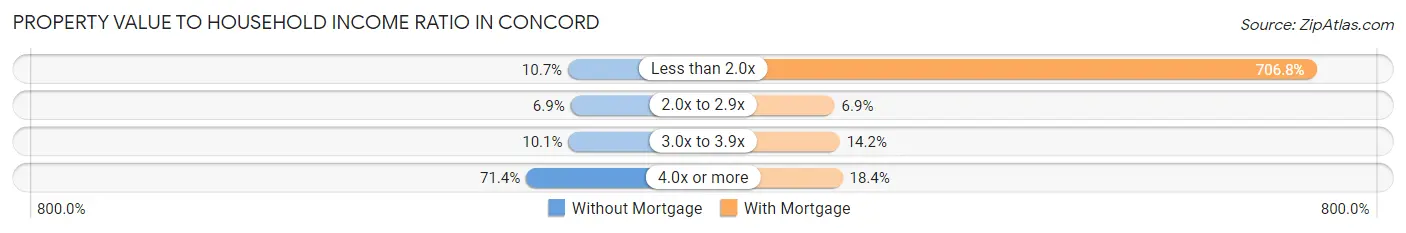
| Value-to-Income Ratio | Without Mortgage | With Mortgage |
| Less than 2.0x | 752 (10.7%) | 146,810 (706.8%) |
| 2.0x to 2.9x | 484 (6.9%) | 1,432 (6.9%) |
| 3.0x to 3.9x | 713 (10.1%) | 2,958 (14.2%) |
| 4.0x or more | 5,036 (71.4%) | 3,815 (18.4%) |
| Total | 7,053 (100.0%) | 20,772 (100.0%) |
Real Estate Taxes by Mortgage Status in Concord
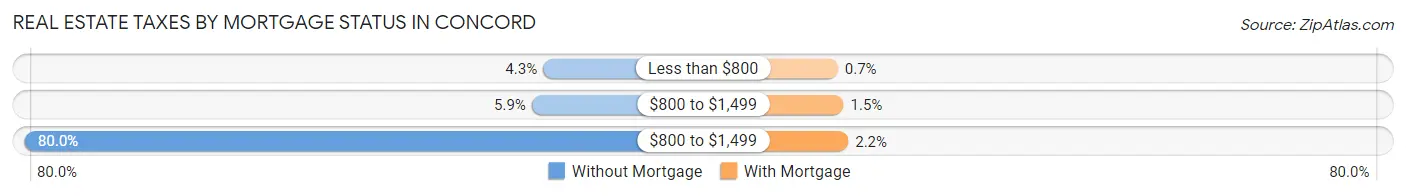
| Property Taxes | Without Mortgage | With Mortgage |
| Less than $800 | 300 (4.3%) | 145 (0.7%) |
| $800 to $1,499 | 417 (5.9%) | 320 (1.5%) |
| $800 to $1,499 | 5,639 (79.9%) | 464 (2.2%) |
| Total | 7,053 (100.0%) | 20,772 (100.0%) |
Health & Disability in Concord
Health Insurance Coverage by Age in Concord
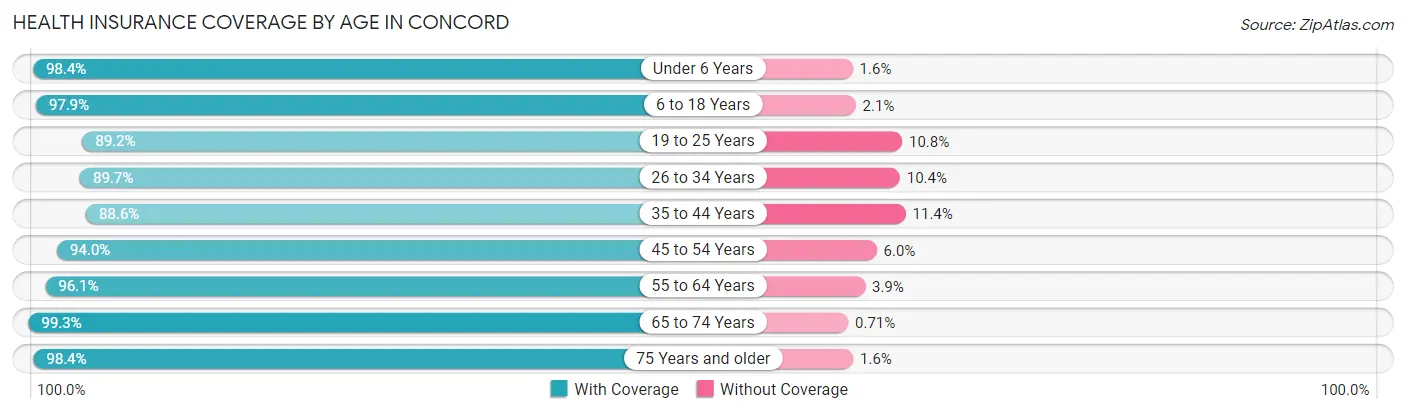
| Age Bracket | With Coverage | Without Coverage |
| Under 6 Years | 9,831 (98.4%) | 156 (1.6%) |
| 6 to 18 Years | 16,987 (97.9%) | 366 (2.1%) |
| 19 to 25 Years | 8,084 (89.2%) | 976 (10.8%) |
| 26 to 34 Years | 16,174 (89.6%) | 1,867 (10.3%) |
| 35 to 44 Years | 16,314 (88.6%) | 2,107 (11.4%) |
| 45 to 54 Years | 14,164 (94.0%) | 909 (6.0%) |
| 55 to 64 Years | 16,331 (96.1%) | 657 (3.9%) |
| 65 to 74 Years | 11,977 (99.3%) | 86 (0.7%) |
| 75 Years and older | 7,150 (98.4%) | 119 (1.6%) |
| Total | 117,012 (94.2%) | 7,243 (5.8%) |
Health Insurance Coverage by Citizenship Status in Concord
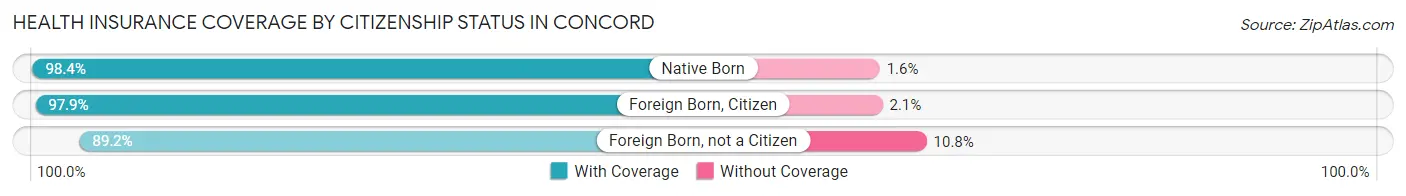
| Citizenship Status | With Coverage | Without Coverage |
| Native Born | 9,831 (98.4%) | 156 (1.6%) |
| Foreign Born, Citizen | 16,987 (97.9%) | 366 (2.1%) |
| Foreign Born, not a Citizen | 8,084 (89.2%) | 976 (10.8%) |
Health Insurance Coverage by Household Income in Concord
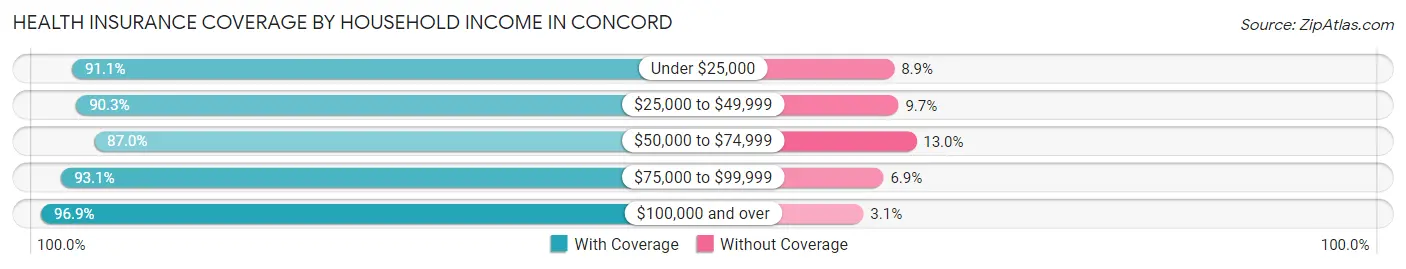
| Household Income | With Coverage | Without Coverage |
| Under $25,000 | 8,196 (91.1%) | 800 (8.9%) |
| $25,000 to $49,999 | 10,926 (90.3%) | 1,171 (9.7%) |
| $50,000 to $74,999 | 12,817 (87.0%) | 1,919 (13.0%) |
| $75,000 to $99,999 | 11,974 (93.1%) | 883 (6.9%) |
| $100,000 and over | 72,300 (96.9%) | 2,324 (3.1%) |
Public vs Private Health Insurance Coverage by Age in Concord
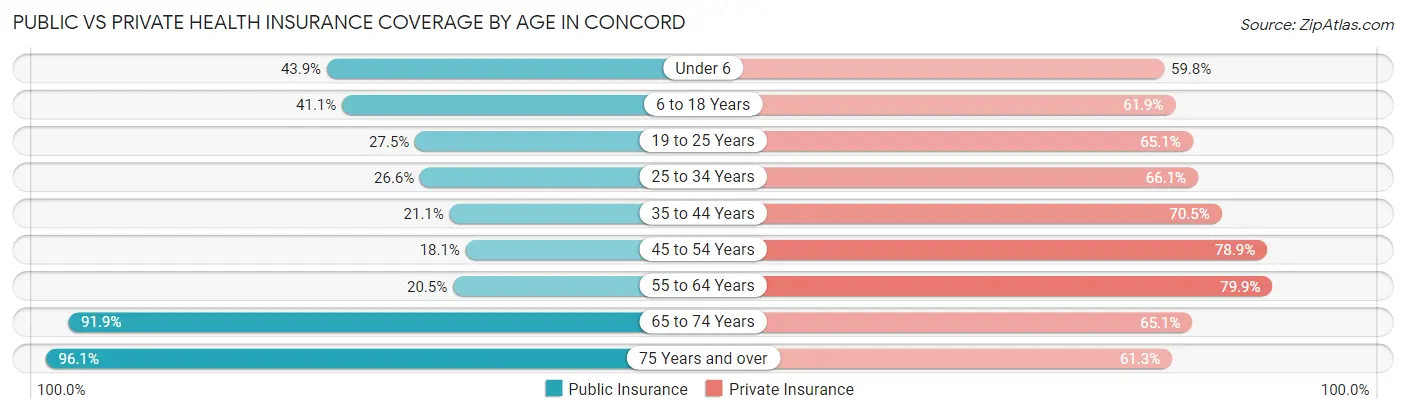
| Age Bracket | Public Insurance | Private Insurance |
| Under 6 | 4,382 (43.9%) | 5,974 (59.8%) |
| 6 to 18 Years | 7,127 (41.1%) | 10,740 (61.9%) |
| 19 to 25 Years | 2,492 (27.5%) | 5,897 (65.1%) |
| 25 to 34 Years | 4,797 (26.6%) | 11,923 (66.1%) |
| 35 to 44 Years | 3,888 (21.1%) | 12,984 (70.5%) |
| 45 to 54 Years | 2,733 (18.1%) | 11,898 (78.9%) |
| 55 to 64 Years | 3,478 (20.5%) | 13,575 (79.9%) |
| 65 to 74 Years | 11,090 (91.9%) | 7,847 (65.0%) |
| 75 Years and over | 6,985 (96.1%) | 4,455 (61.3%) |
| Total | 46,972 (37.8%) | 85,293 (68.6%) |
Disability Status by Sex by Age in Concord
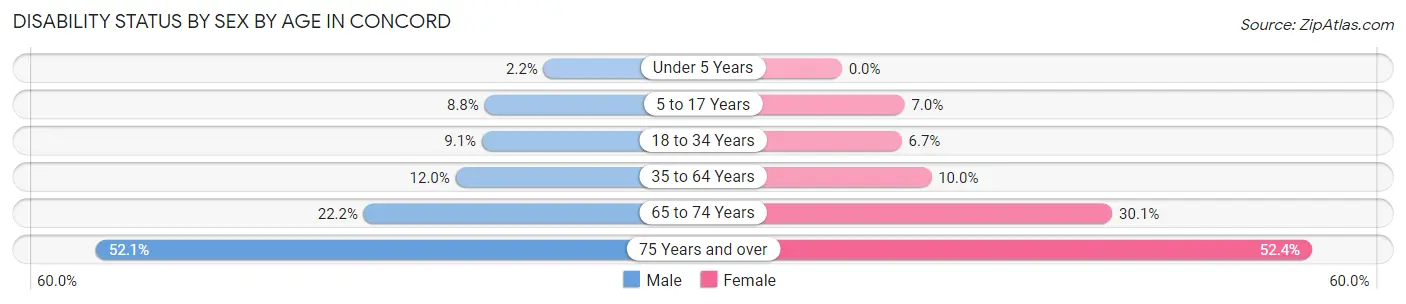
| Age Bracket | Male | Female |
| Under 5 Years | 92 (2.2%) | 0 (0.0%) |
| 5 to 17 Years | 790 (8.8%) | 575 (7.0%) |
| 18 to 34 Years | 1,322 (9.1%) | 946 (6.7%) |
| 35 to 64 Years | 3,078 (12.0%) | 2,473 (10.0%) |
| 65 to 74 Years | 1,265 (22.2%) | 1,918 (30.1%) |
| 75 Years and over | 1,468 (52.1%) | 2,329 (52.3%) |
Disability Class by Sex by Age in Concord
Disability Class: Hearing Difficulty
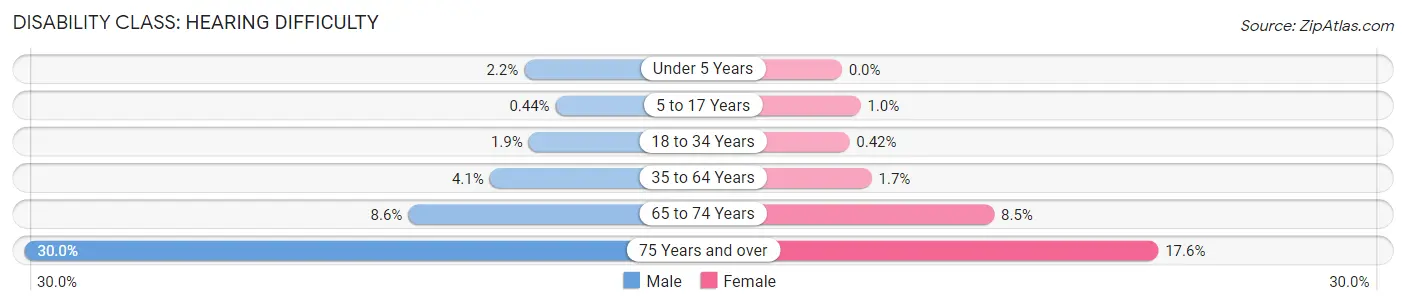
| Age Bracket | Male | Female |
| Under 5 Years | 92 (2.2%) | 0 (0.0%) |
| 5 to 17 Years | 40 (0.4%) | 86 (1.0%) |
| 18 to 34 Years | 283 (1.9%) | 60 (0.4%) |
| 35 to 64 Years | 1,055 (4.1%) | 411 (1.7%) |
| 65 to 74 Years | 492 (8.6%) | 540 (8.5%) |
| 75 Years and over | 846 (30.0%) | 784 (17.6%) |
Disability Class: Vision Difficulty
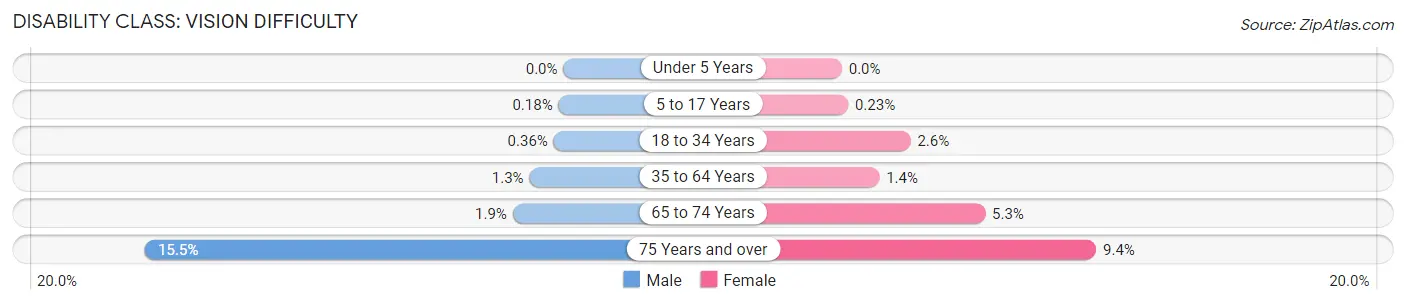
| Age Bracket | Male | Female |
| Under 5 Years | 0 (0.0%) | 0 (0.0%) |
| 5 to 17 Years | 16 (0.2%) | 19 (0.2%) |
| 18 to 34 Years | 53 (0.4%) | 363 (2.5%) |
| 35 to 64 Years | 322 (1.3%) | 346 (1.4%) |
| 65 to 74 Years | 107 (1.9%) | 339 (5.3%) |
| 75 Years and over | 438 (15.5%) | 420 (9.4%) |
Disability Class: Cognitive Difficulty
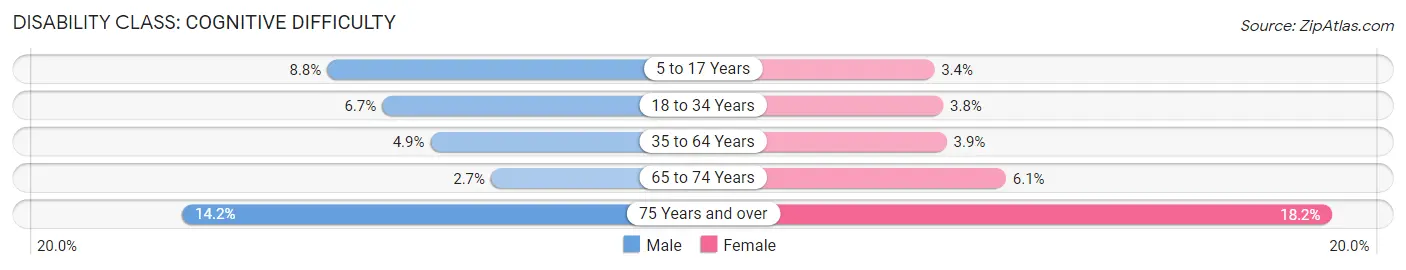
| Age Bracket | Male | Female |
| 5 to 17 Years | 790 (8.8%) | 283 (3.4%) |
| 18 to 34 Years | 981 (6.7%) | 534 (3.8%) |
| 35 to 64 Years | 1,268 (4.9%) | 966 (3.9%) |
| 65 to 74 Years | 153 (2.7%) | 388 (6.1%) |
| 75 Years and over | 399 (14.1%) | 810 (18.2%) |
Disability Class: Ambulatory Difficulty
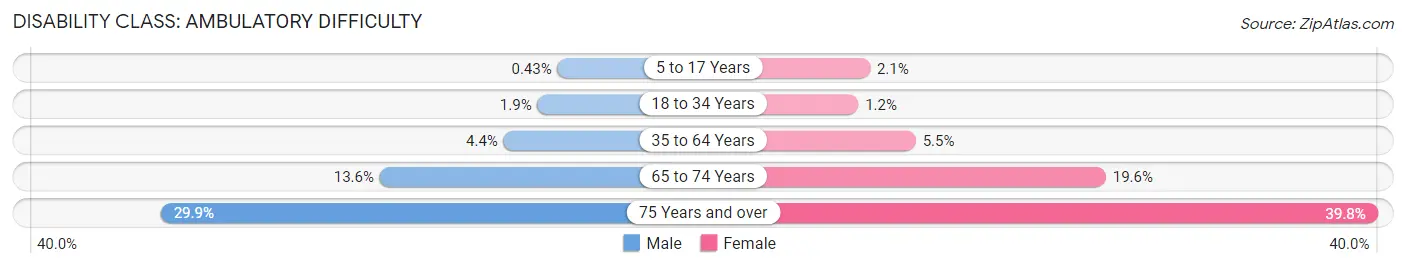
| Age Bracket | Male | Female |
| 5 to 17 Years | 39 (0.4%) | 172 (2.1%) |
| 18 to 34 Years | 280 (1.9%) | 174 (1.2%) |
| 35 to 64 Years | 1,137 (4.4%) | 1,363 (5.5%) |
| 65 to 74 Years | 776 (13.6%) | 1,249 (19.6%) |
| 75 Years and over | 843 (29.9%) | 1,770 (39.8%) |
Disability Class: Self-Care Difficulty
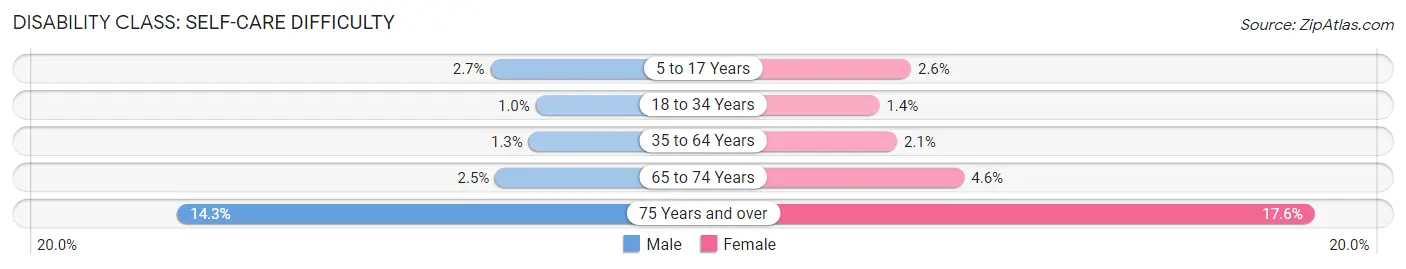
| Age Bracket | Male | Female |
| 5 to 17 Years | 244 (2.7%) | 212 (2.6%) |
| 18 to 34 Years | 150 (1.0%) | 199 (1.4%) |
| 35 to 64 Years | 331 (1.3%) | 508 (2.1%) |
| 65 to 74 Years | 144 (2.5%) | 290 (4.5%) |
| 75 Years and over | 404 (14.3%) | 781 (17.5%) |
Technology Access in Concord
Computing Device Access in Concord
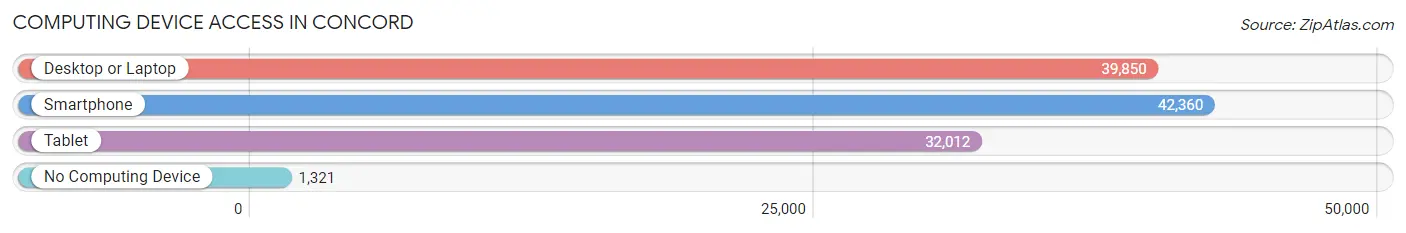
| Device Type | # Households | % Households |
| Desktop or Laptop | 39,850 | 87.4% |
| Smartphone | 42,360 | 92.9% |
| Tablet | 32,012 | 70.2% |
| No Computing Device | 1,321 | 2.9% |
| Total | 45,574 | 100.0% |
Internet Access in Concord
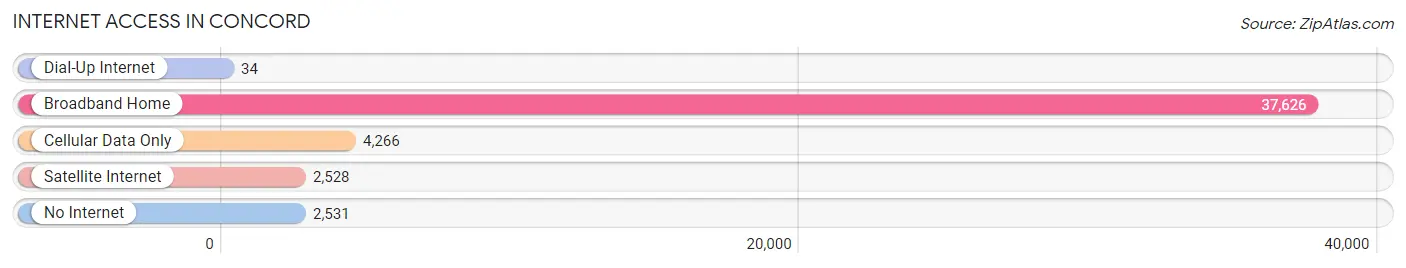
| Internet Type | # Households | % Households |
| Dial-Up Internet | 34 | 0.1% |
| Broadband Home | 37,626 | 82.6% |
| Cellular Data Only | 4,266 | 9.4% |
| Satellite Internet | 2,528 | 5.6% |
| No Internet | 2,531 | 5.6% |
| Total | 45,574 | 100.0% |
Concord Summary
Concord, California is a city located in Contra Costa County, in the San Francisco Bay Area. It is the largest city in the county, with a population of 122,067 as of the 2010 census. The city is situated in the East Bay region of the Bay Area, and is located about 30 miles east of San Francisco.
History
The area that is now Concord was originally inhabited by the Ohlone Native American tribe. The first European settlers arrived in the area in the early 1800s, and the town was officially founded in 1869. The town was named after the Concord grape, which was grown in the area.
In the late 1800s, Concord became a major agricultural center, with many farms and ranches in the area. The town also became a major railroad hub, with the Central Pacific Railroad running through the city.
In the early 1900s, Concord began to experience rapid growth, as the population increased from 1,500 in 1900 to over 10,000 by 1950. This growth was largely due to the expansion of the nearby military bases, as well as the growth of the local economy.
Geography
Concord is located in the East Bay region of the San Francisco Bay Area, about 30 miles east of San Francisco. The city is situated on the Concord Plain, which is a flat, low-lying area that is surrounded by hills. The city is bordered by the cities of Walnut Creek, Pleasant Hill, and Clayton to the north; Martinez and Pleasant Hill to the east; and Pittsburg and Antioch to the south.
The city has a total area of 30.1 square miles, of which 29.9 square miles is land and 0.2 square miles is water. The city is located at an elevation of about 200 feet above sea level.
Economy
Concord is a major economic center in the Bay Area, with a diverse economy that includes retail, manufacturing, healthcare, and government services. The city is home to several major employers, including the Contra Costa County government, the John Muir Health System, and the Concord Naval Weapons Station.
The city is also home to several major shopping centers, including the Sunvalley Shopping Center, the Willows Shopping Center, and the Concord Pavilion.
Demographics
As of the 2010 census, Concord had a population of 122,067. The racial makeup of the city was 57.2% White, 11.3% African American, 0.7% Native American, 16.2% Asian, 0.3% Pacific Islander, 8.7% from other races, and 5.7% from two or more races. Hispanic or Latino of any race were 20.3% of the population.
The median income for a household in the city was $60,945, and the median income for a family was $71,817. The per capita income for the city was $27,837. About 8.3% of families and 11.2% of the population were below the poverty line, including 15.2% of those under age 18 and 6.7% of those age 65 or over.
Common Questions
What is Per Capita Income in Concord?
Per Capita income in Concord is $48,628.
What is the Median Family Income in Concord?
Median Family Income in Concord is $122,125.
What is the Median Household income in Concord?
Median Household Income in Concord is $107,789.
What is Income or Wage Gap in Concord?
Income or Wage Gap in Concord is 24.7%.
Women in Concord earn 75.3 cents for every dollar earned by a man.
What is Family Income Deficit in Concord?
Family Income Deficit in Concord is $12,738.
Families that are below poverty line in Concord earn $12,738 less on average than the poverty threshold level.
What is Inequality or Gini Index in Concord?
Inequality or Gini Index in Concord is 0.43.
What is the Total Population of Concord?
Total Population of Concord is 125,007.
What is the Total Male Population of Concord?
Total Male Population of Concord is 62,319.
What is the Total Female Population of Concord?
Total Female Population of Concord is 62,688.
What is the Ratio of Males per 100 Females in Concord?
There are 99.41 Males per 100 Females in Concord.
What is the Ratio of Females per 100 Males in Concord?
There are 100.59 Females per 100 Males in Concord.
What is the Median Population Age in Concord?
Median Population Age in Concord is 38.8 Years.
What is the Average Family Size in Concord
Average Family Size in Concord is 3.3 People.
What is the Average Household Size in Concord
Average Household Size in Concord is 2.7 People.
How Large is the Labor Force in Concord?
There are 68,472 People in the Labor Forcein in Concord.
What is the Percentage of People in the Labor Force in Concord?
67.1% of People are in the Labor Force in Concord.
What is the Unemployment Rate in Concord?
Unemployment Rate in Concord is 4.9%.