Cities with the Largest Black / African American Community in Iowa
RELATED REPORTS & OPTIONS
Black / African American
Iowa
Compare Cities
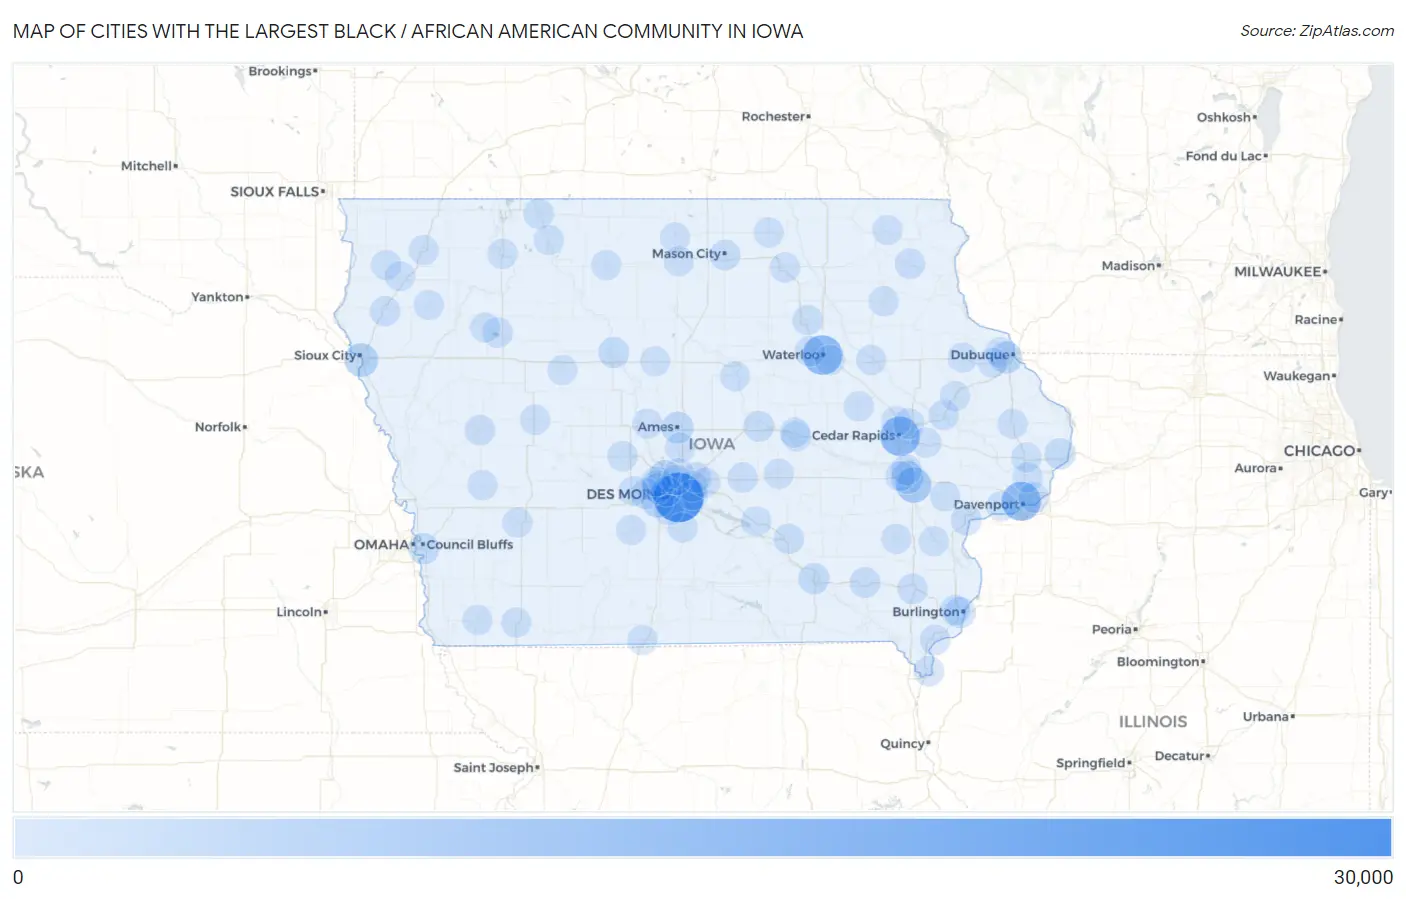
Map of Cities with the Largest Black / African American Community in Iowa
0
30,000
Cities with the Largest Black / African American Community in Iowa
| City | Black / African American | vs State | vs National | |
| 1. | Des Moines | 25,057 | 120,619(20.77%)#1 | 41,288,572(0.06%)#201 |
| 2. | Waterloo | 11,885 | 120,619(9.85%)#2 | 41,288,572(0.03%)#461 |
| 3. | Cedar Rapids | 11,847 | 120,619(9.82%)#3 | 41,288,572(0.03%)#463 |
| 4. | Davenport | 11,195 | 120,619(9.28%)#4 | 41,288,572(0.03%)#488 |
| 5. | Iowa City | 6,359 | 120,619(5.27%)#5 | 41,288,572(0.02%)#857 |
| 6. | Sioux City | 4,452 | 120,619(3.69%)#6 | 41,288,572(0.01%)#1,164 |
| 7. | Coralville | 3,132 | 120,619(2.60%)#7 | 41,288,572(0.01%)#1,563 |
| 8. | West Des Moines | 3,016 | 120,619(2.50%)#8 | 41,288,572(0.01%)#1,614 |
| 9. | Johnston | 2,504 | 120,619(2.08%)#9 | 41,288,572(0.01%)#1,856 |
| 10. | Dubuque | 2,406 | 120,619(1.99%)#10 | 41,288,572(0.01%)#1,920 |
| 11. | Ames | 2,114 | 120,619(1.75%)#11 | 41,288,572(0.01%)#2,124 |
| 12. | Urbandale | 1,975 | 120,619(1.64%)#12 | 41,288,572(0.00%)#2,240 |
| 13. | Burlington | 1,393 | 120,619(1.15%)#13 | 41,288,572(0.00%)#2,809 |
| 14. | Council Bluffs | 1,348 | 120,619(1.12%)#14 | 41,288,572(0.00%)#2,859 |
| 15. | Clinton | 1,277 | 120,619(1.06%)#15 | 41,288,572(0.00%)#2,956 |
| 16. | Fort Dodge | 1,214 | 120,619(1.01%)#16 | 41,288,572(0.00%)#3,032 |
| 17. | Ottumwa | 1,113 | 120,619(0.92%)#17 | 41,288,572(0.00%)#3,207 |
| 18. | Marion | 1,076 | 120,619(0.89%)#18 | 41,288,572(0.00%)#3,272 |
| 19. | Muscatine | 961 | 120,619(0.80%)#19 | 41,288,572(0.00%)#3,500 |
| 20. | Clive | 944 | 120,619(0.78%)#20 | 41,288,572(0.00%)#3,537 |
| 21. | North Liberty | 897 | 120,619(0.74%)#21 | 41,288,572(0.00%)#3,638 |
| 22. | Waukee | 852 | 120,619(0.71%)#22 | 41,288,572(0.00%)#3,750 |
| 23. | Marshalltown | 798 | 120,619(0.66%)#23 | 41,288,572(0.00%)#3,890 |
| 24. | Ankeny | 748 | 120,619(0.62%)#24 | 41,288,572(0.00%)#4,004 |
| 25. | Fairfield | 748 | 120,619(0.62%)#25 | 41,288,572(0.00%)#4,006 |
| 26. | Mason City | 746 | 120,619(0.62%)#26 | 41,288,572(0.00%)#4,015 |
| 27. | Altoona | 674 | 120,619(0.56%)#27 | 41,288,572(0.00%)#4,236 |
| 28. | Bettendorf | 670 | 120,619(0.56%)#28 | 41,288,572(0.00%)#4,248 |
| 29. | Cedar Falls | 527 | 120,619(0.44%)#29 | 41,288,572(0.00%)#4,805 |
| 30. | West Burlington | 523 | 120,619(0.43%)#30 | 41,288,572(0.00%)#4,821 |
| 31. | Pleasant Hill | 506 | 120,619(0.42%)#31 | 41,288,572(0.00%)#4,892 |
| 32. | Mount Pleasant | 482 | 120,619(0.40%)#32 | 41,288,572(0.00%)#4,995 |
| 33. | Storm Lake | 468 | 120,619(0.39%)#33 | 41,288,572(0.00%)#5,071 |
| 34. | Bondurant | 451 | 120,619(0.37%)#34 | 41,288,572(0.00%)#5,144 |
| 35. | Keokuk | 436 | 120,619(0.36%)#35 | 41,288,572(0.00%)#5,227 |
| 36. | Fort Madison | 410 | 120,619(0.34%)#36 | 41,288,572(0.00%)#5,366 |
| 37. | Le Mars | 388 | 120,619(0.32%)#37 | 41,288,572(0.00%)#5,498 |
| 38. | Anamosa | 353 | 120,619(0.29%)#38 | 41,288,572(0.00%)#5,741 |
| 39. | Newton | 347 | 120,619(0.29%)#39 | 41,288,572(0.00%)#5,769 |
| 40. | Denison | 344 | 120,619(0.29%)#40 | 41,288,572(0.00%)#5,795 |
| 41. | Waverly | 303 | 120,619(0.25%)#41 | 41,288,572(0.00%)#6,121 |
| 42. | Perry | 302 | 120,619(0.25%)#42 | 41,288,572(0.00%)#6,132 |
| 43. | Oskaloosa | 293 | 120,619(0.24%)#43 | 41,288,572(0.00%)#6,198 |
| 44. | Estherville | 287 | 120,619(0.24%)#44 | 41,288,572(0.00%)#6,253 |
| 45. | Windsor Heights | 280 | 120,619(0.23%)#45 | 41,288,572(0.00%)#6,312 |
| 46. | Postville | 262 | 120,619(0.22%)#46 | 41,288,572(0.00%)#6,461 |
| 47. | Hiawatha | 253 | 120,619(0.21%)#47 | 41,288,572(0.00%)#6,544 |
| 48. | Evansdale | 239 | 120,619(0.20%)#48 | 41,288,572(0.00%)#6,683 |
| 49. | Grinnell | 211 | 120,619(0.17%)#49 | 41,288,572(0.00%)#6,995 |
| 50. | Carroll | 210 | 120,619(0.17%)#50 | 41,288,572(0.00%)#7,006 |
| 51. | Asbury | 197 | 120,619(0.16%)#51 | 41,288,572(0.00%)#7,174 |
| 52. | Tiffin | 189 | 120,619(0.16%)#52 | 41,288,572(0.00%)#7,287 |
| 53. | Clarinda | 167 | 120,619(0.14%)#53 | 41,288,572(0.00%)#7,642 |
| 54. | Boone | 166 | 120,619(0.14%)#54 | 41,288,572(0.00%)#7,659 |
| 55. | Winterset | 163 | 120,619(0.14%)#55 | 41,288,572(0.00%)#7,710 |
| 56. | Webster City | 162 | 120,619(0.13%)#56 | 41,288,572(0.00%)#7,734 |
| 57. | Park View | 158 | 120,619(0.13%)#57 | 41,288,572(0.00%)#7,800 |
| 58. | Grimes | 157 | 120,619(0.13%)#58 | 41,288,572(0.00%)#7,812 |
| 59. | Saylorville | 156 | 120,619(0.13%)#59 | 41,288,572(0.00%)#7,840 |
| 60. | Indianola | 151 | 120,619(0.13%)#60 | 41,288,572(0.00%)#7,912 |
| 61. | Charles City | 147 | 120,619(0.12%)#61 | 41,288,572(0.00%)#7,986 |
| 62. | Marcus | 143 | 120,619(0.12%)#62 | 41,288,572(0.00%)#8,074 |
| 63. | Independence | 134 | 120,619(0.11%)#63 | 41,288,572(0.00%)#8,241 |
| 64. | Sheldon | 131 | 120,619(0.11%)#64 | 41,288,572(0.00%)#8,314 |
| 65. | Alta | 131 | 120,619(0.11%)#65 | 41,288,572(0.00%)#8,320 |
| 66. | Norwalk | 127 | 120,619(0.11%)#66 | 41,288,572(0.00%)#8,407 |
| 67. | Maquoketa | 125 | 120,619(0.10%)#67 | 41,288,572(0.00%)#8,452 |
| 68. | West Liberty | 122 | 120,619(0.10%)#68 | 41,288,572(0.00%)#8,532 |
| 69. | Graettinger | 112 | 120,619(0.09%)#69 | 41,288,572(0.00%)#8,788 |
| 70. | Harlan | 105 | 120,619(0.09%)#70 | 41,288,572(0.00%)#8,948 |
| 71. | Mount Vernon | 105 | 120,619(0.09%)#71 | 41,288,572(0.00%)#8,949 |
| 72. | Huxley | 104 | 120,619(0.09%)#72 | 41,288,572(0.00%)#8,969 |
| 73. | Atlantic | 98 | 120,619(0.08%)#73 | 41,288,572(0.00%)#9,120 |
| 74. | Lamoni | 96 | 120,619(0.08%)#74 | 41,288,572(0.00%)#9,182 |
| 75. | Monticello | 94 | 120,619(0.08%)#75 | 41,288,572(0.00%)#9,229 |
| 76. | Dyersville | 92 | 120,619(0.08%)#76 | 41,288,572(0.00%)#9,285 |
| 77. | Fayette | 88 | 120,619(0.07%)#77 | 41,288,572(0.00%)#9,420 |
| 78. | Washington | 86 | 120,619(0.07%)#78 | 41,288,572(0.00%)#9,462 |
| 79. | Decorah | 85 | 120,619(0.07%)#79 | 41,288,572(0.00%)#9,495 |
| 80. | Mitchellville | 82 | 120,619(0.07%)#80 | 41,288,572(0.00%)#9,596 |
| 81. | Forest City | 81 | 120,619(0.07%)#81 | 41,288,572(0.00%)#9,616 |
| 82. | Garner | 80 | 120,619(0.07%)#82 | 41,288,572(0.00%)#9,655 |
| 83. | Peosta | 75 | 120,619(0.06%)#83 | 41,288,572(0.00%)#9,836 |
| 84. | Tama | 70 | 120,619(0.06%)#84 | 41,288,572(0.00%)#10,024 |
| 85. | Pella | 69 | 120,619(0.06%)#85 | 41,288,572(0.00%)#10,048 |
| 86. | Vinton | 69 | 120,619(0.06%)#86 | 41,288,572(0.00%)#10,062 |
| 87. | Spencer | 67 | 120,619(0.06%)#87 | 41,288,572(0.00%)#10,143 |
| 88. | Rockwell City | 62 | 120,619(0.05%)#88 | 41,288,572(0.00%)#10,359 |
| 89. | Toledo | 62 | 120,619(0.05%)#89 | 41,288,572(0.00%)#10,363 |
| 90. | Algona | 61 | 120,619(0.05%)#90 | 41,288,572(0.00%)#10,392 |
| 91. | Osage | 57 | 120,619(0.05%)#91 | 41,288,572(0.00%)#10,576 |
| 92. | Eldora | 55 | 120,619(0.05%)#92 | 41,288,572(0.00%)#10,677 |
| 93. | Columbus Junction | 55 | 120,619(0.05%)#93 | 41,288,572(0.00%)#10,683 |
| 94. | Adel | 54 | 120,619(0.04%)#94 | 41,288,572(0.00%)#10,712 |
| 95. | Sioux Center | 53 | 120,619(0.04%)#95 | 41,288,572(0.00%)#10,774 |
| 96. | Shenandoah | 53 | 120,619(0.04%)#96 | 41,288,572(0.00%)#10,778 |
| 97. | Kent Estates | 52 | 120,619(0.04%)#97 | 41,288,572(0.00%)#10,840 |
| 98. | Dewitt | 50 | 120,619(0.04%)#98 | 41,288,572(0.00%)#10,932 |
| 99. | Orange City | 49 | 120,619(0.04%)#99 | 41,288,572(0.00%)#10,967 |
| 100. | Blue Grass | 49 | 120,619(0.04%)#100 | 41,288,572(0.00%)#10,994 |
Common Questions
What are the Top 10 Cities with the Largest Black / African American Community in Iowa?
Top 10 Cities with the Largest Black / African American Community in Iowa are:
#1
25,057
#2
11,885
#3
11,847
#4
11,195
#5
6,359
#6
4,452
#7
3,132
#8
3,016
#9
2,504
#10
2,406
What city has the Largest Black / African American Community in Iowa?
Des Moines has the Largest Black / African American Community in Iowa with 25,057.
What is the Total Black / African American Population in the State of Iowa?
Total Black / African American Population in Iowa is 120,619.
What is the Total Black / African American Population in the United States?
Total Black / African American Population in the United States is 41,288,572.