Cities with the Largest Black / African American Community in Kentucky
RELATED REPORTS & OPTIONS
Black / African American
Kentucky
Compare Cities
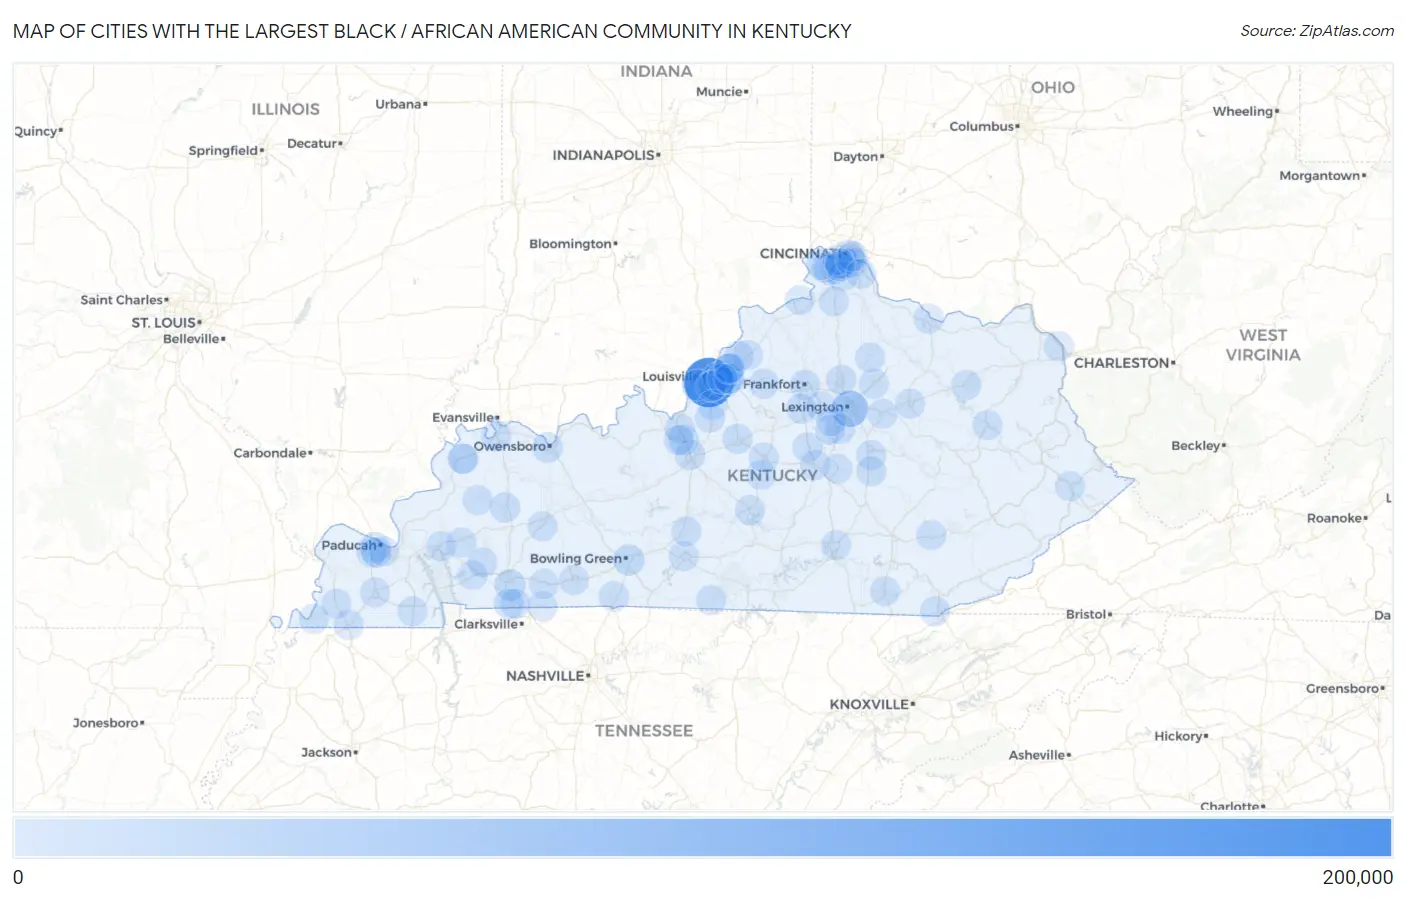
Map of Cities with the Largest Black / African American Community in Kentucky
0
200,000
Cities with the Largest Black / African American Community in Kentucky
| City | Black / African American | vs State | vs National | |
| 1. | Louisville | 150,640 | 360,184(41.82%)#1 | 41,288,572(0.36%)#21 |
| 2. | Lexington | 47,240 | 360,184(13.12%)#2 | 41,288,572(0.11%)#98 |
| 3. | Bowling Green | 9,360 | 360,184(2.60%)#3 | 41,288,572(0.02%)#595 |
| 4. | Hopkinsville | 8,980 | 360,184(2.49%)#4 | 41,288,572(0.02%)#627 |
| 5. | Shively | 8,260 | 360,184(2.29%)#5 | 41,288,572(0.02%)#684 |
| 6. | Radcliff | 6,576 | 360,184(1.83%)#6 | 41,288,572(0.02%)#833 |
| 7. | Paducah | 5,871 | 360,184(1.63%)#7 | 41,288,572(0.01%)#920 |
| 8. | Owensboro | 4,251 | 360,184(1.18%)#8 | 41,288,572(0.01%)#1,217 |
| 9. | Covington | 3,929 | 360,184(1.09%)#9 | 41,288,572(0.01%)#1,312 |
| 10. | Jeffersontown | 3,568 | 360,184(0.99%)#10 | 41,288,572(0.01%)#1,407 |
| 11. | Elizabethtown | 3,505 | 360,184(0.97%)#11 | 41,288,572(0.01%)#1,422 |
| 12. | Frankfort | 3,466 | 360,184(0.96%)#12 | 41,288,572(0.01%)#1,435 |
| 13. | Henderson | 3,060 | 360,184(0.85%)#13 | 41,288,572(0.01%)#1,596 |
| 14. | Madisonville | 2,349 | 360,184(0.65%)#14 | 41,288,572(0.01%)#1,956 |
| 15. | Georgetown | 2,218 | 360,184(0.62%)#15 | 41,288,572(0.01%)#2,034 |
| 16. | Richmond | 2,126 | 360,184(0.59%)#16 | 41,288,572(0.01%)#2,114 |
| 17. | Danville | 2,089 | 360,184(0.58%)#17 | 41,288,572(0.01%)#2,145 |
| 18. | Lyndon | 2,089 | 360,184(0.58%)#18 | 41,288,572(0.01%)#2,146 |
| 19. | Fort Campbell North | 2,001 | 360,184(0.56%)#19 | 41,288,572(0.00%)#2,216 |
| 20. | Florence | 1,922 | 360,184(0.53%)#20 | 41,288,572(0.00%)#2,286 |
| 21. | Oak Grove | 1,871 | 360,184(0.52%)#21 | 41,288,572(0.00%)#2,330 |
| 22. | Bardstown | 1,745 | 360,184(0.48%)#22 | 41,288,572(0.00%)#2,427 |
| 23. | Fort Knox | 1,612 | 360,184(0.45%)#23 | 41,288,572(0.00%)#2,547 |
| 24. | Shelbyville | 1,549 | 360,184(0.43%)#24 | 41,288,572(0.00%)#2,612 |
| 25. | Nicholasville | 1,525 | 360,184(0.42%)#25 | 41,288,572(0.00%)#2,639 |
| 26. | Franklin | 1,322 | 360,184(0.37%)#26 | 41,288,572(0.00%)#2,891 |
| 27. | Winchester | 1,243 | 360,184(0.35%)#27 | 41,288,572(0.00%)#2,988 |
| 28. | Mayfield | 1,220 | 360,184(0.34%)#28 | 41,288,572(0.00%)#3,017 |
| 29. | Glasgow | 1,149 | 360,184(0.32%)#29 | 41,288,572(0.00%)#3,140 |
| 30. | Murray | 1,109 | 360,184(0.31%)#30 | 41,288,572(0.00%)#3,219 |
| 31. | Campbellsville | 1,062 | 360,184(0.29%)#31 | 41,288,572(0.00%)#3,308 |
| 32. | Worthington Hills | 1,062 | 360,184(0.29%)#32 | 41,288,572(0.00%)#3,310 |
| 33. | Newport | 1,057 | 360,184(0.29%)#33 | 41,288,572(0.00%)#3,319 |
| 34. | Russellville | 1,004 | 360,184(0.28%)#34 | 41,288,572(0.00%)#3,420 |
| 35. | Vine Grove | 944 | 360,184(0.26%)#35 | 41,288,572(0.00%)#3,538 |
| 36. | Lebanon | 930 | 360,184(0.26%)#36 | 41,288,572(0.00%)#3,567 |
| 37. | St Matthews | 875 | 360,184(0.24%)#37 | 41,288,572(0.00%)#3,688 |
| 38. | Erlanger | 870 | 360,184(0.24%)#38 | 41,288,572(0.00%)#3,707 |
| 39. | Fulton | 859 | 360,184(0.24%)#39 | 41,288,572(0.00%)#3,733 |
| 40. | Paris | 831 | 360,184(0.23%)#40 | 41,288,572(0.00%)#3,802 |
| 41. | West Buechel | 830 | 360,184(0.23%)#41 | 41,288,572(0.00%)#3,807 |
| 42. | Middletown | 779 | 360,184(0.22%)#42 | 41,288,572(0.00%)#3,947 |
| 43. | Princeton | 722 | 360,184(0.20%)#43 | 41,288,572(0.00%)#4,085 |
| 44. | Versailles | 707 | 360,184(0.20%)#44 | 41,288,572(0.00%)#4,127 |
| 45. | Elsmere | 707 | 360,184(0.20%)#45 | 41,288,572(0.00%)#4,128 |
| 46. | Lawrenceburg | 682 | 360,184(0.19%)#46 | 41,288,572(0.00%)#4,209 |
| 47. | Hickman | 660 | 360,184(0.18%)#47 | 41,288,572(0.00%)#4,279 |
| 48. | Oakbrook | 636 | 360,184(0.18%)#48 | 41,288,572(0.00%)#4,360 |
| 49. | Maysville | 607 | 360,184(0.17%)#49 | 41,288,572(0.00%)#4,457 |
| 50. | Guthrie | 607 | 360,184(0.17%)#50 | 41,288,572(0.00%)#4,460 |
| 51. | Breckinridge Center | 575 | 360,184(0.16%)#51 | 41,288,572(0.00%)#4,611 |
| 52. | Harrodsburg | 563 | 360,184(0.16%)#52 | 41,288,572(0.00%)#4,642 |
| 53. | Springfield | 554 | 360,184(0.15%)#53 | 41,288,572(0.00%)#4,677 |
| 54. | La Grange | 539 | 360,184(0.15%)#54 | 41,288,572(0.00%)#4,748 |
| 55. | Hillview | 474 | 360,184(0.13%)#55 | 41,288,572(0.00%)#5,040 |
| 56. | Horse Cave | 470 | 360,184(0.13%)#56 | 41,288,572(0.00%)#5,063 |
| 57. | Berea | 451 | 360,184(0.13%)#57 | 41,288,572(0.00%)#5,142 |
| 58. | Crescent Springs | 449 | 360,184(0.12%)#58 | 41,288,572(0.00%)#5,160 |
| 59. | West Liberty | 442 | 360,184(0.12%)#59 | 41,288,572(0.00%)#5,204 |
| 60. | Somerset | 437 | 360,184(0.12%)#60 | 41,288,572(0.00%)#5,221 |
| 61. | Providence | 407 | 360,184(0.11%)#61 | 41,288,572(0.00%)#5,387 |
| 62. | Douglass Hills | 364 | 360,184(0.10%)#62 | 41,288,572(0.00%)#5,645 |
| 63. | Coldstream | 364 | 360,184(0.10%)#63 | 41,288,572(0.00%)#5,649 |
| 64. | Clinton | 362 | 360,184(0.10%)#64 | 41,288,572(0.00%)#5,662 |
| 65. | Manchester | 349 | 360,184(0.10%)#65 | 41,288,572(0.00%)#5,760 |
| 66. | Massac | 343 | 360,184(0.10%)#66 | 41,288,572(0.00%)#5,804 |
| 67. | Independence | 342 | 360,184(0.09%)#67 | 41,288,572(0.00%)#5,808 |
| 68. | Lancaster | 341 | 360,184(0.09%)#68 | 41,288,572(0.00%)#5,820 |
| 69. | Eddyville | 338 | 360,184(0.09%)#69 | 41,288,572(0.00%)#5,841 |
| 70. | Burlington | 329 | 360,184(0.09%)#70 | 41,288,572(0.00%)#5,898 |
| 71. | Middlesborough | 310 | 360,184(0.09%)#71 | 41,288,572(0.00%)#6,064 |
| 72. | Ashland | 309 | 360,184(0.09%)#72 | 41,288,572(0.00%)#6,071 |
| 73. | Morganfield | 299 | 360,184(0.08%)#73 | 41,288,572(0.00%)#6,160 |
| 74. | Mount Sterling | 298 | 360,184(0.08%)#74 | 41,288,572(0.00%)#6,162 |
| 75. | Farley | 295 | 360,184(0.08%)#75 | 41,288,572(0.00%)#6,189 |
| 76. | Tompkinsville | 292 | 360,184(0.08%)#76 | 41,288,572(0.00%)#6,208 |
| 77. | Highland Heights | 291 | 360,184(0.08%)#77 | 41,288,572(0.00%)#6,216 |
| 78. | Southgate | 291 | 360,184(0.08%)#78 | 41,288,572(0.00%)#6,218 |
| 79. | Elkton | 289 | 360,184(0.08%)#79 | 41,288,572(0.00%)#6,230 |
| 80. | Greenville | 273 | 360,184(0.08%)#80 | 41,288,572(0.00%)#6,381 |
| 81. | Wilmore | 270 | 360,184(0.07%)#81 | 41,288,572(0.00%)#6,400 |
| 82. | Morehead | 266 | 360,184(0.07%)#82 | 41,288,572(0.00%)#6,429 |
| 83. | Edgewood | 265 | 360,184(0.07%)#83 | 41,288,572(0.00%)#6,436 |
| 84. | Fort Thomas | 261 | 360,184(0.07%)#84 | 41,288,572(0.00%)#6,465 |
| 85. | Pikeville | 252 | 360,184(0.07%)#85 | 41,288,572(0.00%)#6,556 |
| 86. | Shepherdsville | 242 | 360,184(0.07%)#86 | 41,288,572(0.00%)#6,653 |
| 87. | Cadiz | 242 | 360,184(0.07%)#87 | 41,288,572(0.00%)#6,658 |
| 88. | Watterson Park | 240 | 360,184(0.07%)#88 | 41,288,572(0.00%)#6,673 |
| 89. | Cerulean | 232 | 360,184(0.06%)#89 | 41,288,572(0.00%)#6,762 |
| 90. | Buckner | 222 | 360,184(0.06%)#90 | 41,288,572(0.00%)#6,857 |
| 91. | Crittenden | 211 | 360,184(0.06%)#91 | 41,288,572(0.00%)#6,999 |
| 92. | Cynthiana | 210 | 360,184(0.06%)#92 | 41,288,572(0.00%)#7,009 |
| 93. | Crestview Hills | 210 | 360,184(0.06%)#93 | 41,288,572(0.00%)#7,016 |
| 94. | Fincastle | 210 | 360,184(0.06%)#94 | 41,288,572(0.00%)#7,019 |
| 95. | Hendron | 206 | 360,184(0.06%)#95 | 41,288,572(0.00%)#7,064 |
| 96. | Warsaw | 206 | 360,184(0.06%)#96 | 41,288,572(0.00%)#7,068 |
| 97. | Williamsburg | 203 | 360,184(0.06%)#97 | 41,288,572(0.00%)#7,104 |
| 98. | Alexandria | 197 | 360,184(0.05%)#98 | 41,288,572(0.00%)#7,172 |
| 99. | Keene | 197 | 360,184(0.05%)#99 | 41,288,572(0.00%)#7,181 |
| 100. | Hurstbourne | 194 | 360,184(0.05%)#100 | 41,288,572(0.00%)#7,211 |
Common Questions
What are the Top 10 Cities with the Largest Black / African American Community in Kentucky?
Top 10 Cities with the Largest Black / African American Community in Kentucky are:
#1
150,640
#2
47,240
#3
9,360
#4
8,980
#5
8,260
#6
6,576
#7
5,871
#8
4,251
#9
3,929
#10
3,568
What city has the Largest Black / African American Community in Kentucky?
Louisville has the Largest Black / African American Community in Kentucky with 150,640.
What is the Total Black / African American Population in the State of Kentucky?
Total Black / African American Population in Kentucky is 360,184.
What is the Total Black / African American Population in the United States?
Total Black / African American Population in the United States is 41,288,572.