Bakersfield, CA Map & Demographics
Bakersfield Map
Bakersfield Overview
$31,892
PER CAPITA INCOME
$81,672
AVG FAMILY INCOME
$73,827
AVG HOUSEHOLD INCOME
31.5%
WAGE / INCOME GAP [ % ]
68.5¢/ $1
WAGE / INCOME GAP [ $ ]
$11,336
FAMILY INCOME DEFICIT
0.46
INEQUALITY / GINI INDEX
404,321
TOTAL POPULATION
201,457
MALE POPULATION
202,864
FEMALE POPULATION
99.31
MALES / 100 FEMALES
100.70
FEMALES / 100 MALES
31.5
MEDIAN AGE
3.7
AVG FAMILY SIZE
3.2
AVG HOUSEHOLD SIZE
187,382
LABOR FORCE [ PEOPLE ]
63.1%
PERCENT IN LABOR FORCE
7.1%
UNEMPLOYMENT RATE
Income in Bakersfield
Income Overview in Bakersfield
Per Capita Income in Bakersfield is $31,892, while median incomes of families and households are $81,672 and $73,827 respectively.
| Characteristic | Number | Measure |
| Per Capita Income | 404,321 | $31,892 |
| Median Family Income | 94,152 | $81,672 |
| Mean Family Income | 94,152 | $108,359 |
| Median Household Income | 124,744 | $73,827 |
| Mean Household Income | 124,744 | $99,270 |
| Income Deficit | 94,152 | $11,336 |
| Wage / Income Gap (%) | 404,321 | 31.52% |
| Wage / Income Gap ($) | 404,321 | 68.48¢ per $1 |
| Gini / Inequality Index | 404,321 | 0.46 |
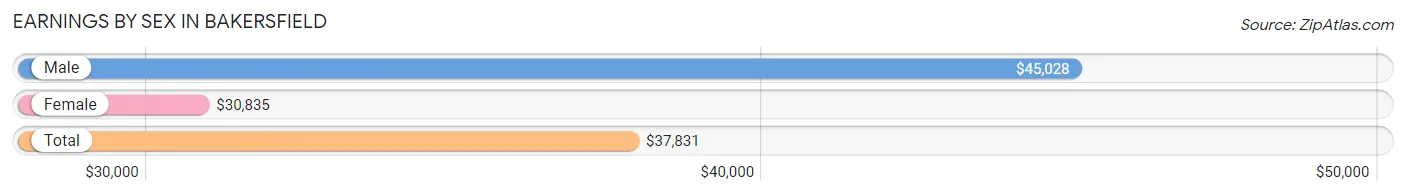
Earnings by Sex in Bakersfield
Average Earnings in Bakersfield are $37,831, $45,028 for men and $30,835 for women, a difference of 31.5%.
| Sex | Number | Average Earnings |
| Male | 104,526 (54.9%) | $45,028 |
| Female | 85,841 (45.1%) | $30,835 |
| Total | 190,367 (100.0%) | $37,831 |
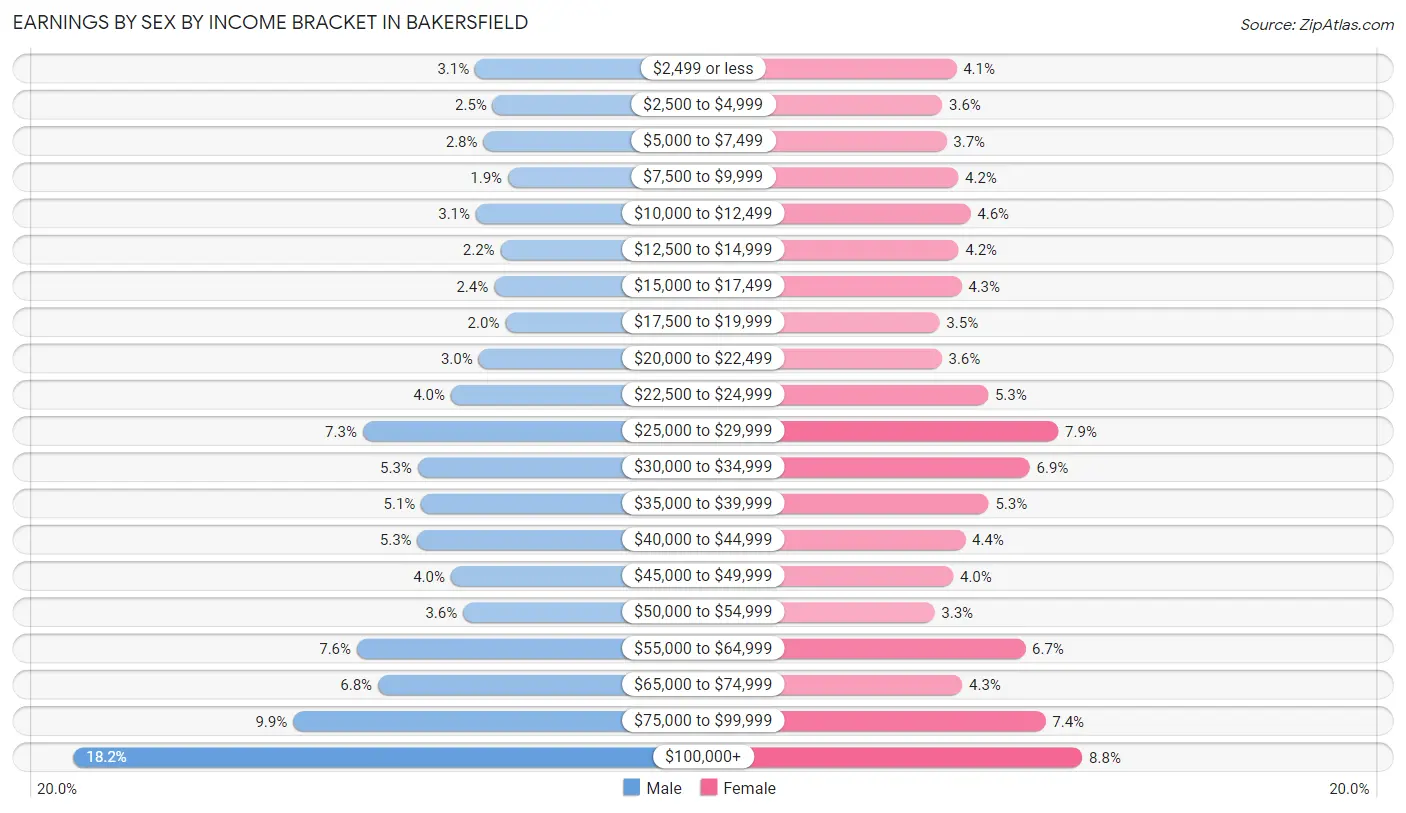
Earnings by Sex by Income Bracket in Bakersfield
The most common earnings brackets in Bakersfield are $100,000+ for men (18,993 | 18.2%) and $100,000+ for women (7,569 | 8.8%).
| Income | Male | Female |
| $2,499 or less | 3,265 (3.1%) | 3,517 (4.1%) |
| $2,500 to $4,999 | 2,572 (2.5%) | 3,066 (3.6%) |
| $5,000 to $7,499 | 2,942 (2.8%) | 3,200 (3.7%) |
| $7,500 to $9,999 | 1,971 (1.9%) | 3,581 (4.2%) |
| $10,000 to $12,499 | 3,225 (3.1%) | 3,974 (4.6%) |
| $12,500 to $14,999 | 2,271 (2.2%) | 3,586 (4.2%) |
| $15,000 to $17,499 | 2,514 (2.4%) | 3,683 (4.3%) |
| $17,500 to $19,999 | 2,079 (2.0%) | 2,980 (3.5%) |
| $20,000 to $22,499 | 3,127 (3.0%) | 3,047 (3.5%) |
| $22,500 to $24,999 | 4,208 (4.0%) | 4,545 (5.3%) |
| $25,000 to $29,999 | 7,659 (7.3%) | 6,797 (7.9%) |
| $30,000 to $34,999 | 5,513 (5.3%) | 5,880 (6.9%) |
| $35,000 to $39,999 | 5,372 (5.1%) | 4,557 (5.3%) |
| $40,000 to $44,999 | 5,515 (5.3%) | 3,799 (4.4%) |
| $45,000 to $49,999 | 4,217 (4.0%) | 3,414 (4.0%) |
| $50,000 to $54,999 | 3,732 (3.6%) | 2,817 (3.3%) |
| $55,000 to $64,999 | 7,887 (7.5%) | 5,734 (6.7%) |
| $65,000 to $74,999 | 7,070 (6.8%) | 3,705 (4.3%) |
| $75,000 to $99,999 | 10,394 (9.9%) | 6,390 (7.4%) |
| $100,000+ | 18,993 (18.2%) | 7,569 (8.8%) |
| Total | 104,526 (100.0%) | 85,841 (100.0%) |
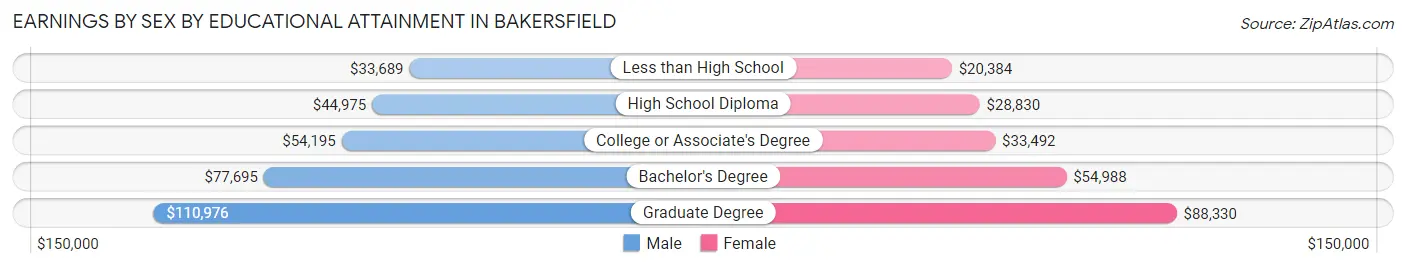
Earnings by Sex by Educational Attainment in Bakersfield
Average earnings in Bakersfield are $52,929 for men and $36,037 for women, a difference of 31.9%. Men with an educational attainment of graduate degree enjoy the highest average annual earnings of $110,976, while those with less than high school education earn the least with $33,689. Women with an educational attainment of graduate degree earn the most with the average annual earnings of $88,330, while those with less than high school education have the smallest earnings of $20,384.
| Educational Attainment | Male Income | Female Income |
| Less than High School | $33,689 | $20,384 |
| High School Diploma | $44,975 | $28,830 |
| College or Associate's Degree | $54,195 | $33,492 |
| Bachelor's Degree | $77,695 | $54,988 |
| Graduate Degree | $110,976 | $88,330 |
| Total | $52,929 | $36,037 |
Family Income in Bakersfield
Family Income Brackets in Bakersfield
According to the Bakersfield family income data, there are 17,983 families falling into the $100,000 to $149,999 income range, which is the most common income bracket and makes up 19.1% of all families. Conversely, the $10,000 to $14,999 income bracket is the least frequent group with only 2,542 families (2.7%) belonging to this category.
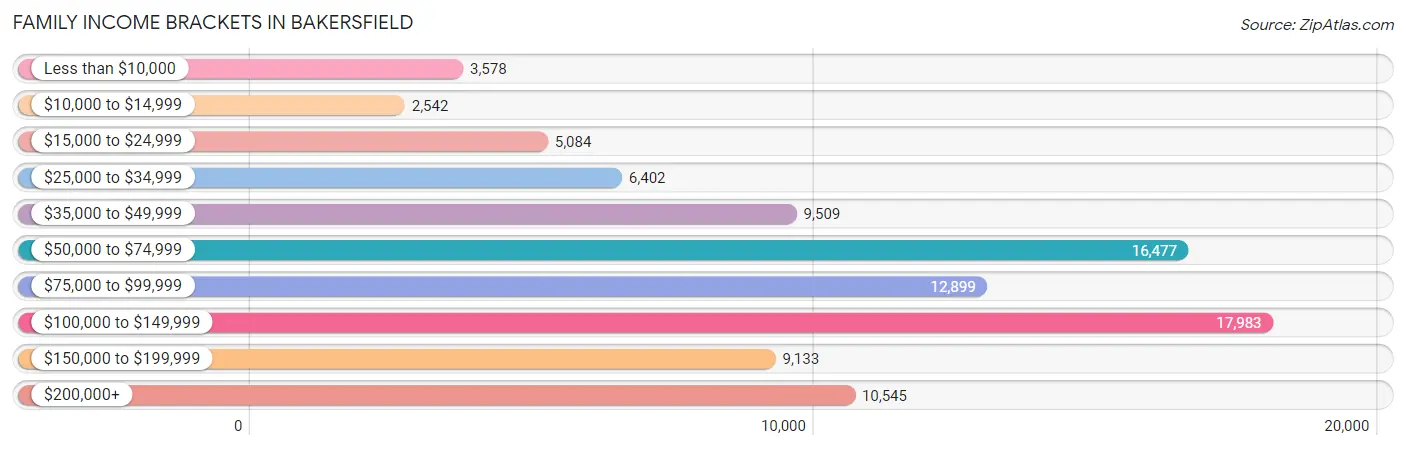
| Income Bracket | # Families | % Families |
| Less than $10,000 | 3,578 | 3.8% |
| $10,000 to $14,999 | 2,542 | 2.7% |
| $15,000 to $24,999 | 5,084 | 5.4% |
| $25,000 to $34,999 | 6,402 | 6.8% |
| $35,000 to $49,999 | 9,509 | 10.1% |
| $50,000 to $74,999 | 16,477 | 17.5% |
| $75,000 to $99,999 | 12,899 | 13.7% |
| $100,000 to $149,999 | 17,983 | 19.1% |
| $150,000 to $199,999 | 9,133 | 9.7% |
| $200,000+ | 10,545 | 11.2% |
Family Income by Famaliy Size in Bakersfield
4-person families (21,002 | 22.3%) account for the highest median family income in Bakersfield with $93,957 per family, while 2-person families (33,471 | 35.5%) have the highest median income of $37,000 per family member.
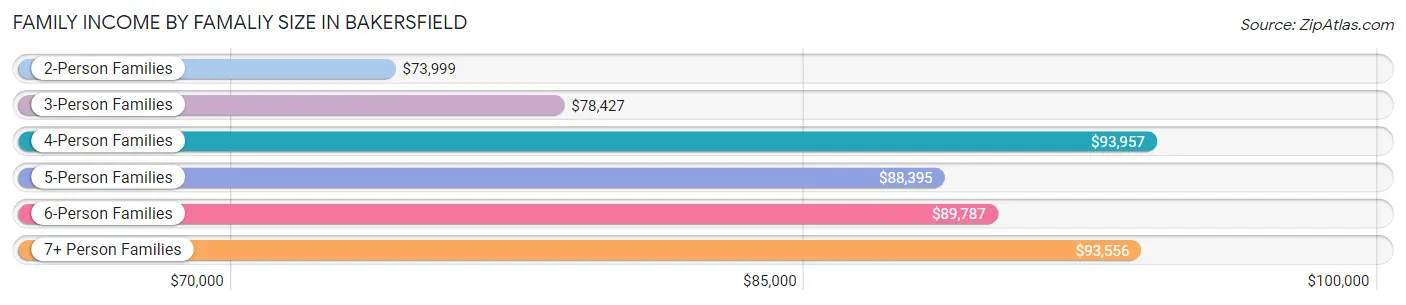
| Income Bracket | # Families | Median Income |
| 2-Person Families | 33,471 (35.5%) | $73,999 |
| 3-Person Families | 20,031 (21.3%) | $78,427 |
| 4-Person Families | 21,002 (22.3%) | $93,957 |
| 5-Person Families | 10,985 (11.7%) | $88,395 |
| 6-Person Families | 5,363 (5.7%) | $89,787 |
| 7+ Person Families | 3,300 (3.5%) | $93,556 |
| Total | 94,152 (100.0%) | $81,672 |
Family Income by Number of Earners in Bakersfield
The median family income in Bakersfield is $81,672, with families comprising 3+ earners (11,285) having the highest median family income of $129,116, while families with no earners (11,196) have the lowest median family income of $34,199, accounting for 12.0% and 11.9% of families, respectively.
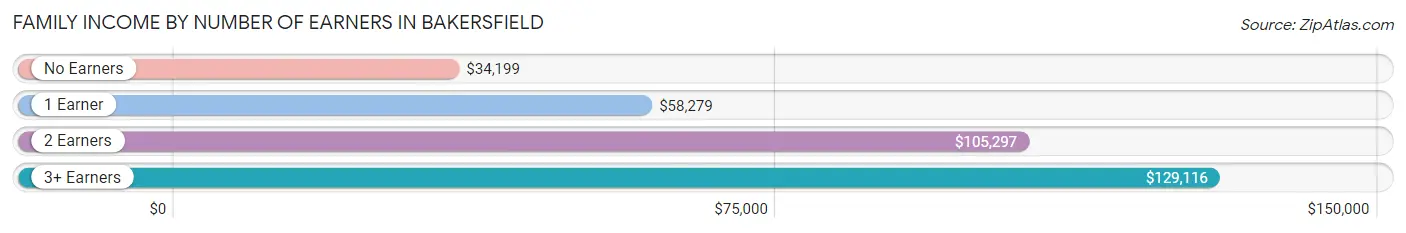
| Number of Earners | # Families | Median Income |
| No Earners | 11,196 (11.9%) | $34,199 |
| 1 Earner | 34,478 (36.6%) | $58,279 |
| 2 Earners | 37,193 (39.5%) | $105,297 |
| 3+ Earners | 11,285 (12.0%) | $129,116 |
| Total | 94,152 (100.0%) | $81,672 |
Household Income in Bakersfield
Household Income Brackets in Bakersfield
With 22,454 households falling in the category, the $100,000 to $149,999 income range is the most frequent in Bakersfield, accounting for 18.0% of all households. In contrast, only 5,364 households (4.3%) fall into the $10,000 to $14,999 income bracket, making it the least populous group.
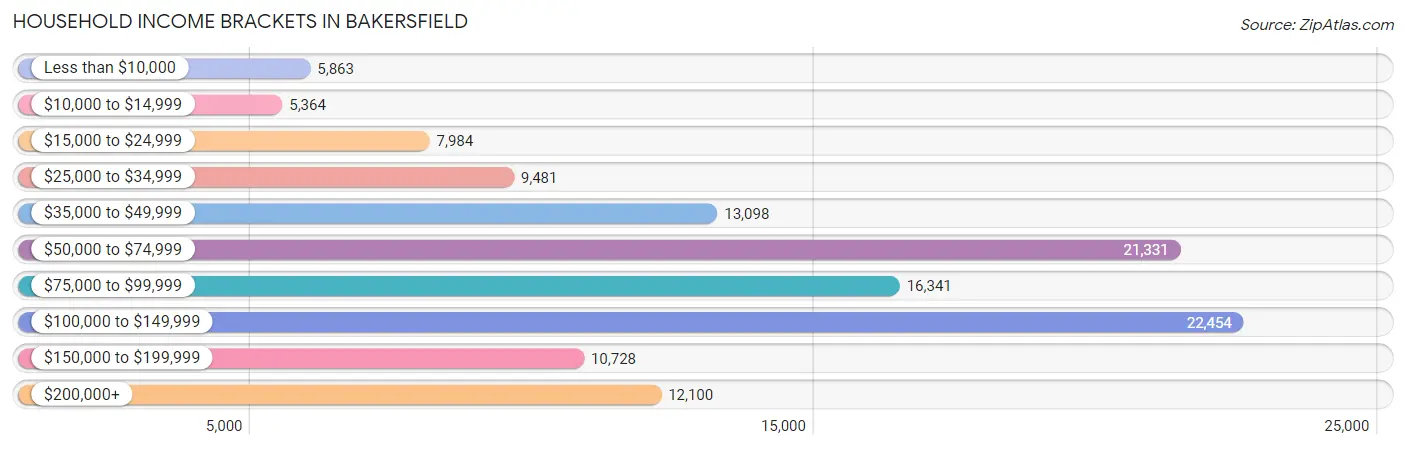
| Income Bracket | # Households | % Households |
| Less than $10,000 | 5,863 | 4.7% |
| $10,000 to $14,999 | 5,364 | 4.3% |
| $15,000 to $24,999 | 7,984 | 6.4% |
| $25,000 to $34,999 | 9,481 | 7.6% |
| $35,000 to $49,999 | 13,098 | 10.5% |
| $50,000 to $74,999 | 21,331 | 17.1% |
| $75,000 to $99,999 | 16,341 | 13.1% |
| $100,000 to $149,999 | 22,454 | 18.0% |
| $150,000 to $199,999 | 10,728 | 8.6% |
| $200,000+ | 12,100 | 9.7% |
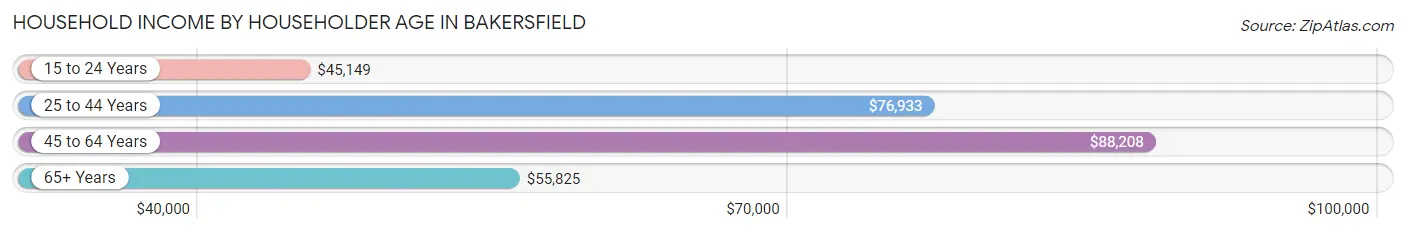
Household Income by Householder Age in Bakersfield
The median household income in Bakersfield is $73,827, with the highest median household income of $88,208 found in the 45 to 64 years age bracket for the primary householder. A total of 44,510 households (35.7%) fall into this category. Meanwhile, the 15 to 24 years age bracket for the primary householder has the lowest median household income of $45,149, with 4,491 households (3.6%) in this group.
| Income Bracket | # Households | Median Income |
| 15 to 24 Years | 4,491 (3.6%) | $45,149 |
| 25 to 44 Years | 52,612 (42.2%) | $76,933 |
| 45 to 64 Years | 44,510 (35.7%) | $88,208 |
| 65+ Years | 23,131 (18.5%) | $55,825 |
| Total | 124,744 (100.0%) | $73,827 |
Poverty in Bakersfield
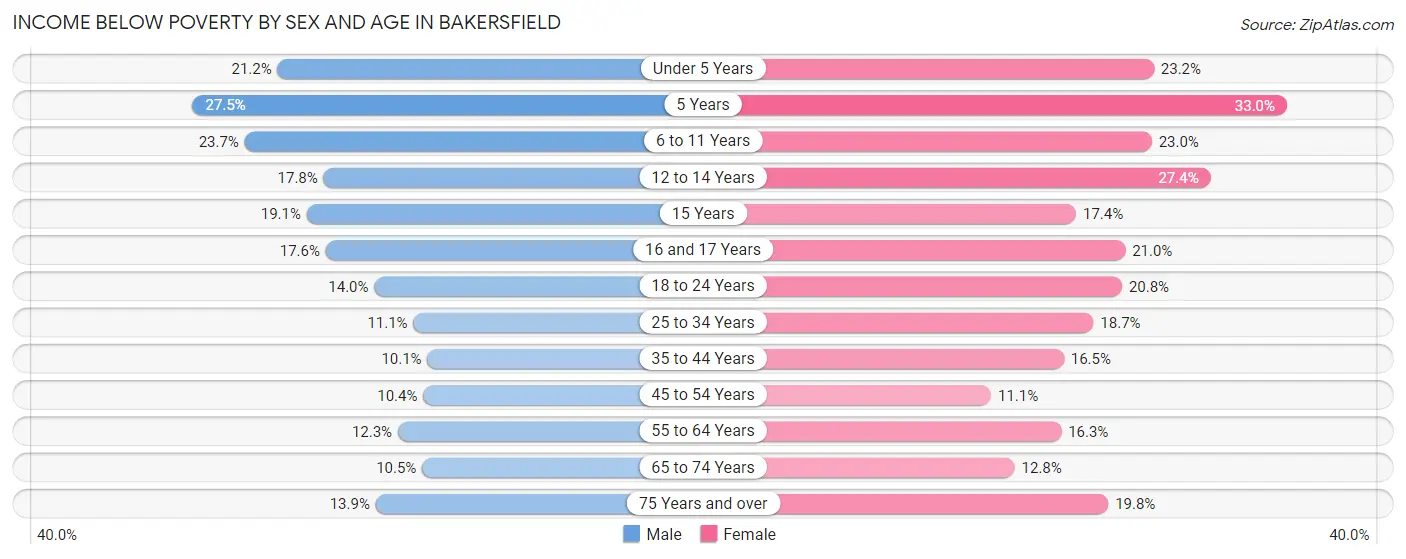
Income Below Poverty by Sex and Age in Bakersfield
With 14.4% poverty level for males and 18.6% for females among the residents of Bakersfield, 5 year old males and 5 year old females are the most vulnerable to poverty, with 819 males (27.5%) and 1,060 females (33.0%) in their respective age groups living below the poverty level.
| Age Bracket | Male | Female |
| Under 5 Years | 3,426 (21.2%) | 3,445 (23.2%) |
| 5 Years | 819 (27.5%) | 1,060 (33.0%) |
| 6 to 11 Years | 4,769 (23.7%) | 4,471 (23.0%) |
| 12 to 14 Years | 1,992 (17.8%) | 2,687 (27.4%) |
| 15 Years | 772 (19.1%) | 646 (17.4%) |
| 16 and 17 Years | 1,152 (17.6%) | 1,397 (21.0%) |
| 18 to 24 Years | 2,881 (14.0%) | 3,985 (20.8%) |
| 25 to 34 Years | 3,528 (11.1%) | 6,037 (18.7%) |
| 35 to 44 Years | 2,677 (10.1%) | 4,211 (16.5%) |
| 45 to 54 Years | 2,326 (10.4%) | 2,542 (11.1%) |
| 55 to 64 Years | 2,356 (12.3%) | 3,325 (16.3%) |
| 65 to 74 Years | 1,217 (10.5%) | 1,799 (12.8%) |
| 75 Years and over | 912 (13.9%) | 1,785 (19.8%) |
| Total | 28,827 (14.4%) | 37,390 (18.6%) |
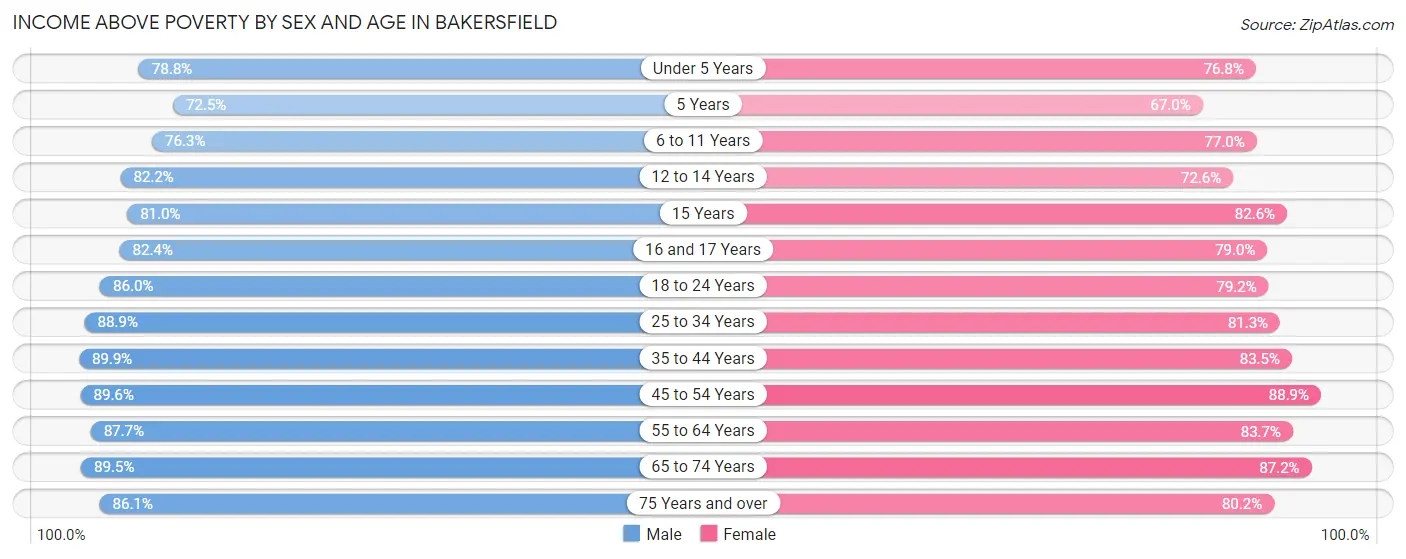
Income Above Poverty by Sex and Age in Bakersfield
According to the poverty statistics in Bakersfield, males aged 35 to 44 years and females aged 45 to 54 years are the age groups that are most secure financially, with 89.9% of males and 88.9% of females in these age groups living above the poverty line.
| Age Bracket | Male | Female |
| Under 5 Years | 12,721 (78.8%) | 11,423 (76.8%) |
| 5 Years | 2,155 (72.5%) | 2,148 (67.0%) |
| 6 to 11 Years | 15,387 (76.3%) | 14,963 (77.0%) |
| 12 to 14 Years | 9,201 (82.2%) | 7,129 (72.6%) |
| 15 Years | 3,281 (80.9%) | 3,069 (82.6%) |
| 16 and 17 Years | 5,377 (82.4%) | 5,243 (79.0%) |
| 18 to 24 Years | 17,650 (86.0%) | 15,176 (79.2%) |
| 25 to 34 Years | 28,175 (88.9%) | 26,287 (81.3%) |
| 35 to 44 Years | 23,853 (89.9%) | 21,335 (83.5%) |
| 45 to 54 Years | 20,047 (89.6%) | 20,390 (88.9%) |
| 55 to 64 Years | 16,826 (87.7%) | 17,085 (83.7%) |
| 65 to 74 Years | 10,400 (89.5%) | 12,224 (87.2%) |
| 75 Years and over | 5,637 (86.1%) | 7,239 (80.2%) |
| Total | 170,710 (85.6%) | 163,711 (81.4%) |
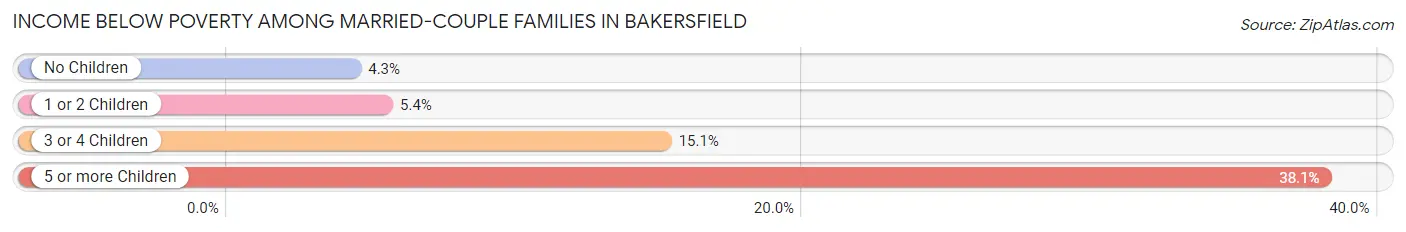
Income Below Poverty Among Married-Couple Families in Bakersfield
The poverty statistics for married-couple families in Bakersfield show that 6.5% or 4,140 of the total 63,769 families live below the poverty line. Families with 5 or more children have the highest poverty rate of 38.1%, comprising of 244 families. On the other hand, families with no children have the lowest poverty rate of 4.3%, which includes 1,235 families.
| Children | Above Poverty | Below Poverty |
| No Children | 27,568 (95.7%) | 1,235 (4.3%) |
| 1 or 2 Children | 24,607 (94.6%) | 1,406 (5.4%) |
| 3 or 4 Children | 7,057 (84.9%) | 1,255 (15.1%) |
| 5 or more Children | 397 (61.9%) | 244 (38.1%) |
| Total | 59,629 (93.5%) | 4,140 (6.5%) |
Income Below Poverty Among Single-Parent Households in Bakersfield
According to the poverty data in Bakersfield, 16.9% or 1,530 single-father households and 30.6% or 6,533 single-mother households are living below the poverty line. Among single-father households, those with 5 or more children have the highest poverty rate, with 65 households (46.8%) experiencing poverty. Likewise, among single-mother households, those with 3 or 4 children have the highest poverty rate, with 2,207 households (66.5%) falling below the poverty line.
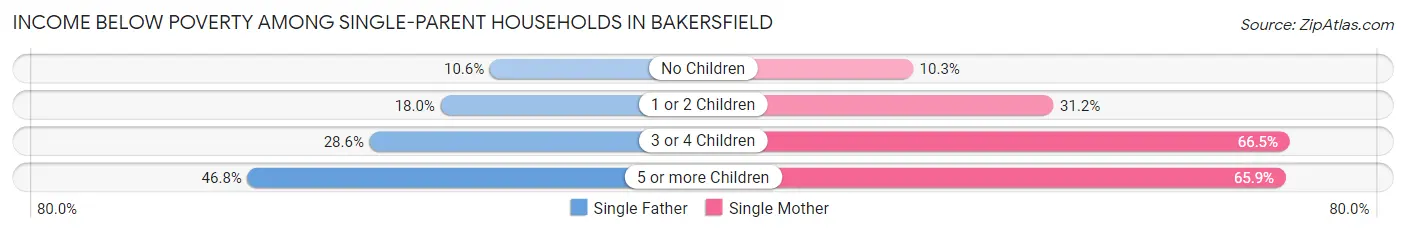
| Children | Single Father | Single Mother |
| No Children | 362 (10.6%) | 720 (10.3%) |
| 1 or 2 Children | 797 (18.0%) | 3,289 (31.2%) |
| 3 or 4 Children | 306 (28.6%) | 2,207 (66.5%) |
| 5 or more Children | 65 (46.8%) | 317 (65.9%) |
| Total | 1,530 (16.9%) | 6,533 (30.6%) |
Income Below Poverty Among Married-Couple vs Single-Parent Households in Bakersfield
The poverty data for Bakersfield shows that 4,140 of the married-couple family households (6.5%) and 8,063 of the single-parent households (26.5%) are living below the poverty level. Within the married-couple family households, those with 5 or more children have the highest poverty rate, with 244 households (38.1%) falling below the poverty line. Among the single-parent households, those with 5 or more children have the highest poverty rate, with 382 household (61.6%) living below poverty.
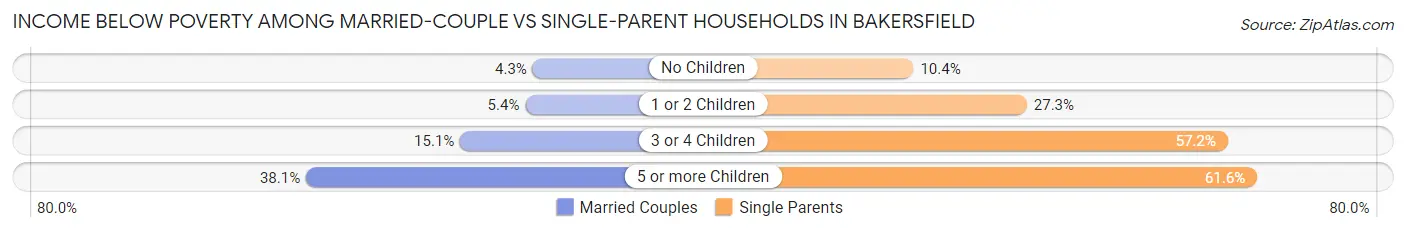
| Children | Married-Couple Families | Single-Parent Households |
| No Children | 1,235 (4.3%) | 1,082 (10.4%) |
| 1 or 2 Children | 1,406 (5.4%) | 4,086 (27.3%) |
| 3 or 4 Children | 1,255 (15.1%) | 2,513 (57.2%) |
| 5 or more Children | 244 (38.1%) | 382 (61.6%) |
| Total | 4,140 (6.5%) | 8,063 (26.5%) |
Race in Bakersfield
The most populous races in Bakersfield are Hispanic or Latino (213,891 | 52.9%), White / Caucasian (213,475 | 52.8%), and Two or more Races (67,716 | 16.8%).
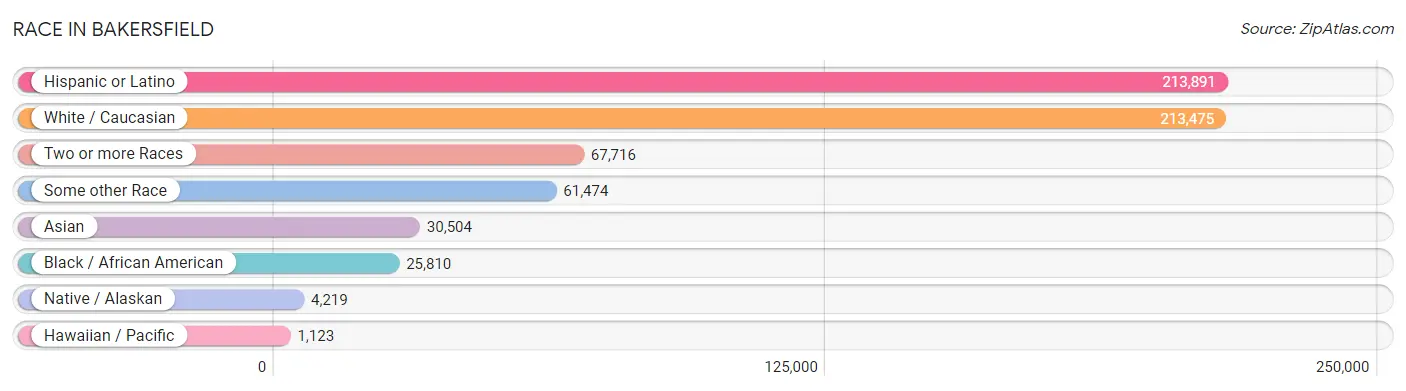
| Race | # Population | % Population |
| Asian | 30,504 | 7.5% |
| Black / African American | 25,810 | 6.4% |
| Hawaiian / Pacific | 1,123 | 0.3% |
| Hispanic or Latino | 213,891 | 52.9% |
| Native / Alaskan | 4,219 | 1.0% |
| White / Caucasian | 213,475 | 52.8% |
| Two or more Races | 67,716 | 16.8% |
| Some other Race | 61,474 | 15.2% |
| Total | 404,321 | 100.0% |
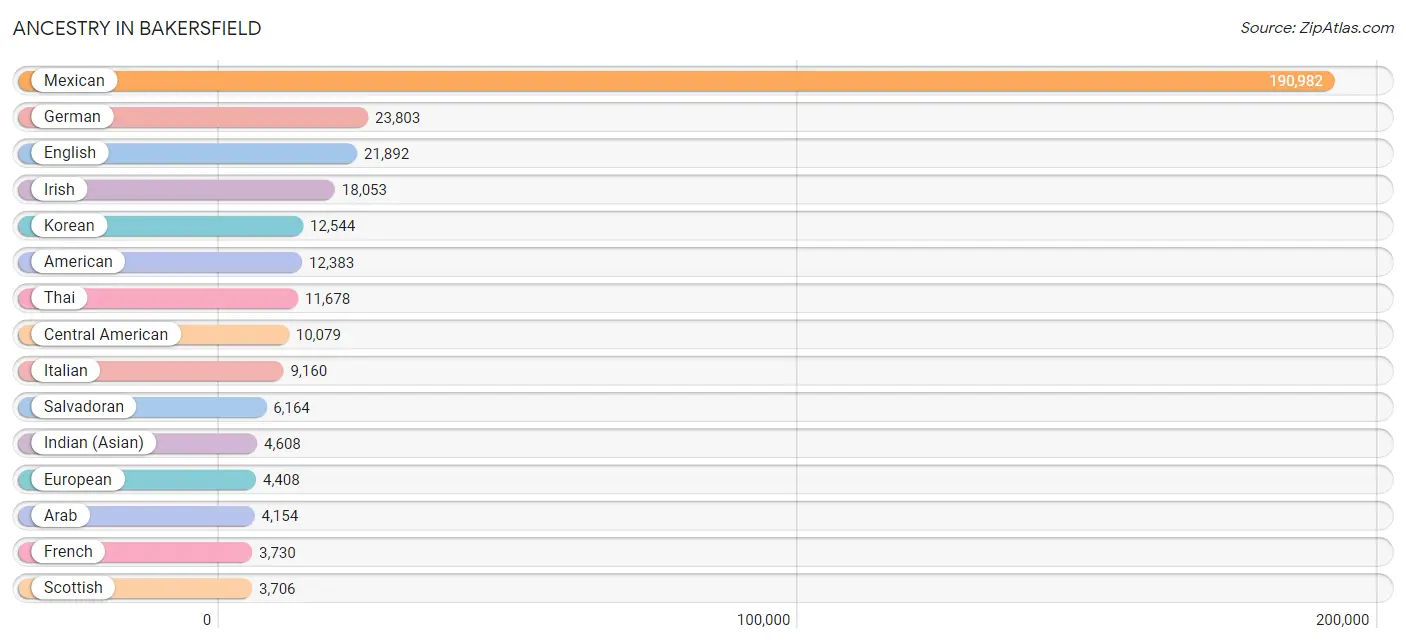
Ancestry in Bakersfield
The most populous ancestries reported in Bakersfield are Mexican (190,982 | 47.2%), German (23,803 | 5.9%), English (21,892 | 5.4%), Irish (18,053 | 4.5%), and Korean (12,544 | 3.1%), together accounting for 66.1% of all Bakersfield residents.
| Ancestry | # Population | % Population |
| Afghan | 88 | 0.0% |
| African | 1,222 | 0.3% |
| Alaska Native | 23 | 0.0% |
| Albanian | 62 | 0.0% |
| American | 12,383 | 3.1% |
| Apache | 350 | 0.1% |
| Arab | 4,154 | 1.0% |
| Argentinean | 233 | 0.1% |
| Armenian | 769 | 0.2% |
| Assyrian / Chaldean / Syriac | 54 | 0.0% |
| Australian | 45 | 0.0% |
| Austrian | 178 | 0.0% |
| Bahamian | 4 | 0.0% |
| Bangladeshi | 337 | 0.1% |
| Basque | 750 | 0.2% |
| Belgian | 91 | 0.0% |
| Belizean | 530 | 0.1% |
| Bhutanese | 1,351 | 0.3% |
| Blackfeet | 357 | 0.1% |
| Bolivian | 166 | 0.0% |
| Brazilian | 128 | 0.0% |
| British | 1,280 | 0.3% |
| Bulgarian | 14 | 0.0% |
| Burmese | 1,692 | 0.4% |
| Canadian | 381 | 0.1% |
| Central American | 10,079 | 2.5% |
| Central American Indian | 677 | 0.2% |
| Cherokee | 1,212 | 0.3% |
| Chickasaw | 151 | 0.0% |
| Chilean | 8 | 0.0% |
| Chippewa | 51 | 0.0% |
| Choctaw | 434 | 0.1% |
| Colombian | 746 | 0.2% |
| Comanche | 150 | 0.0% |
| Costa Rican | 209 | 0.1% |
| Cree | 54 | 0.0% |
| Creek | 59 | 0.0% |
| Croatian | 127 | 0.0% |
| Cuban | 343 | 0.1% |
| Czech | 178 | 0.0% |
| Czechoslovakian | 189 | 0.1% |
| Danish | 856 | 0.2% |
| Delaware | 9 | 0.0% |
| Dominican | 56 | 0.0% |
| Dutch | 2,072 | 0.5% |
| Dutch West Indian | 15 | 0.0% |
| Eastern European | 132 | 0.0% |
| Ecuadorian | 65 | 0.0% |
| Egyptian | 1,275 | 0.3% |
| English | 21,892 | 5.4% |
| Ethiopian | 53 | 0.0% |
| European | 4,408 | 1.1% |
| Filipino | 45 | 0.0% |
| Finnish | 271 | 0.1% |
| French | 3,730 | 0.9% |
| French Canadian | 466 | 0.1% |
| German | 23,803 | 5.9% |
| Ghanaian | 488 | 0.1% |
| Greek | 390 | 0.1% |
| Guamanian / Chamorro | 389 | 0.1% |
| Guatemalan | 2,080 | 0.5% |
| Haitian | 60 | 0.0% |
| Honduran | 1,269 | 0.3% |
| Hopi | 95 | 0.0% |
| Hungarian | 331 | 0.1% |
| Icelander | 62 | 0.0% |
| Indian (Asian) | 4,608 | 1.1% |
| Indonesian | 202 | 0.1% |
| Iranian | 263 | 0.1% |
| Irish | 18,053 | 4.5% |
| Iroquois | 22 | 0.0% |
| Italian | 9,160 | 2.3% |
| Jamaican | 658 | 0.2% |
| Japanese | 910 | 0.2% |
| Jordanian | 319 | 0.1% |
| Kiowa | 25 | 0.0% |
| Korean | 12,544 | 3.1% |
| Laotian | 262 | 0.1% |
| Latvian | 210 | 0.1% |
| Lebanese | 244 | 0.1% |
| Lithuanian | 267 | 0.1% |
| Lumbee | 41 | 0.0% |
| Luxembourger | 14 | 0.0% |
| Malaysian | 195 | 0.1% |
| Mexican | 190,982 | 47.2% |
| Mexican American Indian | 1,803 | 0.4% |
| Mongolian | 42 | 0.0% |
| Moroccan | 51 | 0.0% |
| Native Hawaiian | 1,255 | 0.3% |
| Navajo | 254 | 0.1% |
| Nicaraguan | 182 | 0.1% |
| Nigerian | 463 | 0.1% |
| Northern European | 547 | 0.1% |
| Norwegian | 1,535 | 0.4% |
| Paiute | 236 | 0.1% |
| Pakistani | 339 | 0.1% |
| Palestinian | 178 | 0.0% |
| Panamanian | 40 | 0.0% |
| Pennsylvania German | 25 | 0.0% |
| Peruvian | 1,003 | 0.3% |
| Pima | 52 | 0.0% |
| Polish | 1,853 | 0.5% |
| Portuguese | 1,727 | 0.4% |
| Potawatomi | 91 | 0.0% |
| Pueblo | 12 | 0.0% |
| Puerto Rican | 2,790 | 0.7% |
| Romanian | 245 | 0.1% |
| Russian | 1,197 | 0.3% |
| Salvadoran | 6,164 | 1.5% |
| Samoan | 642 | 0.2% |
| Scandinavian | 808 | 0.2% |
| Scotch-Irish | 1,683 | 0.4% |
| Scottish | 3,706 | 0.9% |
| Seminole | 101 | 0.0% |
| Serbian | 51 | 0.0% |
| Sierra Leonean | 6 | 0.0% |
| Sioux | 51 | 0.0% |
| Slavic | 18 | 0.0% |
| Slovak | 40 | 0.0% |
| Slovene | 4 | 0.0% |
| South American | 2,503 | 0.6% |
| South American Indian | 11 | 0.0% |
| Spaniard | 1,977 | 0.5% |
| Spanish | 1,659 | 0.4% |
| Spanish American | 17 | 0.0% |
| Sri Lankan | 1,979 | 0.5% |
| Subsaharan African | 2,451 | 0.6% |
| Swedish | 1,665 | 0.4% |
| Swiss | 926 | 0.2% |
| Syrian | 228 | 0.1% |
| Thai | 11,678 | 2.9% |
| Tongan | 57 | 0.0% |
| Trinidadian and Tobagonian | 11 | 0.0% |
| Turkish | 1,283 | 0.3% |
| U.S. Virgin Islander | 124 | 0.0% |
| Ugandan | 254 | 0.1% |
| Ukrainian | 380 | 0.1% |
| Venezuelan | 282 | 0.1% |
| Vietnamese | 246 | 0.1% |
| Welsh | 2,289 | 0.6% |
| West Indian | 49 | 0.0% |
| Yaqui | 192 | 0.1% |
| Yugoslavian | 217 | 0.1% | View All 143 Rows |
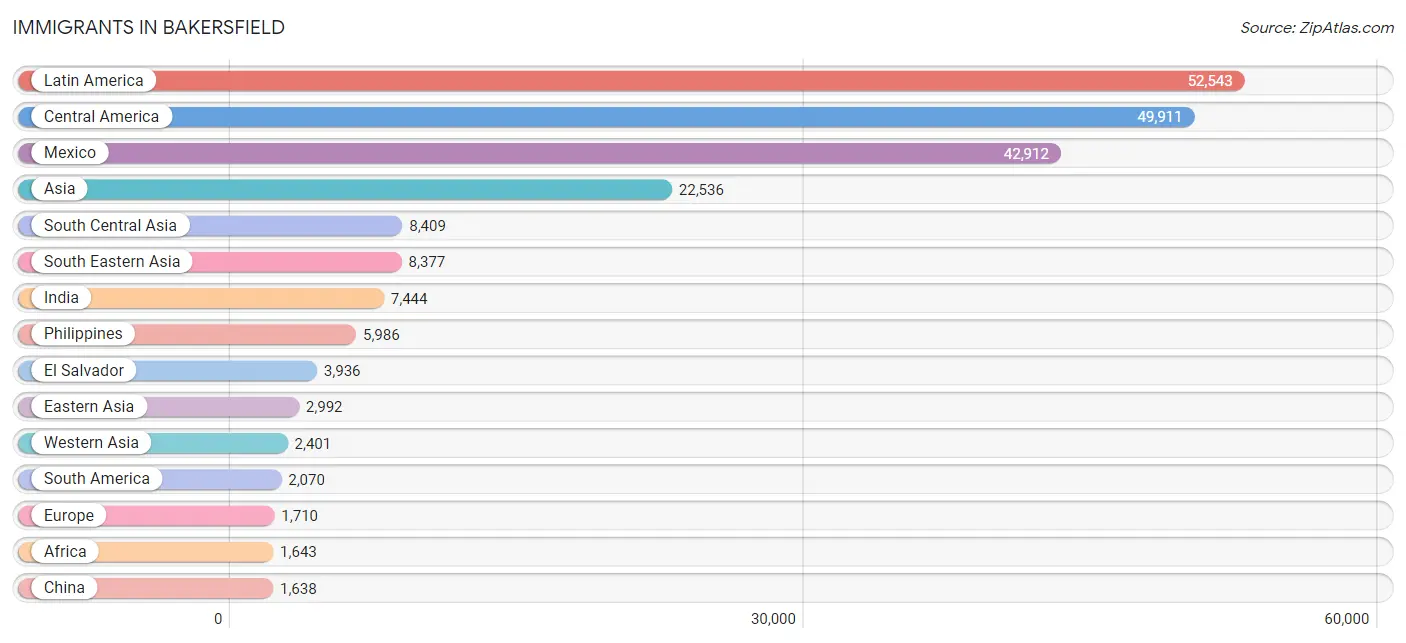
Immigrants in Bakersfield
The most numerous immigrant groups reported in Bakersfield came from Latin America (52,543 | 13.0%), Central America (49,911 | 12.3%), Mexico (42,912 | 10.6%), Asia (22,536 | 5.6%), and South Central Asia (8,409 | 2.1%), together accounting for 43.6% of all Bakersfield residents.
| Immigration Origin | # Population | % Population |
| Afghanistan | 78 | 0.0% |
| Africa | 1,643 | 0.4% |
| Argentina | 96 | 0.0% |
| Armenia | 40 | 0.0% |
| Asia | 22,536 | 5.6% |
| Australia | 62 | 0.0% |
| Austria | 7 | 0.0% |
| Azores | 30 | 0.0% |
| Bahamas | 4 | 0.0% |
| Bangladesh | 236 | 0.1% |
| Belarus | 21 | 0.0% |
| Belgium | 17 | 0.0% |
| Belize | 171 | 0.0% |
| Bolivia | 87 | 0.0% |
| Brazil | 146 | 0.0% |
| Cambodia | 156 | 0.0% |
| Canada | 716 | 0.2% |
| Caribbean | 562 | 0.1% |
| Central America | 49,911 | 12.3% |
| Chile | 21 | 0.0% |
| China | 1,638 | 0.4% |
| Colombia | 423 | 0.1% |
| Costa Rica | 69 | 0.0% |
| Cuba | 80 | 0.0% |
| Czechoslovakia | 28 | 0.0% |
| Denmark | 13 | 0.0% |
| Dominican Republic | 27 | 0.0% |
| Eastern Africa | 255 | 0.1% |
| Eastern Asia | 2,992 | 0.7% |
| Eastern Europe | 519 | 0.1% |
| Ecuador | 65 | 0.0% |
| Egypt | 808 | 0.2% |
| El Salvador | 3,936 | 1.0% |
| England | 351 | 0.1% |
| Eritrea | 11 | 0.0% |
| Ethiopia | 47 | 0.0% |
| Europe | 1,710 | 0.4% |
| Fiji | 134 | 0.0% |
| France | 117 | 0.0% |
| Germany | 110 | 0.0% |
| Ghana | 120 | 0.0% |
| Greece | 52 | 0.0% |
| Guatemala | 1,498 | 0.4% |
| Haiti | 50 | 0.0% |
| Honduras | 1,135 | 0.3% |
| Hong Kong | 235 | 0.1% |
| Hungary | 8 | 0.0% |
| India | 7,444 | 1.8% |
| Indonesia | 191 | 0.1% |
| Iran | 275 | 0.1% |
| Israel | 32 | 0.0% |
| Italy | 54 | 0.0% |
| Jamaica | 323 | 0.1% |
| Japan | 215 | 0.1% |
| Jordan | 247 | 0.1% |
| Kenya | 70 | 0.0% |
| Korea | 1,092 | 0.3% |
| Kuwait | 78 | 0.0% |
| Laos | 149 | 0.0% |
| Latin America | 52,543 | 13.0% |
| Latvia | 6 | 0.0% |
| Lebanon | 65 | 0.0% |
| Lithuania | 12 | 0.0% |
| Malaysia | 34 | 0.0% |
| Mexico | 42,912 | 10.6% |
| Moldova | 131 | 0.0% |
| Morocco | 51 | 0.0% |
| Nepal | 30 | 0.0% |
| Netherlands | 14 | 0.0% |
| Nicaragua | 173 | 0.0% |
| Nigeria | 321 | 0.1% |
| Northern Africa | 859 | 0.2% |
| Northern Europe | 415 | 0.1% |
| Oceania | 246 | 0.1% |
| Pakistan | 309 | 0.1% |
| Panama | 17 | 0.0% |
| Peru | 887 | 0.2% |
| Philippines | 5,986 | 1.5% |
| Poland | 22 | 0.0% |
| Portugal | 113 | 0.0% |
| Romania | 28 | 0.0% |
| Russia | 180 | 0.0% |
| Saudi Arabia | 51 | 0.0% |
| Serbia | 51 | 0.0% |
| Sierra Leone | 7 | 0.0% |
| Singapore | 16 | 0.0% |
| South Africa | 26 | 0.0% |
| South America | 2,070 | 0.5% |
| South Central Asia | 8,409 | 2.1% |
| South Eastern Asia | 8,377 | 2.1% |
| Southern Europe | 511 | 0.1% |
| Spain | 292 | 0.1% |
| Sri Lanka | 10 | 0.0% |
| Syria | 255 | 0.1% |
| Taiwan | 64 | 0.0% |
| Thailand | 388 | 0.1% |
| Trinidad and Tobago | 15 | 0.0% |
| Turkey | 763 | 0.2% |
| Uganda | 80 | 0.0% |
| Ukraine | 23 | 0.0% |
| Uruguay | 53 | 0.0% |
| Uzbekistan | 27 | 0.0% |
| Venezuela | 255 | 0.1% |
| Vietnam | 1,249 | 0.3% |
| Western Africa | 448 | 0.1% |
| Western Asia | 2,401 | 0.6% |
| Western Europe | 265 | 0.1% |
| Yemen | 757 | 0.2% | View All 108 Rows |
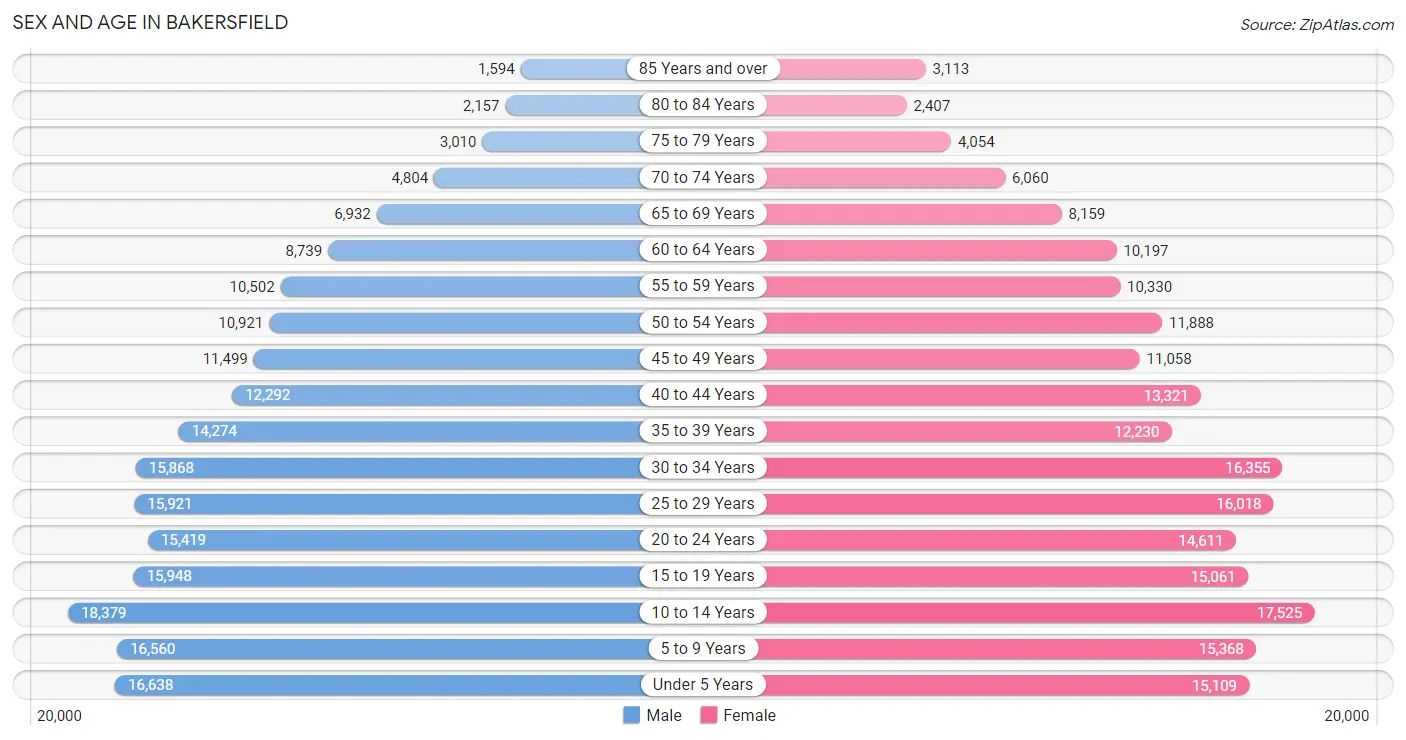
Sex and Age in Bakersfield
Sex and Age in Bakersfield
The most populous age groups in Bakersfield are 10 to 14 Years (18,379 | 9.1%) for men and 10 to 14 Years (17,525 | 8.6%) for women.
| Age Bracket | Male | Female |
| Under 5 Years | 16,638 (8.3%) | 15,109 (7.4%) |
| 5 to 9 Years | 16,560 (8.2%) | 15,368 (7.6%) |
| 10 to 14 Years | 18,379 (9.1%) | 17,525 (8.6%) |
| 15 to 19 Years | 15,948 (7.9%) | 15,061 (7.4%) |
| 20 to 24 Years | 15,419 (7.6%) | 14,611 (7.2%) |
| 25 to 29 Years | 15,921 (7.9%) | 16,018 (7.9%) |
| 30 to 34 Years | 15,868 (7.9%) | 16,355 (8.1%) |
| 35 to 39 Years | 14,274 (7.1%) | 12,230 (6.0%) |
| 40 to 44 Years | 12,292 (6.1%) | 13,321 (6.6%) |
| 45 to 49 Years | 11,499 (5.7%) | 11,058 (5.4%) |
| 50 to 54 Years | 10,921 (5.4%) | 11,888 (5.9%) |
| 55 to 59 Years | 10,502 (5.2%) | 10,330 (5.1%) |
| 60 to 64 Years | 8,739 (4.3%) | 10,197 (5.0%) |
| 65 to 69 Years | 6,932 (3.4%) | 8,159 (4.0%) |
| 70 to 74 Years | 4,804 (2.4%) | 6,060 (3.0%) |
| 75 to 79 Years | 3,010 (1.5%) | 4,054 (2.0%) |
| 80 to 84 Years | 2,157 (1.1%) | 2,407 (1.2%) |
| 85 Years and over | 1,594 (0.8%) | 3,113 (1.5%) |
| Total | 201,457 (100.0%) | 202,864 (100.0%) |
Families and Households in Bakersfield
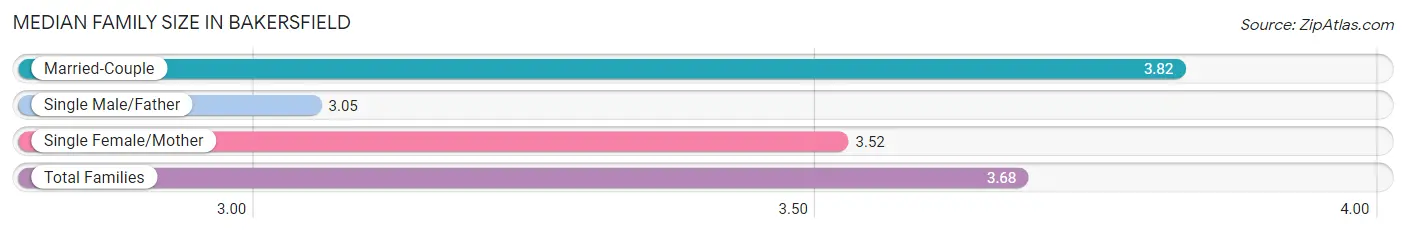
Median Family Size in Bakersfield
The median family size in Bakersfield is 3.68 persons per family, with married-couple families (63,769 | 67.7%) accounting for the largest median family size of 3.82 persons per family. On the other hand, single male/father families (9,040 | 9.6%) represent the smallest median family size with 3.05 persons per family.
| Family Type | # Families | Family Size |
| Married-Couple | 63,769 (67.7%) | 3.82 |
| Single Male/Father | 9,040 (9.6%) | 3.05 |
| Single Female/Mother | 21,343 (22.7%) | 3.52 |
| Total Families | 94,152 (100.0%) | 3.68 |
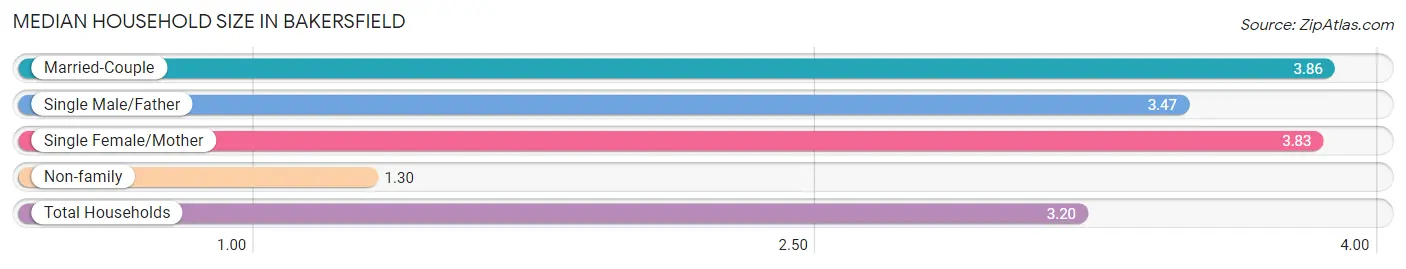
Median Household Size in Bakersfield
The median household size in Bakersfield is 3.20 persons per household, with married-couple households (63,769 | 51.1%) accounting for the largest median household size of 3.86 persons per household. non-family households (30,592 | 24.5%) represent the smallest median household size with 1.30 persons per household.
| Household Type | # Households | Household Size |
| Married-Couple | 63,769 (51.1%) | 3.86 |
| Single Male/Father | 9,040 (7.2%) | 3.47 |
| Single Female/Mother | 21,343 (17.1%) | 3.83 |
| Non-family | 30,592 (24.5%) | 1.30 |
| Total Households | 124,744 (100.0%) | 3.20 |
Household Size by Marriage Status in Bakersfield
Out of a total of 124,744 households in Bakersfield, 94,152 (75.5%) are family households, while 30,592 (24.5%) are nonfamily households. The most numerous type of family households are 2-person households, comprising 30,296, and the most common type of nonfamily households are 1-person households, comprising 24,063.
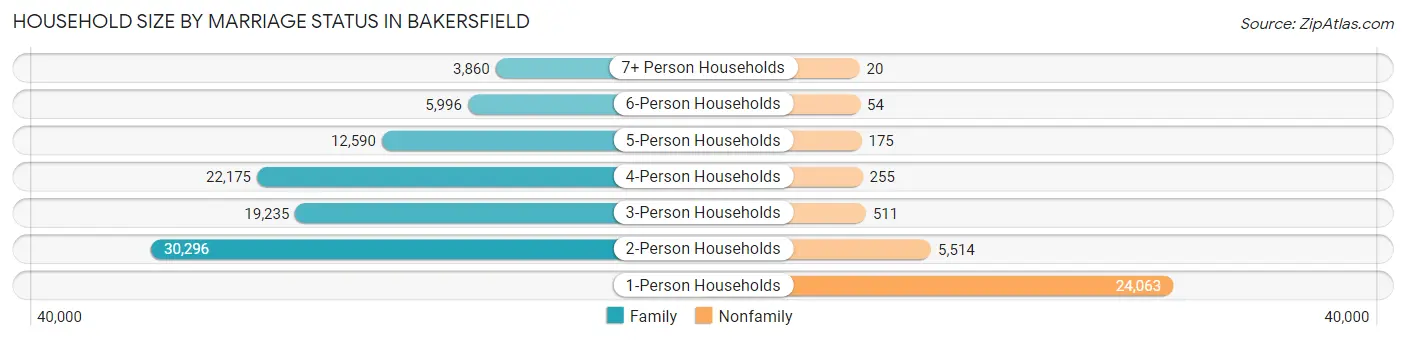
| Household Size | Family Households | Nonfamily Households |
| 1-Person Households | - | 24,063 (19.3%) |
| 2-Person Households | 30,296 (24.3%) | 5,514 (4.4%) |
| 3-Person Households | 19,235 (15.4%) | 511 (0.4%) |
| 4-Person Households | 22,175 (17.8%) | 255 (0.2%) |
| 5-Person Households | 12,590 (10.1%) | 175 (0.1%) |
| 6-Person Households | 5,996 (4.8%) | 54 (0.0%) |
| 7+ Person Households | 3,860 (3.1%) | 20 (0.0%) |
| Total | 94,152 (75.5%) | 30,592 (24.5%) |
Female Fertility in Bakersfield
Fertility by Age in Bakersfield
Average fertility rate in Bakersfield is 71.0 births per 1,000 women. Women in the age bracket of 20 to 34 years have the highest fertility rate with 117.0 births per 1,000 women. Women in the age bracket of 20 to 34 years acount for 76.6% of all women with births.
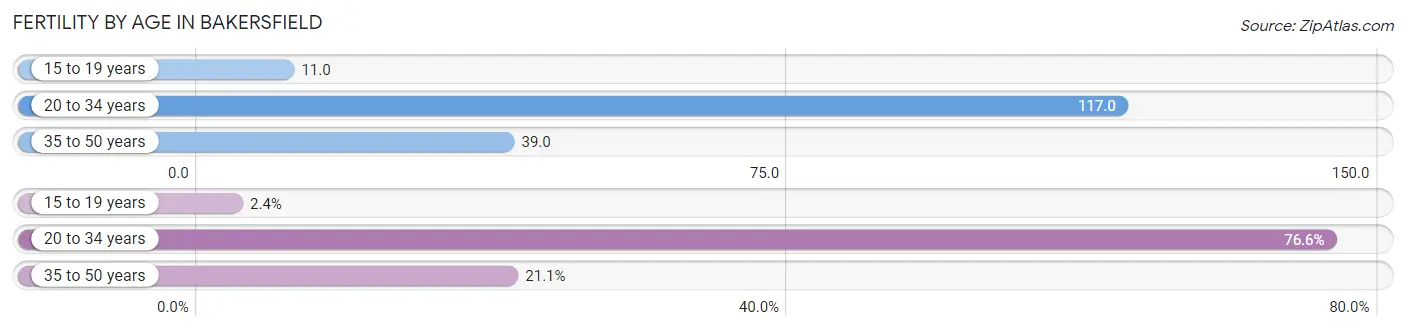
| Age Bracket | Women with Births | Births / 1,000 Women |
| 15 to 19 years | 171 (2.4%) | 11.0 |
| 20 to 34 years | 5,513 (76.6%) | 117.0 |
| 35 to 50 years | 1,516 (21.1%) | 39.0 |
| Total | 7,200 (100.0%) | 71.0 |
Fertility by Age by Marriage Status in Bakersfield
56.7% of women with births (7,200) in Bakersfield are married. The highest percentage of unmarried women with births falls into 15 to 19 years age bracket with 78.4% of them unmarried at the time of birth, while the lowest percentage of unmarried women with births belong to 35 to 50 years age bracket with 30.9% of them unmarried.
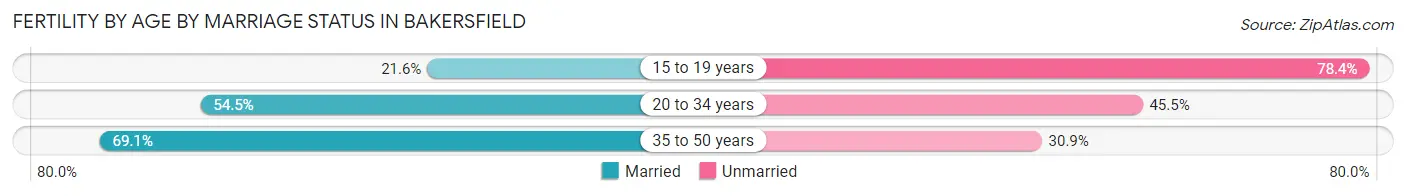
| Age Bracket | Married | Unmarried |
| 15 to 19 years | 37 (21.6%) | 134 (78.4%) |
| 20 to 34 years | 3,005 (54.5%) | 2,508 (45.5%) |
| 35 to 50 years | 1,048 (69.1%) | 468 (30.9%) |
| Total | 4,082 (56.7%) | 3,118 (43.3%) |
Fertility by Education in Bakersfield
Average fertility rate in Bakersfield is 71.0 births per 1,000 women. Women with the education attainment of bachelor's degree have the highest fertility rate of 79.0 births per 1,000 women, while women with the education attainment of less than high school have the lowest fertility at 59.0 births per 1,000 women. Women with the education attainment of college or associate's degree represent 38.3% of all women with births.
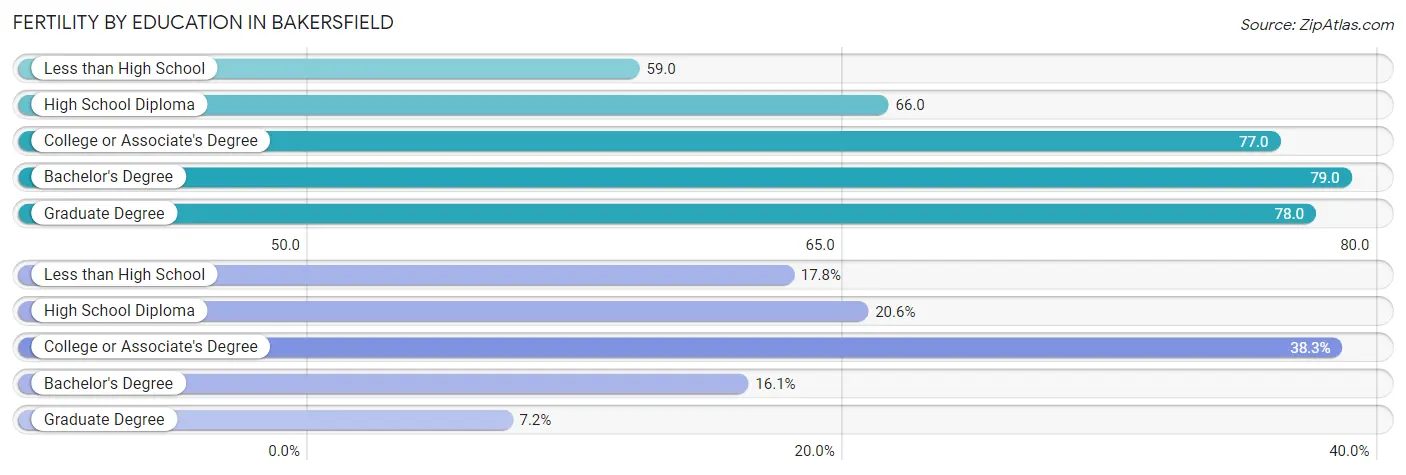
| Educational Attainment | Women with Births | Births / 1,000 Women |
| Less than High School | 1,280 (17.8%) | 59.0 |
| High School Diploma | 1,481 (20.6%) | 66.0 |
| College or Associate's Degree | 2,760 (38.3%) | 77.0 |
| Bachelor's Degree | 1,158 (16.1%) | 79.0 |
| Graduate Degree | 521 (7.2%) | 78.0 |
| Total | 7,200 (100.0%) | 71.0 |
Fertility by Education by Marriage Status in Bakersfield
43.3% of women with births in Bakersfield are unmarried. Women with the educational attainment of graduate degree are most likely to be married with 91.2% of them married at childbirth, while women with the educational attainment of college or associate's degree are least likely to be married with 51.4% of them unmarried at childbirth.
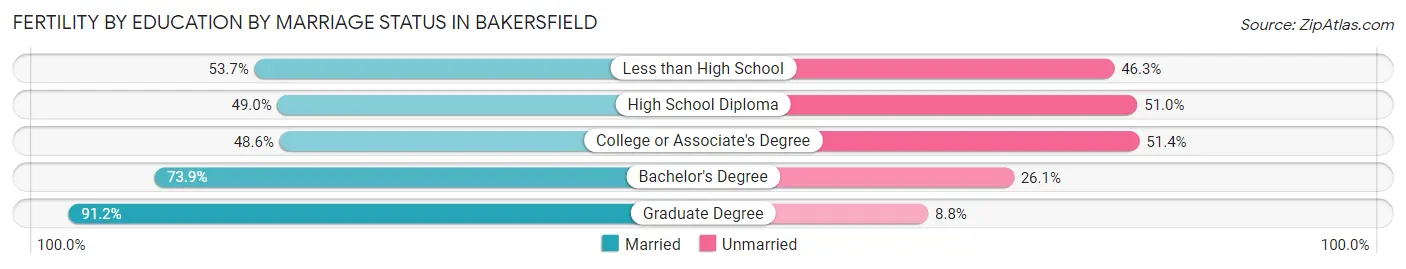
| Educational Attainment | Married | Unmarried |
| Less than High School | 687 (53.7%) | 593 (46.3%) |
| High School Diploma | 726 (49.0%) | 755 (51.0%) |
| College or Associate's Degree | 1,341 (48.6%) | 1,419 (51.4%) |
| Bachelor's Degree | 856 (73.9%) | 302 (26.1%) |
| Graduate Degree | 475 (91.2%) | 46 (8.8%) |
| Total | 4,082 (56.7%) | 3,118 (43.3%) |
Employment Characteristics in Bakersfield
Employment by Class of Employer in Bakersfield
Among the 169,417 employed individuals in Bakersfield, private company employees (112,570 | 66.4%), local government employees (18,593 | 11.0%), and self-employed (not incorporated) (11,000 | 6.5%) make up the most common classes of employment.
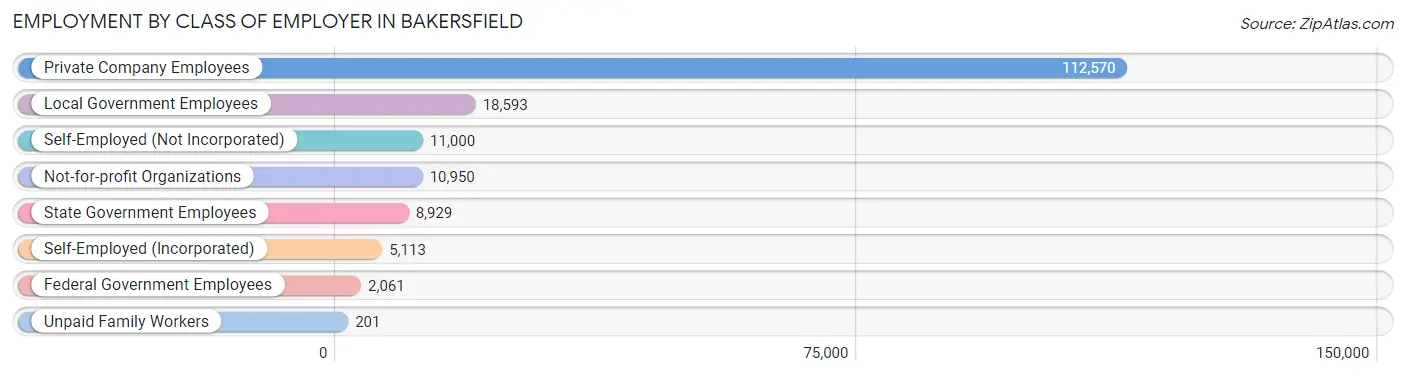
| Employer Class | # Employees | % Employees |
| Private Company Employees | 112,570 | 66.4% |
| Self-Employed (Incorporated) | 5,113 | 3.0% |
| Self-Employed (Not Incorporated) | 11,000 | 6.5% |
| Not-for-profit Organizations | 10,950 | 6.5% |
| Local Government Employees | 18,593 | 11.0% |
| State Government Employees | 8,929 | 5.3% |
| Federal Government Employees | 2,061 | 1.2% |
| Unpaid Family Workers | 201 | 0.1% |
| Total | 169,417 | 100.0% |
Employment Status by Age in Bakersfield
According to the labor force statistics for Bakersfield, out of the total population over 16 years of age (296,960), 63.1% or 187,382 individuals are in the labor force, with 7.1% or 13,304 of them unemployed. The age group with the highest labor force participation rate is 30 to 34 years, with 81.2% or 26,165 individuals in the labor force. Within the labor force, the 16 to 19 years age range has the highest percentage of unemployed individuals, with 23.9% or 1,499 of them being unemployed.
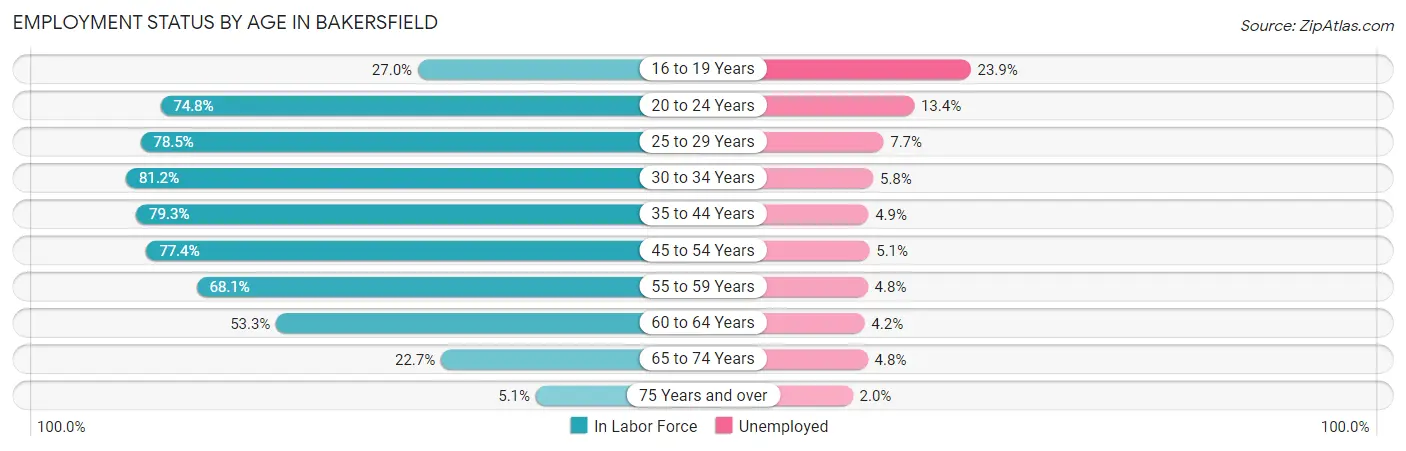
| Age Bracket | In Labor Force | Unemployed |
| 16 to 19 Years | 6,271 (27.0%) | 1,499 (23.9%) |
| 20 to 24 Years | 22,462 (74.8%) | 3,010 (13.4%) |
| 25 to 29 Years | 25,072 (78.5%) | 1,931 (7.7%) |
| 30 to 34 Years | 26,165 (81.2%) | 1,518 (5.8%) |
| 35 to 44 Years | 41,329 (79.3%) | 2,025 (4.9%) |
| 45 to 54 Years | 35,113 (77.4%) | 1,791 (5.1%) |
| 55 to 59 Years | 14,187 (68.1%) | 681 (4.8%) |
| 60 to 64 Years | 10,093 (53.3%) | 424 (4.2%) |
| 65 to 74 Years | 5,892 (22.7%) | 283 (4.8%) |
| 75 Years and over | 833 (5.1%) | 17 (2.0%) |
| Total | 187,382 (63.1%) | 13,304 (7.1%) |
Employment Status by Educational Attainment in Bakersfield
According to labor force statistics for Bakersfield, 75.4% of individuals (151,865) out of the total population between 25 and 64 years of age (201,413) are in the labor force, with 5.5% or 8,353 of them being unemployed. The group with the highest labor force participation rate are those with the educational attainment of bachelor's degree or higher, with 85.4% or 40,605 individuals in the labor force. Within the labor force, individuals with high school diploma education have the highest percentage of unemployment, with 8.5% or 3,151 of them being unemployed.
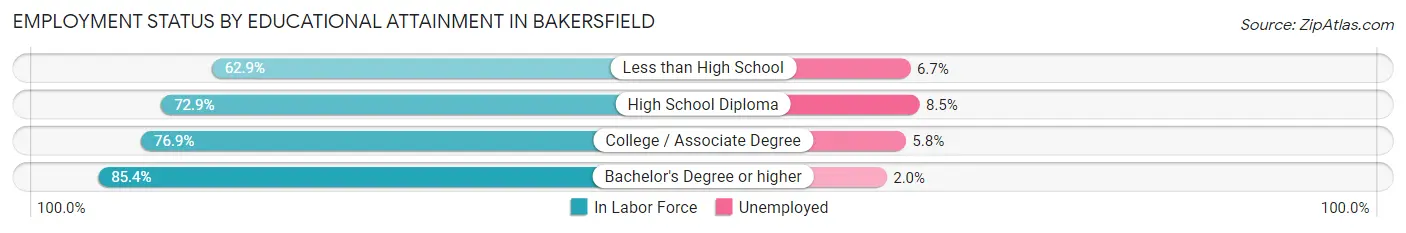
| Educational Attainment | In Labor Force | Unemployed |
| Less than High School | 22,465 (62.9%) | 2,393 (6.7%) |
| High School Diploma | 37,075 (72.9%) | 4,323 (8.5%) |
| College / Associate Degree | 51,748 (76.9%) | 3,903 (5.8%) |
| Bachelor's Degree or higher | 40,605 (85.4%) | 951 (2.0%) |
| Total | 151,865 (75.4%) | 11,078 (5.5%) |
Employment Occupations by Sex in Bakersfield
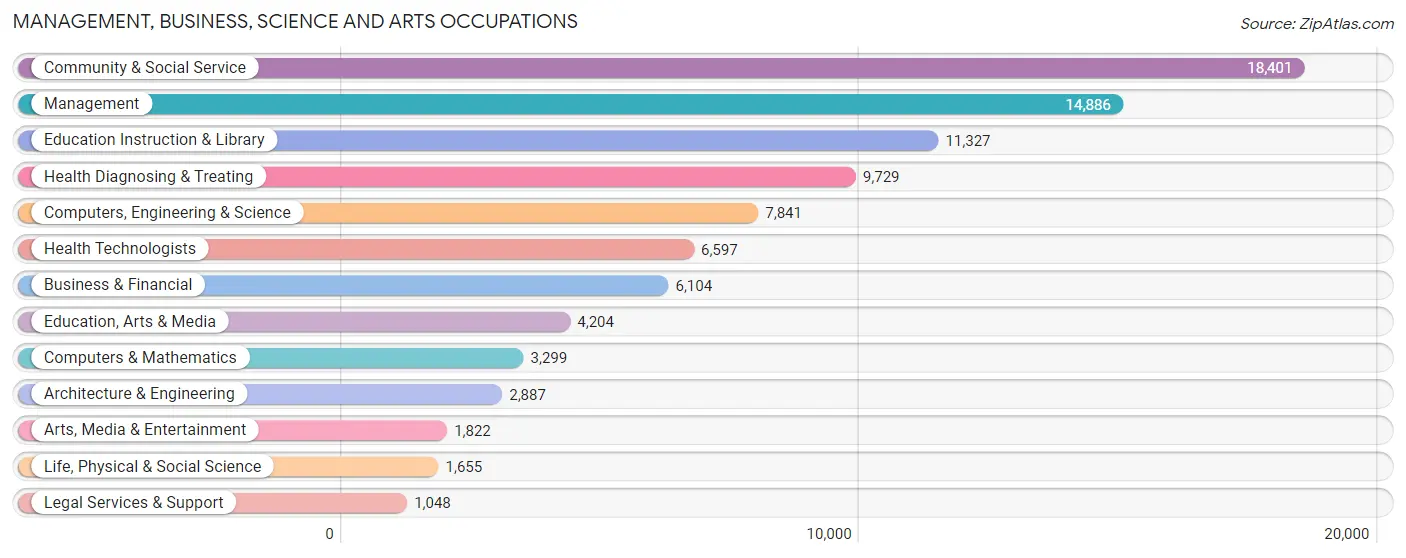
Management, Business, Science and Arts Occupations
The most common Management, Business, Science and Arts occupations in Bakersfield are Community & Social Service (18,401 | 10.6%), Management (14,886 | 8.6%), Education Instruction & Library (11,327 | 6.5%), Health Diagnosing & Treating (9,729 | 5.6%), and Computers, Engineering & Science (7,841 | 4.5%).
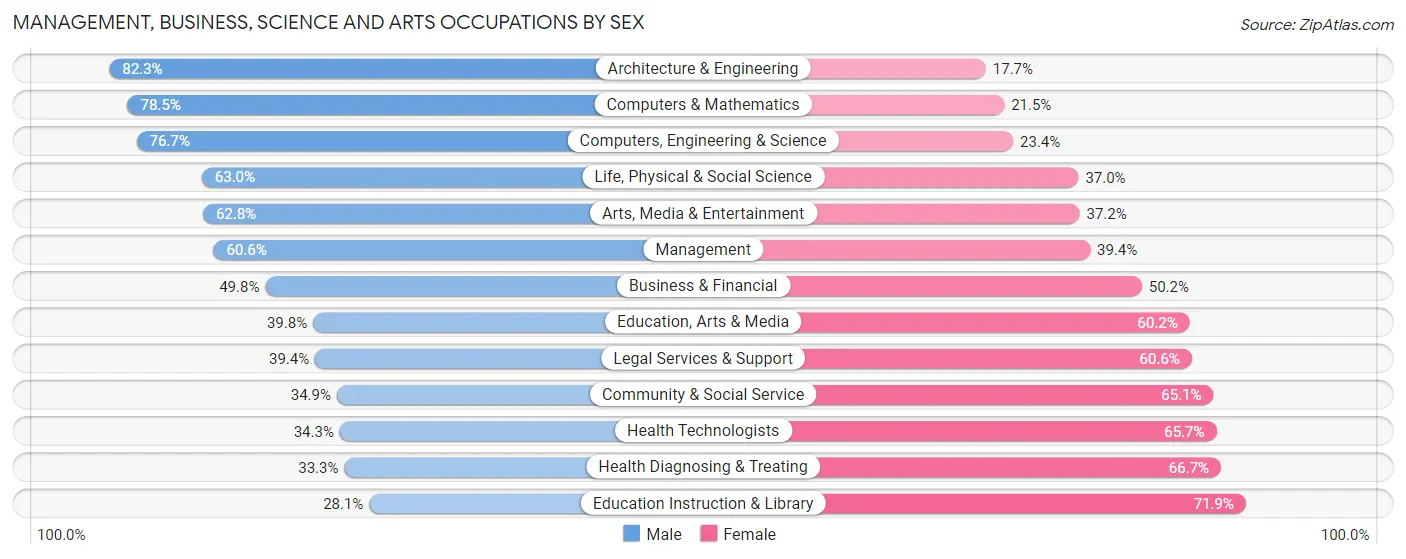
Management, Business, Science and Arts Occupations by Sex
Within the Management, Business, Science and Arts occupations in Bakersfield, the most male-oriented occupations are Architecture & Engineering (82.3%), Computers & Mathematics (78.5%), and Computers, Engineering & Science (76.6%), while the most female-oriented occupations are Education Instruction & Library (71.9%), Health Diagnosing & Treating (66.7%), and Health Technologists (65.7%).
| Occupation | Male | Female |
| Management | 9,020 (60.6%) | 5,866 (39.4%) |
| Business & Financial | 3,040 (49.8%) | 3,064 (50.2%) |
| Computers, Engineering & Science | 6,010 (76.6%) | 1,831 (23.4%) |
| Computers & Mathematics | 2,590 (78.5%) | 709 (21.5%) |
| Architecture & Engineering | 2,377 (82.3%) | 510 (17.7%) |
| Life, Physical & Social Science | 1,043 (63.0%) | 612 (37.0%) |
| Community & Social Service | 6,417 (34.9%) | 11,984 (65.1%) |
| Education, Arts & Media | 1,675 (39.8%) | 2,529 (60.2%) |
| Legal Services & Support | 413 (39.4%) | 635 (60.6%) |
| Education Instruction & Library | 3,185 (28.1%) | 8,142 (71.9%) |
| Arts, Media & Entertainment | 1,144 (62.8%) | 678 (37.2%) |
| Health Diagnosing & Treating | 3,241 (33.3%) | 6,488 (66.7%) |
| Health Technologists | 2,260 (34.3%) | 4,337 (65.7%) |
| Total (Category) | 27,728 (48.7%) | 29,233 (51.3%) |
| Total (Overall) | 95,943 (55.2%) | 77,964 (44.8%) |
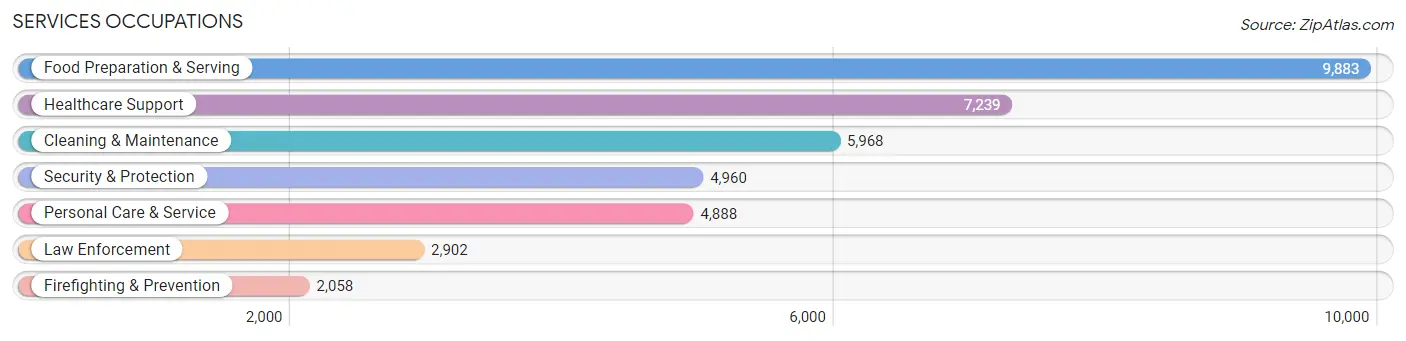
Services Occupations
The most common Services occupations in Bakersfield are Food Preparation & Serving (9,883 | 5.7%), Healthcare Support (7,239 | 4.2%), Cleaning & Maintenance (5,968 | 3.4%), Security & Protection (4,960 | 2.9%), and Personal Care & Service (4,888 | 2.8%).
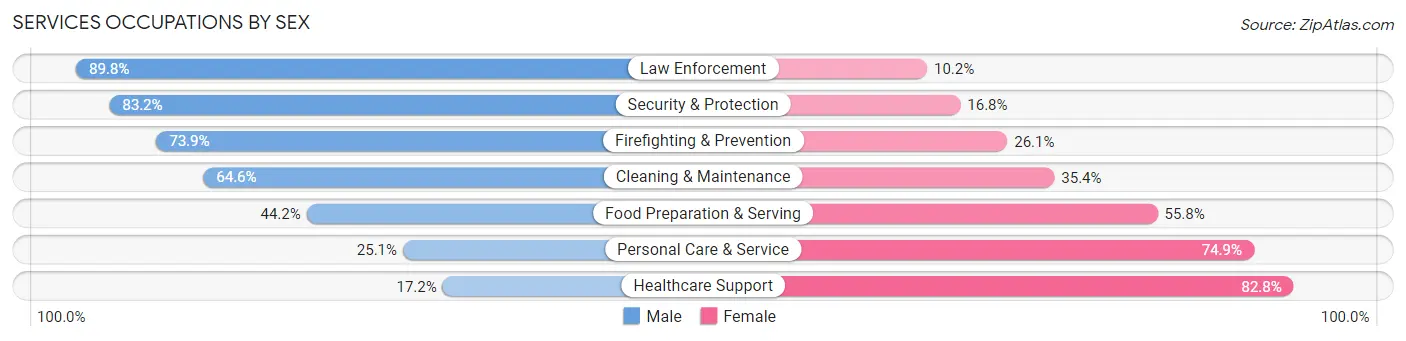
Services Occupations by Sex
Within the Services occupations in Bakersfield, the most male-oriented occupations are Law Enforcement (89.8%), Security & Protection (83.2%), and Firefighting & Prevention (73.9%), while the most female-oriented occupations are Healthcare Support (82.8%), Personal Care & Service (74.9%), and Food Preparation & Serving (55.8%).
| Occupation | Male | Female |
| Healthcare Support | 1,248 (17.2%) | 5,991 (82.8%) |
| Security & Protection | 4,127 (83.2%) | 833 (16.8%) |
| Firefighting & Prevention | 1,521 (73.9%) | 537 (26.1%) |
| Law Enforcement | 2,606 (89.8%) | 296 (10.2%) |
| Food Preparation & Serving | 4,364 (44.2%) | 5,519 (55.8%) |
| Cleaning & Maintenance | 3,855 (64.6%) | 2,113 (35.4%) |
| Personal Care & Service | 1,227 (25.1%) | 3,661 (74.9%) |
| Total (Category) | 14,821 (45.0%) | 18,117 (55.0%) |
| Total (Overall) | 95,943 (55.2%) | 77,964 (44.8%) |
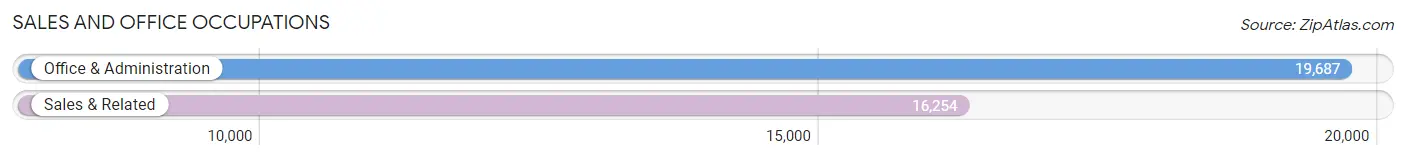
Sales and Office Occupations
The most common Sales and Office occupations in Bakersfield are Office & Administration (19,687 | 11.3%), and Sales & Related (16,254 | 9.3%).
Sales and Office Occupations by Sex
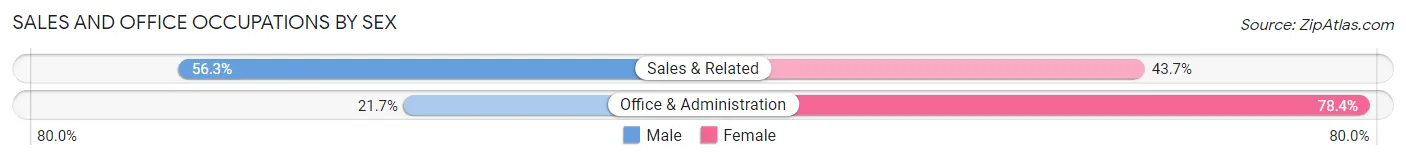
| Occupation | Male | Female |
| Sales & Related | 9,144 (56.3%) | 7,110 (43.7%) |
| Office & Administration | 4,262 (21.6%) | 15,425 (78.3%) |
| Total (Category) | 13,406 (37.3%) | 22,535 (62.7%) |
| Total (Overall) | 95,943 (55.2%) | 77,964 (44.8%) |
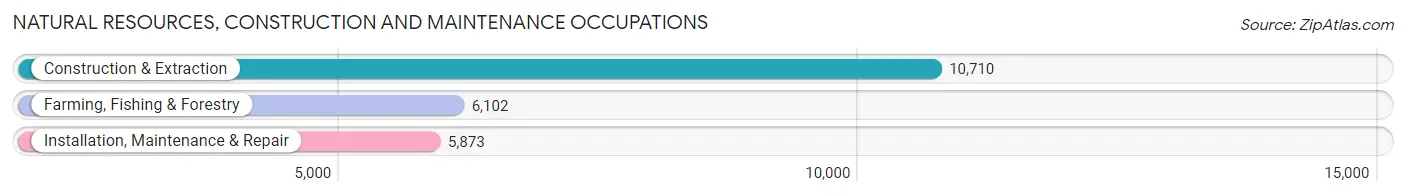
Natural Resources, Construction and Maintenance Occupations
The most common Natural Resources, Construction and Maintenance occupations in Bakersfield are Construction & Extraction (10,710 | 6.2%), Farming, Fishing & Forestry (6,102 | 3.5%), and Installation, Maintenance & Repair (5,873 | 3.4%).
Natural Resources, Construction and Maintenance Occupations by Sex
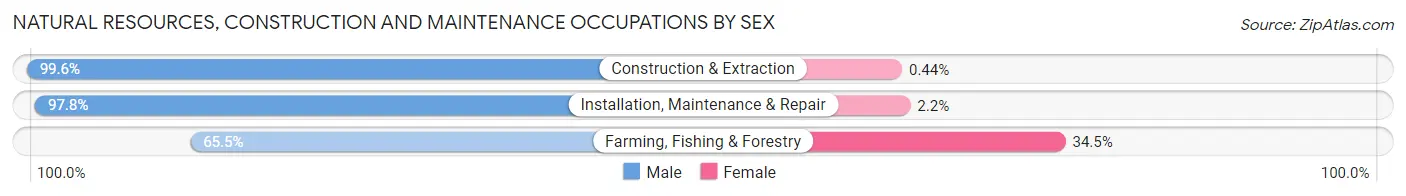
| Occupation | Male | Female |
| Farming, Fishing & Forestry | 3,999 (65.5%) | 2,103 (34.5%) |
| Construction & Extraction | 10,663 (99.6%) | 47 (0.4%) |
| Installation, Maintenance & Repair | 5,745 (97.8%) | 128 (2.2%) |
| Total (Category) | 20,407 (90.0%) | 2,278 (10.0%) |
| Total (Overall) | 95,943 (55.2%) | 77,964 (44.8%) |
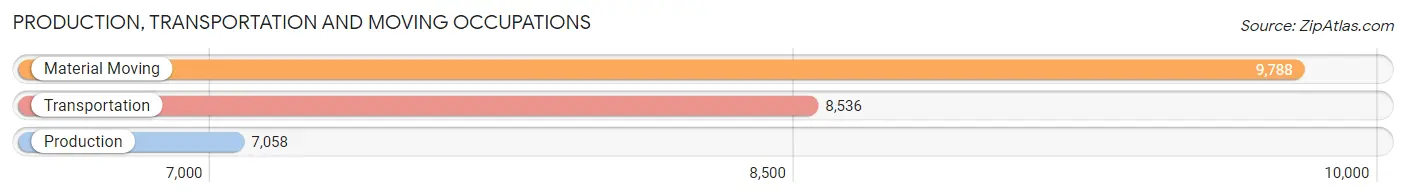
Production, Transportation and Moving Occupations
The most common Production, Transportation and Moving occupations in Bakersfield are Material Moving (9,788 | 5.6%), Transportation (8,536 | 4.9%), and Production (7,058 | 4.1%).
Production, Transportation and Moving Occupations by Sex
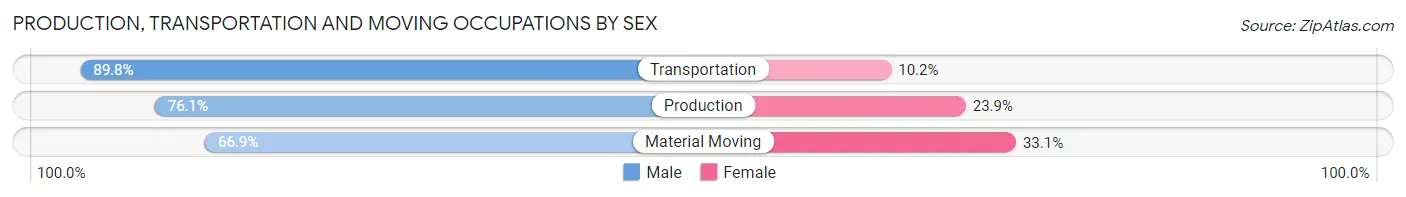
| Occupation | Male | Female |
| Production | 5,371 (76.1%) | 1,687 (23.9%) |
| Transportation | 7,663 (89.8%) | 873 (10.2%) |
| Material Moving | 6,547 (66.9%) | 3,241 (33.1%) |
| Total (Category) | 19,581 (77.1%) | 5,801 (22.9%) |
| Total (Overall) | 95,943 (55.2%) | 77,964 (44.8%) |
Employment Industries by Sex in Bakersfield
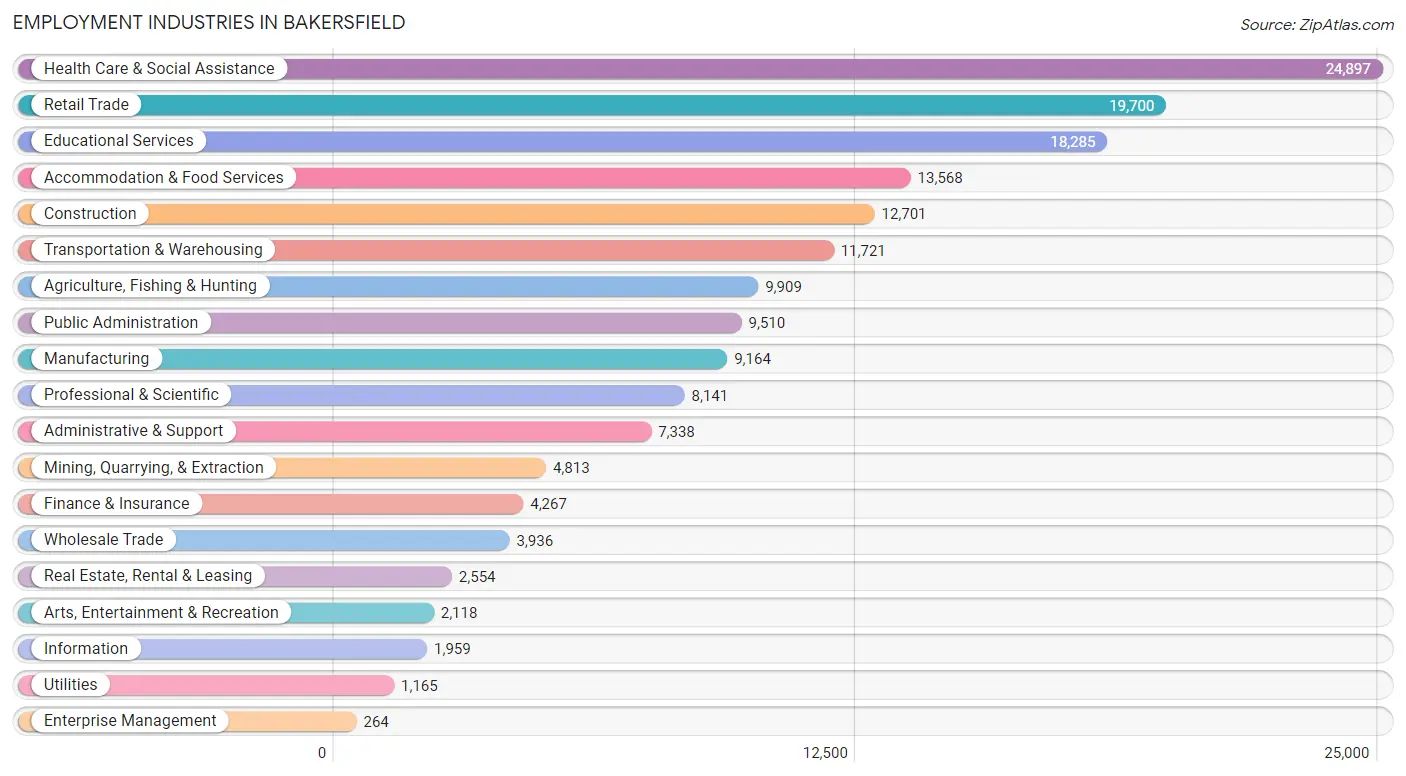
Employment Industries in Bakersfield
The major employment industries in Bakersfield include Health Care & Social Assistance (24,897 | 14.3%), Retail Trade (19,700 | 11.3%), Educational Services (18,285 | 10.5%), Accommodation & Food Services (13,568 | 7.8%), and Construction (12,701 | 7.3%).
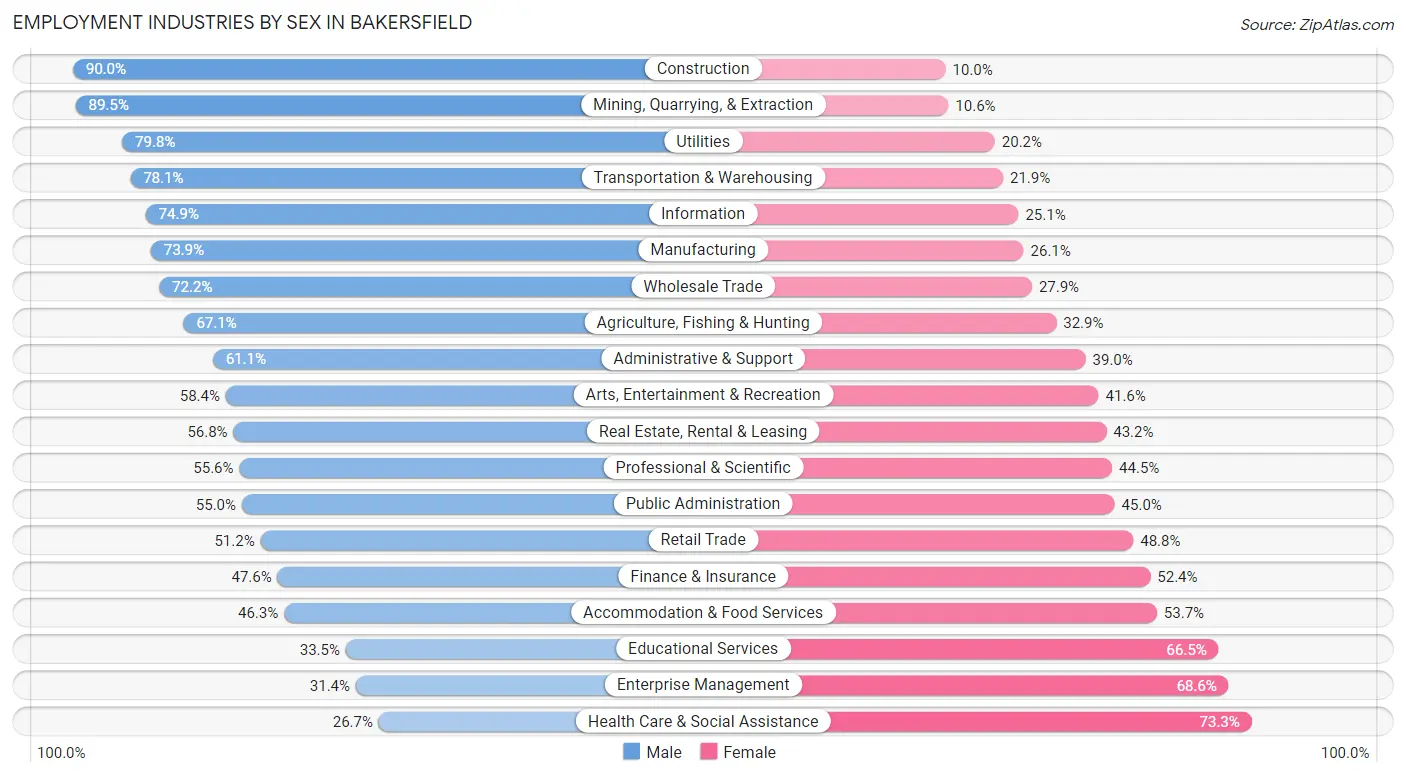
Employment Industries by Sex in Bakersfield
The Bakersfield industries that see more men than women are Construction (90.0%), Mining, Quarrying, & Extraction (89.4%), and Utilities (79.8%), whereas the industries that tend to have a higher number of women are Health Care & Social Assistance (73.3%), Enterprise Management (68.6%), and Educational Services (66.5%).
| Industry | Male | Female |
| Agriculture, Fishing & Hunting | 6,650 (67.1%) | 3,259 (32.9%) |
| Mining, Quarrying, & Extraction | 4,305 (89.4%) | 508 (10.5%) |
| Construction | 11,434 (90.0%) | 1,267 (10.0%) |
| Manufacturing | 6,770 (73.9%) | 2,394 (26.1%) |
| Wholesale Trade | 2,840 (72.2%) | 1,096 (27.9%) |
| Retail Trade | 10,082 (51.2%) | 9,618 (48.8%) |
| Transportation & Warehousing | 9,159 (78.1%) | 2,562 (21.9%) |
| Utilities | 930 (79.8%) | 235 (20.2%) |
| Information | 1,468 (74.9%) | 491 (25.1%) |
| Finance & Insurance | 2,033 (47.6%) | 2,234 (52.4%) |
| Real Estate, Rental & Leasing | 1,450 (56.8%) | 1,104 (43.2%) |
| Professional & Scientific | 4,522 (55.5%) | 3,619 (44.5%) |
| Enterprise Management | 83 (31.4%) | 181 (68.6%) |
| Administrative & Support | 4,480 (61.1%) | 2,858 (39.0%) |
| Educational Services | 6,130 (33.5%) | 12,155 (66.5%) |
| Health Care & Social Assistance | 6,645 (26.7%) | 18,252 (73.3%) |
| Arts, Entertainment & Recreation | 1,236 (58.4%) | 882 (41.6%) |
| Accommodation & Food Services | 6,280 (46.3%) | 7,288 (53.7%) |
| Public Administration | 5,233 (55.0%) | 4,277 (45.0%) |
| Total | 95,943 (55.2%) | 77,964 (44.8%) |
Education in Bakersfield
School Enrollment in Bakersfield
The most common levels of schooling among the 121,048 students in Bakersfield are middle school (28,406 | 23.5%), high school (27,833 | 23.0%), and elementary school (25,057 | 20.7%).
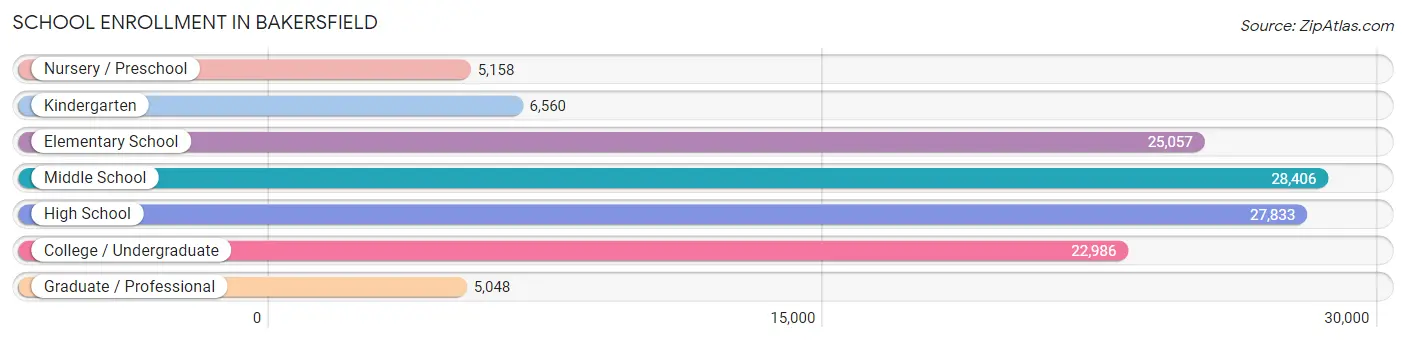
| School Level | # Students | % Students |
| Nursery / Preschool | 5,158 | 4.3% |
| Kindergarten | 6,560 | 5.4% |
| Elementary School | 25,057 | 20.7% |
| Middle School | 28,406 | 23.5% |
| High School | 27,833 | 23.0% |
| College / Undergraduate | 22,986 | 19.0% |
| Graduate / Professional | 5,048 | 4.2% |
| Total | 121,048 | 100.0% |
School Enrollment by Age by Funding Source in Bakersfield
Out of a total of 121,048 students who are enrolled in schools in Bakersfield, 11,257 (9.3%) attend a private institution, while the remaining 109,791 (90.7%) are enrolled in public schools. The age group of 3 to 4 year olds has the highest likelihood of being enrolled in private schools, with 1,474 (32.7% in the age bracket) enrolled. Conversely, the age group of 15 to 17 year olds has the lowest likelihood of being enrolled in a private school, with 19,385 (95.6% in the age bracket) attending a public institution.
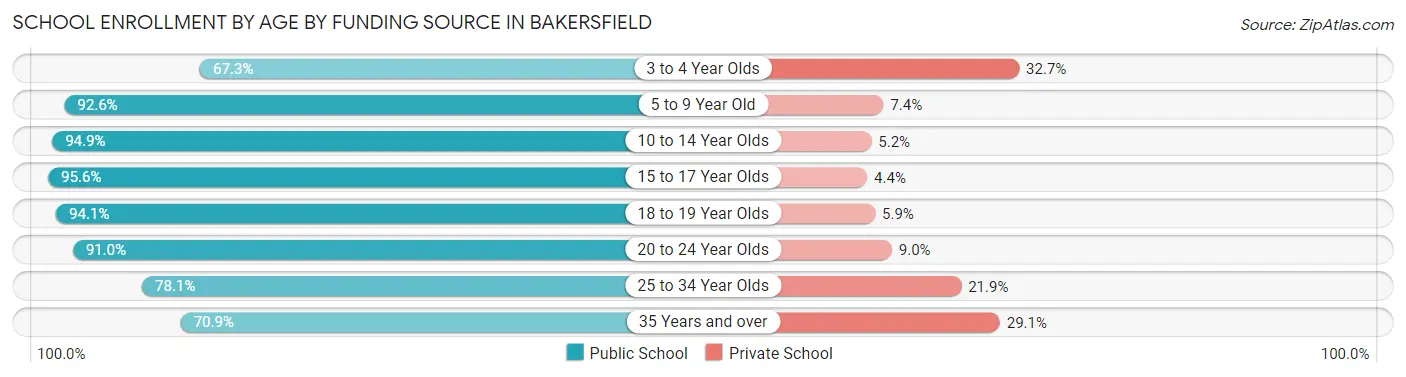
| Age Bracket | Public School | Private School |
| 3 to 4 Year Olds | 3,035 (67.3%) | 1,474 (32.7%) |
| 5 to 9 Year Old | 27,399 (92.6%) | 2,195 (7.4%) |
| 10 to 14 Year Olds | 33,310 (94.9%) | 1,808 (5.1%) |
| 15 to 17 Year Olds | 19,385 (95.6%) | 888 (4.4%) |
| 18 to 19 Year Olds | 6,140 (94.1%) | 382 (5.9%) |
| 20 to 24 Year Olds | 9,779 (91.0%) | 965 (9.0%) |
| 25 to 34 Year Olds | 6,516 (78.1%) | 1,827 (21.9%) |
| 35 Years and over | 4,216 (70.9%) | 1,729 (29.1%) |
| Total | 109,791 (90.7%) | 11,257 (9.3%) |
Educational Attainment by Field of Study in Bakersfield
Business (10,418 | 17.3%), science & technology (7,200 | 11.9%), liberal arts & history (4,975 | 8.3%), social sciences (4,956 | 8.2%), and education (4,774 | 7.9%) are the most common fields of study among 60,308 individuals in Bakersfield who have obtained a bachelor's degree or higher.
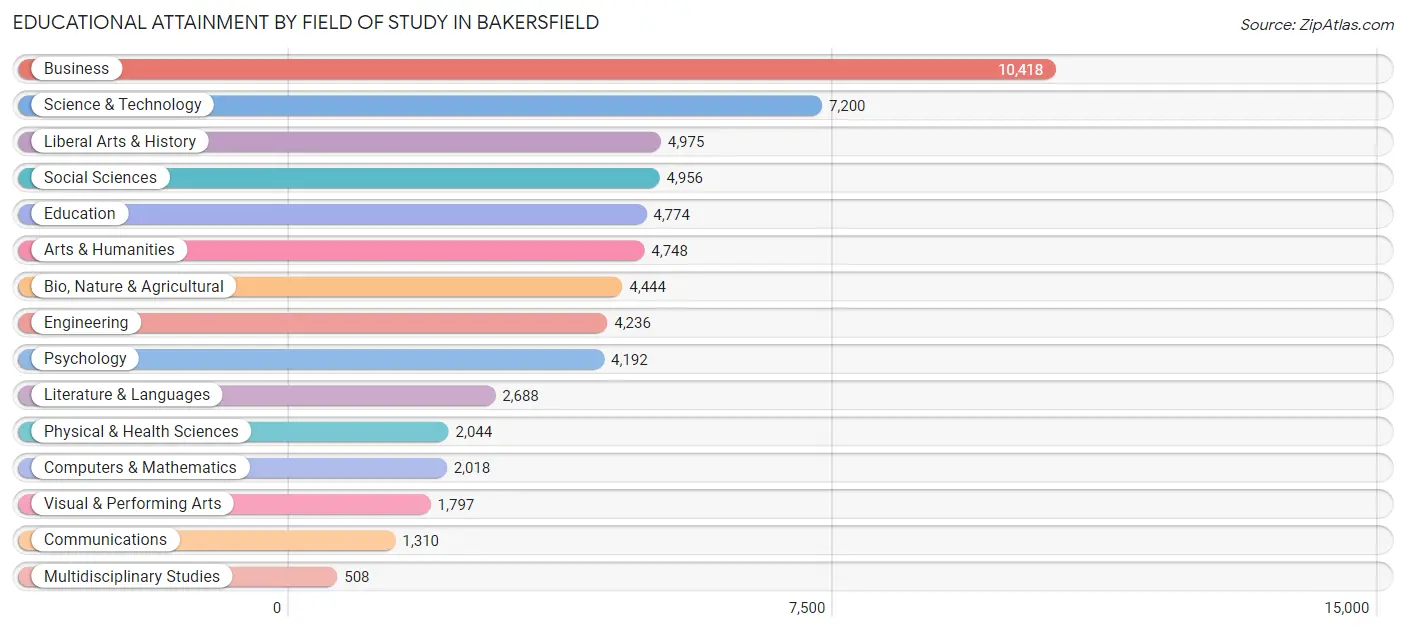
| Field of Study | # Graduates | % Graduates |
| Computers & Mathematics | 2,018 | 3.4% |
| Bio, Nature & Agricultural | 4,444 | 7.4% |
| Physical & Health Sciences | 2,044 | 3.4% |
| Psychology | 4,192 | 7.0% |
| Social Sciences | 4,956 | 8.2% |
| Engineering | 4,236 | 7.0% |
| Multidisciplinary Studies | 508 | 0.8% |
| Science & Technology | 7,200 | 11.9% |
| Business | 10,418 | 17.3% |
| Education | 4,774 | 7.9% |
| Literature & Languages | 2,688 | 4.5% |
| Liberal Arts & History | 4,975 | 8.3% |
| Visual & Performing Arts | 1,797 | 3.0% |
| Communications | 1,310 | 2.2% |
| Arts & Humanities | 4,748 | 7.9% |
| Total | 60,308 | 100.0% |
Transportation & Commute in Bakersfield
Vehicle Availability by Sex in Bakersfield
The most prevalent vehicle ownership categories in Bakersfield are males with 2 vehicles (40,695, accounting for 43.4%) and females with 2 vehicles (30,175, making up 54.3%).
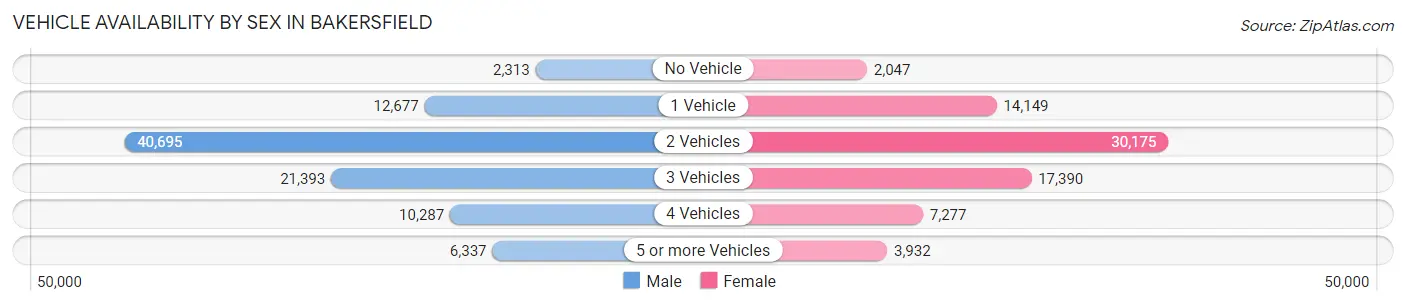
| Vehicles Available | Male | Female |
| No Vehicle | 2,313 (2.5%) | 2,047 (2.7%) |
| 1 Vehicle | 12,677 (13.5%) | 14,149 (18.9%) |
| 2 Vehicles | 40,695 (43.4%) | 30,175 (40.3%) |
| 3 Vehicles | 21,393 (22.8%) | 17,390 (23.2%) |
| 4 Vehicles | 10,287 (11.0%) | 7,277 (9.7%) |
| 5 or more Vehicles | 6,337 (6.8%) | 3,932 (5.2%) |
| Total | 93,702 (100.0%) | 74,970 (100.0%) |
Commute Time in Bakersfield
The most frequently occuring commute durations in Bakersfield are 15 to 19 minutes (37,782 commuters, 24.0%), 20 to 24 minutes (32,760 commuters, 20.8%), and 10 to 14 minutes (21,765 commuters, 13.8%).
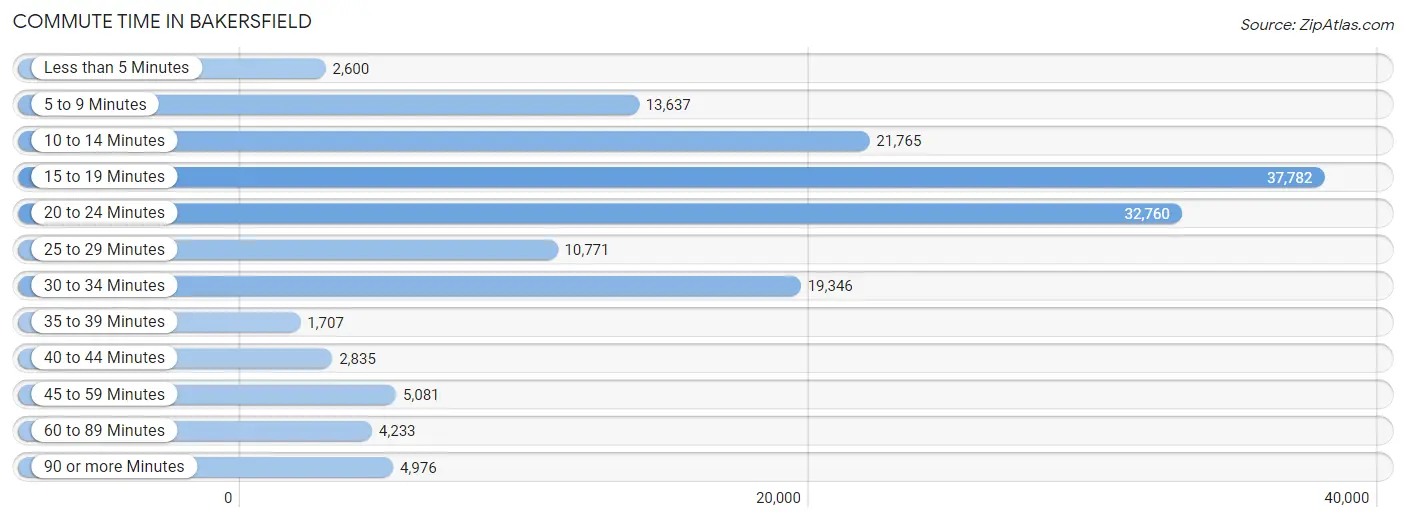
| Commute Time | # Commuters | % Commuters |
| Less than 5 Minutes | 2,600 | 1.7% |
| 5 to 9 Minutes | 13,637 | 8.7% |
| 10 to 14 Minutes | 21,765 | 13.8% |
| 15 to 19 Minutes | 37,782 | 24.0% |
| 20 to 24 Minutes | 32,760 | 20.8% |
| 25 to 29 Minutes | 10,771 | 6.8% |
| 30 to 34 Minutes | 19,346 | 12.3% |
| 35 to 39 Minutes | 1,707 | 1.1% |
| 40 to 44 Minutes | 2,835 | 1.8% |
| 45 to 59 Minutes | 5,081 | 3.2% |
| 60 to 89 Minutes | 4,233 | 2.7% |
| 90 or more Minutes | 4,976 | 3.2% |
Commute Time by Sex in Bakersfield
The most common commute times in Bakersfield are 15 to 19 minutes (20,133 commuters, 22.7%) for males and 15 to 19 minutes (17,649 commuters, 25.6%) for females.
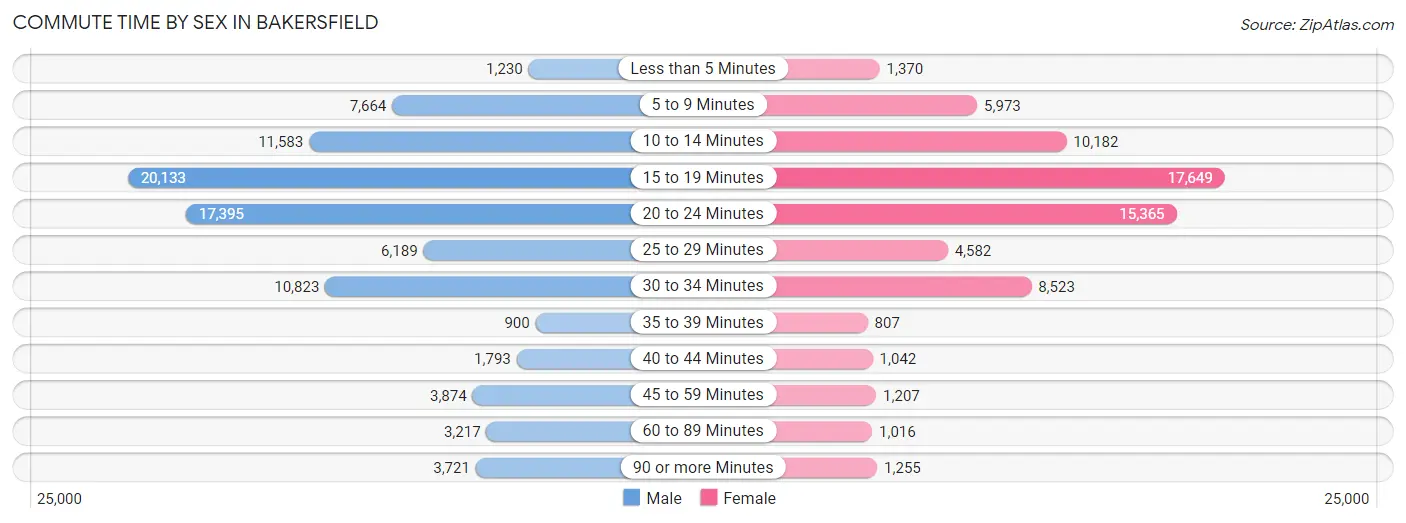
| Commute Time | Male | Female |
| Less than 5 Minutes | 1,230 (1.4%) | 1,370 (2.0%) |
| 5 to 9 Minutes | 7,664 (8.7%) | 5,973 (8.7%) |
| 10 to 14 Minutes | 11,583 (13.1%) | 10,182 (14.8%) |
| 15 to 19 Minutes | 20,133 (22.7%) | 17,649 (25.6%) |
| 20 to 24 Minutes | 17,395 (19.7%) | 15,365 (22.3%) |
| 25 to 29 Minutes | 6,189 (7.0%) | 4,582 (6.6%) |
| 30 to 34 Minutes | 10,823 (12.2%) | 8,523 (12.4%) |
| 35 to 39 Minutes | 900 (1.0%) | 807 (1.2%) |
| 40 to 44 Minutes | 1,793 (2.0%) | 1,042 (1.5%) |
| 45 to 59 Minutes | 3,874 (4.4%) | 1,207 (1.8%) |
| 60 to 89 Minutes | 3,217 (3.6%) | 1,016 (1.5%) |
| 90 or more Minutes | 3,721 (4.2%) | 1,255 (1.8%) |
Time of Departure to Work by Sex in Bakersfield
The most frequent times of departure to work in Bakersfield are 6:00 AM to 6:29 AM (11,769, 13.3%) for males and 7:00 AM to 7:29 AM (11,524, 16.7%) for females.
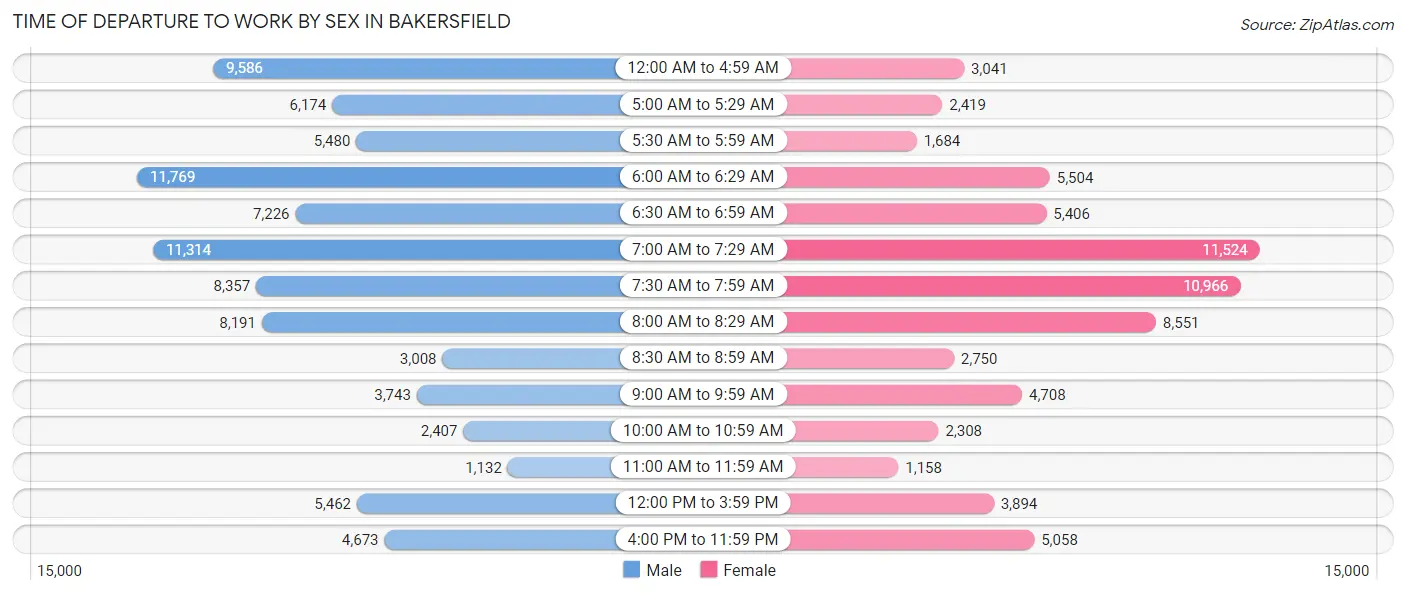
| Time of Departure | Male | Female |
| 12:00 AM to 4:59 AM | 9,586 (10.8%) | 3,041 (4.4%) |
| 5:00 AM to 5:29 AM | 6,174 (7.0%) | 2,419 (3.5%) |
| 5:30 AM to 5:59 AM | 5,480 (6.2%) | 1,684 (2.4%) |
| 6:00 AM to 6:29 AM | 11,769 (13.3%) | 5,504 (8.0%) |
| 6:30 AM to 6:59 AM | 7,226 (8.2%) | 5,406 (7.8%) |
| 7:00 AM to 7:29 AM | 11,314 (12.8%) | 11,524 (16.7%) |
| 7:30 AM to 7:59 AM | 8,357 (9.4%) | 10,966 (15.9%) |
| 8:00 AM to 8:29 AM | 8,191 (9.2%) | 8,551 (12.4%) |
| 8:30 AM to 8:59 AM | 3,008 (3.4%) | 2,750 (4.0%) |
| 9:00 AM to 9:59 AM | 3,743 (4.2%) | 4,708 (6.8%) |
| 10:00 AM to 10:59 AM | 2,407 (2.7%) | 2,308 (3.4%) |
| 11:00 AM to 11:59 AM | 1,132 (1.3%) | 1,158 (1.7%) |
| 12:00 PM to 3:59 PM | 5,462 (6.2%) | 3,894 (5.7%) |
| 4:00 PM to 11:59 PM | 4,673 (5.3%) | 5,058 (7.3%) |
| Total | 88,522 (100.0%) | 68,971 (100.0%) |
Housing Occupancy in Bakersfield
Occupancy by Ownership in Bakersfield
Of the total 124,744 dwellings in Bakersfield, owner-occupied units account for 75,147 (60.2%), while renter-occupied units make up 49,597 (39.8%).
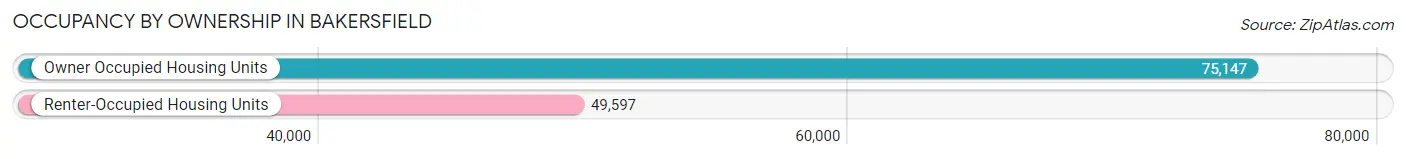
| Occupancy | # Housing Units | % Housing Units |
| Owner Occupied Housing Units | 75,147 | 60.2% |
| Renter-Occupied Housing Units | 49,597 | 39.8% |
| Total Occupied Housing Units | 124,744 | 100.0% |
Occupancy by Household Size in Bakersfield
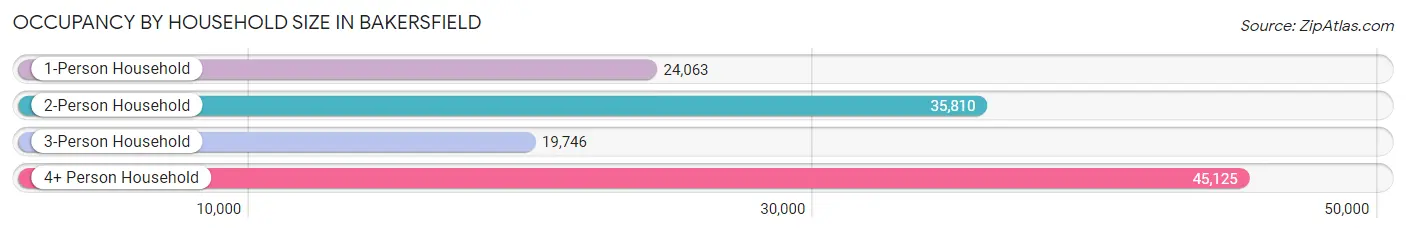
| Household Size | # Housing Units | % Housing Units |
| 1-Person Household | 24,063 | 19.3% |
| 2-Person Household | 35,810 | 28.7% |
| 3-Person Household | 19,746 | 15.8% |
| 4+ Person Household | 45,125 | 36.2% |
| Total Housing Units | 124,744 | 100.0% |
Occupancy by Ownership by Household Size in Bakersfield
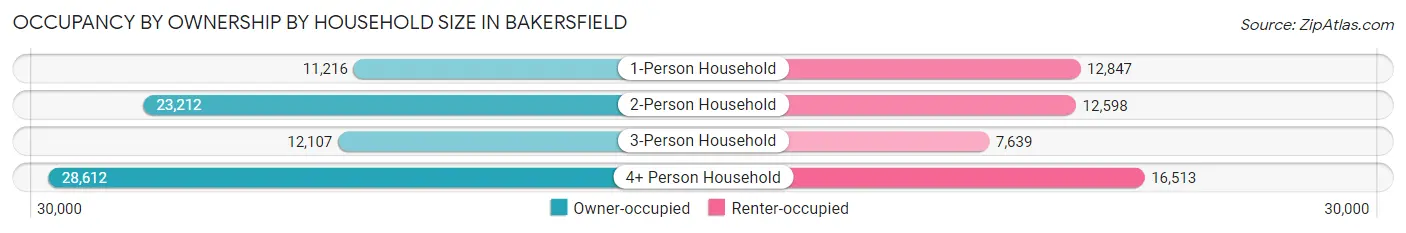
| Household Size | Owner-occupied | Renter-occupied |
| 1-Person Household | 11,216 (46.6%) | 12,847 (53.4%) |
| 2-Person Household | 23,212 (64.8%) | 12,598 (35.2%) |
| 3-Person Household | 12,107 (61.3%) | 7,639 (38.7%) |
| 4+ Person Household | 28,612 (63.4%) | 16,513 (36.6%) |
| Total Housing Units | 75,147 (60.2%) | 49,597 (39.8%) |
Occupancy by Educational Attainment in Bakersfield
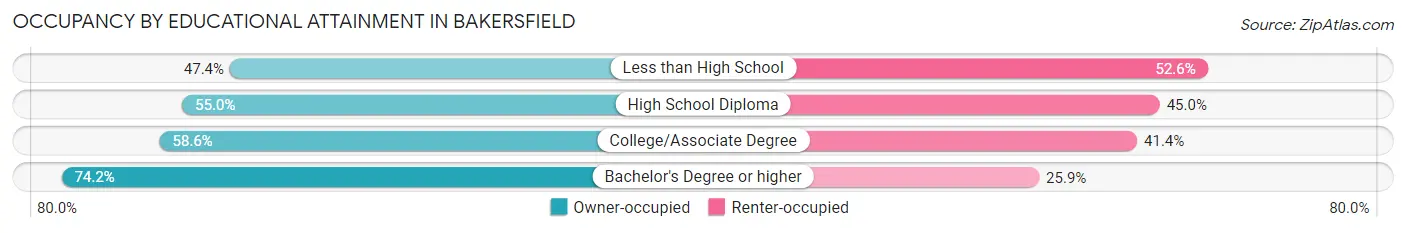
| Household Size | Owner-occupied | Renter-occupied |
| Less than High School | 9,327 (47.4%) | 10,333 (52.6%) |
| High School Diploma | 15,101 (55.0%) | 12,343 (45.0%) |
| College/Associate Degree | 25,846 (58.6%) | 18,249 (41.4%) |
| Bachelor's Degree or higher | 24,873 (74.2%) | 8,672 (25.9%) |
Occupancy by Age of Householder in Bakersfield
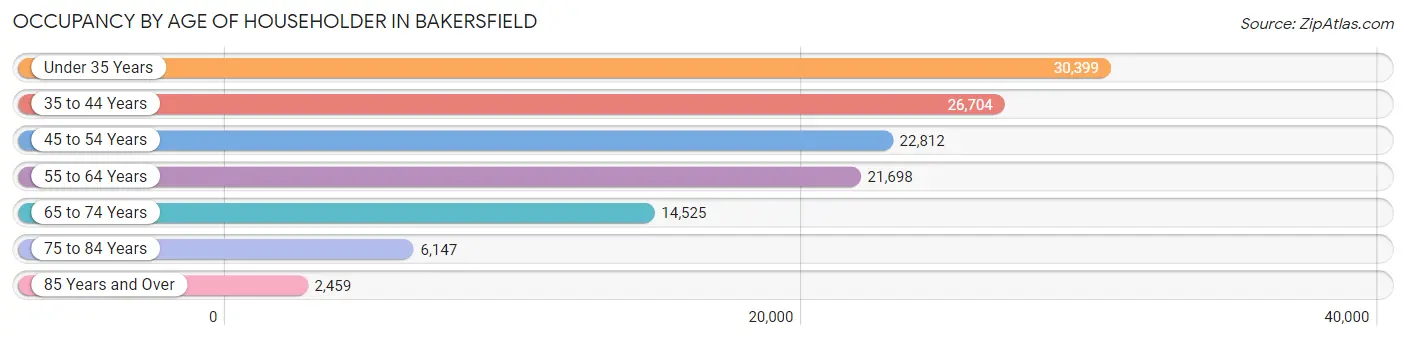
| Age Bracket | # Households | % Households |
| Under 35 Years | 30,399 | 24.4% |
| 35 to 44 Years | 26,704 | 21.4% |
| 45 to 54 Years | 22,812 | 18.3% |
| 55 to 64 Years | 21,698 | 17.4% |
| 65 to 74 Years | 14,525 | 11.6% |
| 75 to 84 Years | 6,147 | 4.9% |
| 85 Years and Over | 2,459 | 2.0% |
| Total | 124,744 | 100.0% |
Housing Finances in Bakersfield
Median Income by Occupancy in Bakersfield
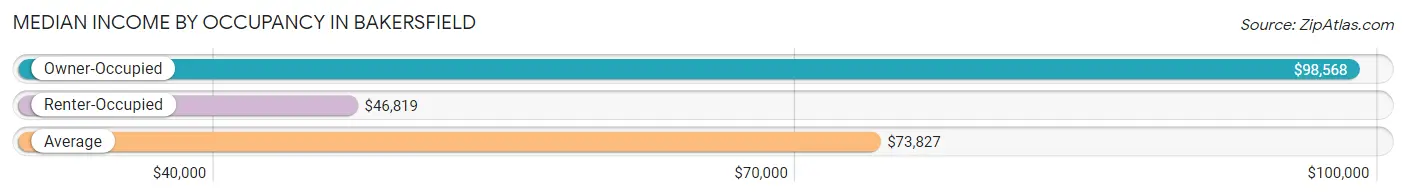
| Occupancy Type | # Households | Median Income |
| Owner-Occupied | 75,147 (60.2%) | $98,568 |
| Renter-Occupied | 49,597 (39.8%) | $46,819 |
| Average | 124,744 (100.0%) | $73,827 |
Occupancy by Householder Income Bracket in Bakersfield
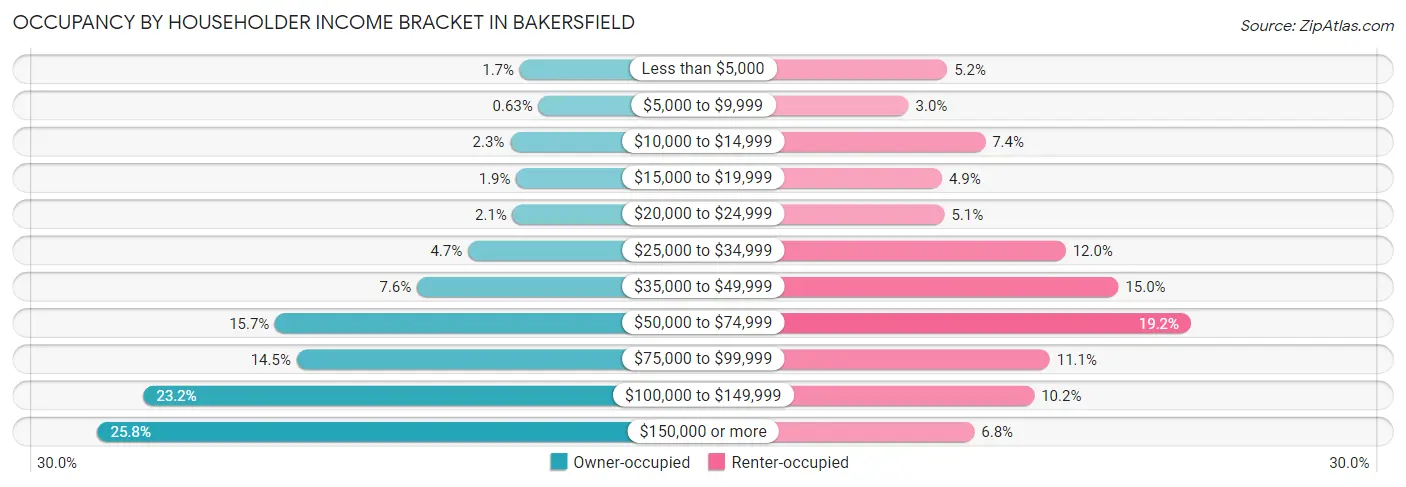
| Income Bracket | Owner-occupied | Renter-occupied |
| Less than $5,000 | 1,280 (1.7%) | 2,597 (5.2%) |
| $5,000 to $9,999 | 474 (0.6%) | 1,503 (3.0%) |
| $10,000 to $14,999 | 1,694 (2.2%) | 3,676 (7.4%) |
| $15,000 to $19,999 | 1,429 (1.9%) | 2,451 (4.9%) |
| $20,000 to $24,999 | 1,582 (2.1%) | 2,521 (5.1%) |
| $25,000 to $34,999 | 3,503 (4.7%) | 5,957 (12.0%) |
| $35,000 to $49,999 | 5,688 (7.6%) | 7,448 (15.0%) |
| $50,000 to $74,999 | 11,786 (15.7%) | 9,505 (19.2%) |
| $75,000 to $99,999 | 10,856 (14.4%) | 5,505 (11.1%) |
| $100,000 to $149,999 | 17,442 (23.2%) | 5,065 (10.2%) |
| $150,000 or more | 19,413 (25.8%) | 3,369 (6.8%) |
| Total | 75,147 (100.0%) | 49,597 (100.0%) |
Monthly Housing Cost Tiers in Bakersfield
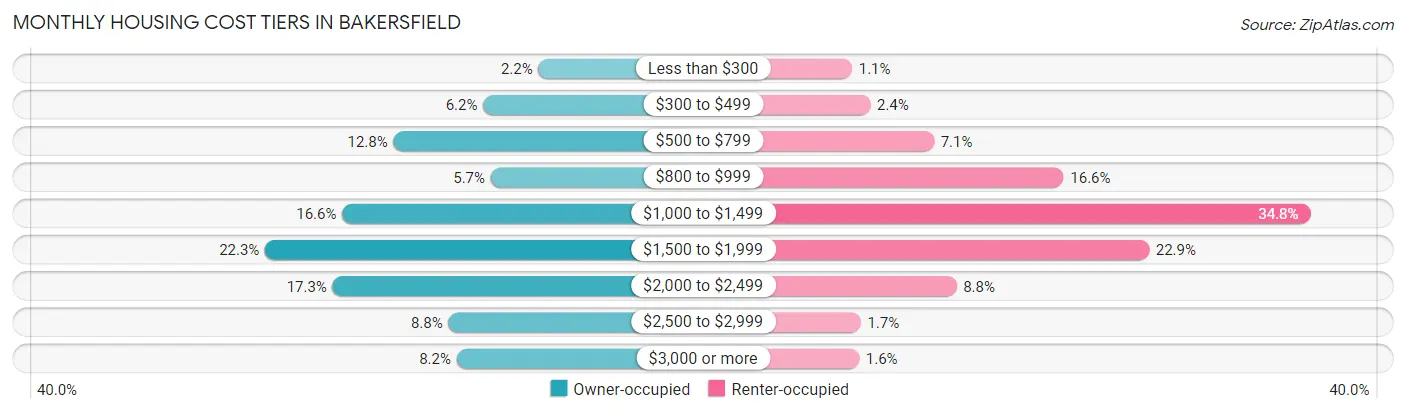
| Monthly Cost | Owner-occupied | Renter-occupied |
| Less than $300 | 1,618 (2.1%) | 525 (1.1%) |
| $300 to $499 | 4,674 (6.2%) | 1,188 (2.4%) |
| $500 to $799 | 9,644 (12.8%) | 3,517 (7.1%) |
| $800 to $999 | 4,251 (5.7%) | 8,251 (16.6%) |
| $1,000 to $1,499 | 12,472 (16.6%) | 17,277 (34.8%) |
| $1,500 to $1,999 | 16,741 (22.3%) | 11,372 (22.9%) |
| $2,000 to $2,499 | 13,009 (17.3%) | 4,338 (8.7%) |
| $2,500 to $2,999 | 6,601 (8.8%) | 843 (1.7%) |
| $3,000 or more | 6,137 (8.2%) | 786 (1.6%) |
| Total | 75,147 (100.0%) | 49,597 (100.0%) |
Physical Housing Characteristics in Bakersfield
Housing Structures in Bakersfield
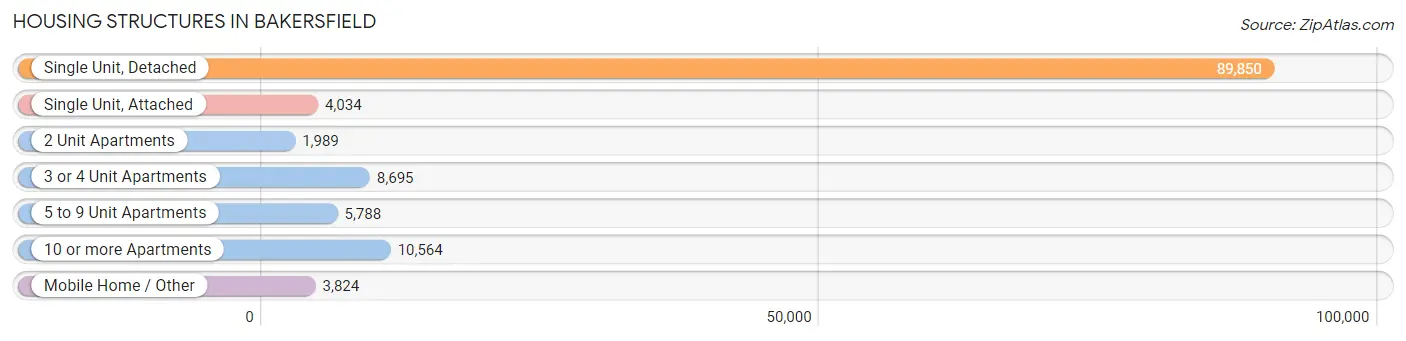
| Structure Type | # Housing Units | % Housing Units |
| Single Unit, Detached | 89,850 | 72.0% |
| Single Unit, Attached | 4,034 | 3.2% |
| 2 Unit Apartments | 1,989 | 1.6% |
| 3 or 4 Unit Apartments | 8,695 | 7.0% |
| 5 to 9 Unit Apartments | 5,788 | 4.6% |
| 10 or more Apartments | 10,564 | 8.5% |
| Mobile Home / Other | 3,824 | 3.1% |
| Total | 124,744 | 100.0% |
Housing Structures by Occupancy in Bakersfield
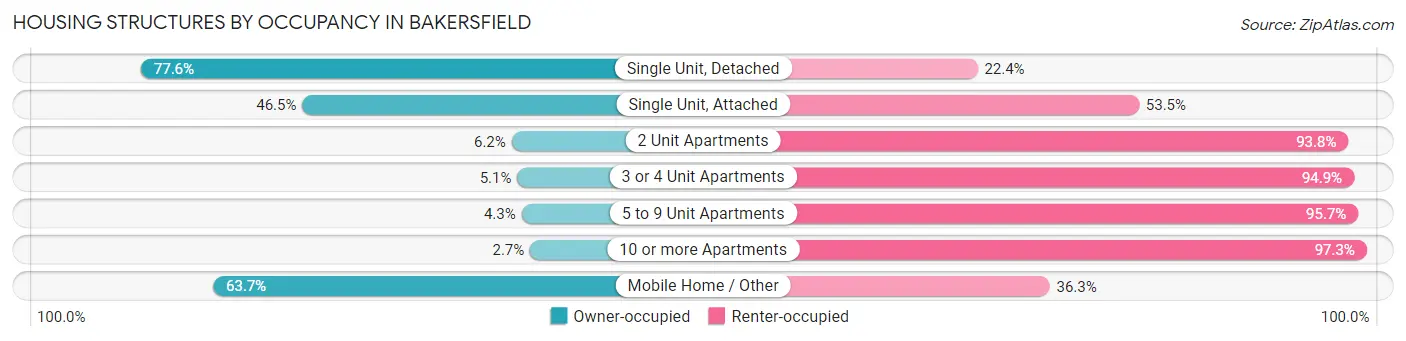
| Structure Type | Owner-occupied | Renter-occupied |
| Single Unit, Detached | 69,731 (77.6%) | 20,119 (22.4%) |
| Single Unit, Attached | 1,877 (46.5%) | 2,157 (53.5%) |
| 2 Unit Apartments | 124 (6.2%) | 1,865 (93.8%) |
| 3 or 4 Unit Apartments | 446 (5.1%) | 8,249 (94.9%) |
| 5 to 9 Unit Apartments | 250 (4.3%) | 5,538 (95.7%) |
| 10 or more Apartments | 282 (2.7%) | 10,282 (97.3%) |
| Mobile Home / Other | 2,437 (63.7%) | 1,387 (36.3%) |
| Total | 75,147 (60.2%) | 49,597 (39.8%) |
Housing Structures by Number of Rooms in Bakersfield
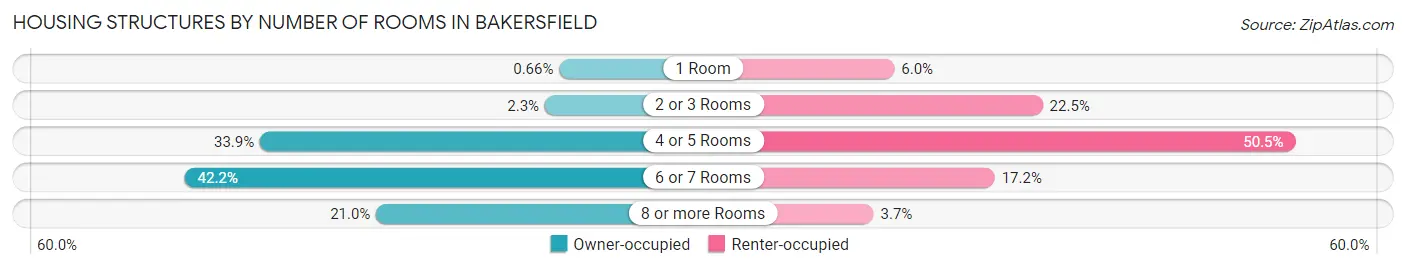
| Number of Rooms | Owner-occupied | Renter-occupied |
| 1 Room | 499 (0.7%) | 2,998 (6.0%) |
| 2 or 3 Rooms | 1,689 (2.2%) | 11,161 (22.5%) |
| 4 or 5 Rooms | 25,450 (33.9%) | 25,064 (50.5%) |
| 6 or 7 Rooms | 31,741 (42.2%) | 8,519 (17.2%) |
| 8 or more Rooms | 15,768 (21.0%) | 1,855 (3.7%) |
| Total | 75,147 (100.0%) | 49,597 (100.0%) |
Housing Structure by Heating Type in Bakersfield
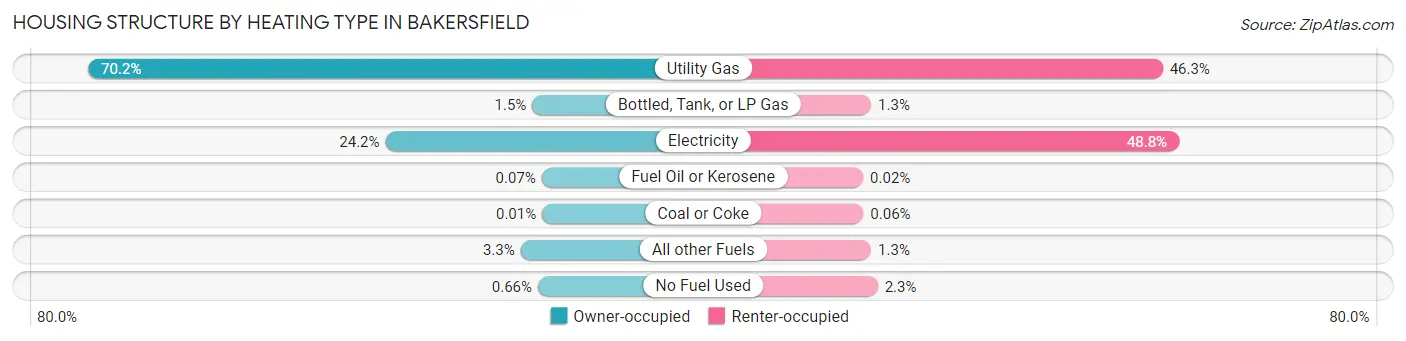
| Heating Type | Owner-occupied | Renter-occupied |
| Utility Gas | 52,743 (70.2%) | 22,974 (46.3%) |
| Bottled, Tank, or LP Gas | 1,152 (1.5%) | 620 (1.3%) |
| Electricity | 18,206 (24.2%) | 24,217 (48.8%) |
| Fuel Oil or Kerosene | 52 (0.1%) | 10 (0.0%) |
| Coal or Coke | 4 (0.0%) | 30 (0.1%) |
| All other Fuels | 2,495 (3.3%) | 619 (1.3%) |
| No Fuel Used | 495 (0.7%) | 1,127 (2.3%) |
| Total | 75,147 (100.0%) | 49,597 (100.0%) |
Household Vehicle Usage in Bakersfield
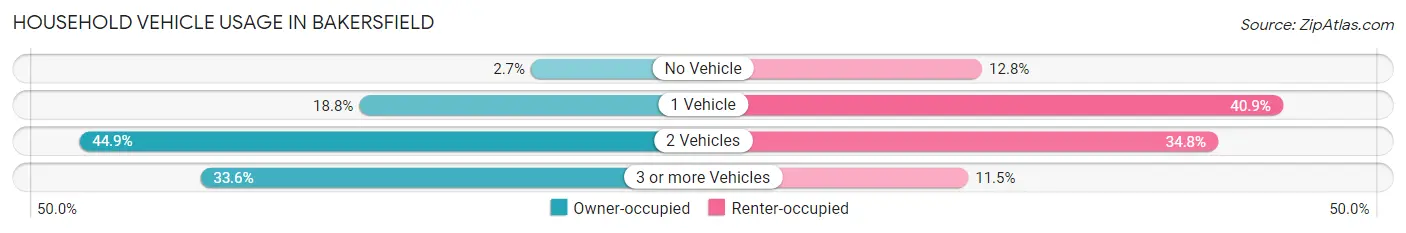
| Vehicles per Household | Owner-occupied | Renter-occupied |
| No Vehicle | 2,057 (2.7%) | 6,351 (12.8%) |
| 1 Vehicle | 14,108 (18.8%) | 20,265 (40.9%) |
| 2 Vehicles | 33,730 (44.9%) | 17,267 (34.8%) |
| 3 or more Vehicles | 25,252 (33.6%) | 5,714 (11.5%) |
| Total | 75,147 (100.0%) | 49,597 (100.0%) |
Real Estate & Mortgages in Bakersfield
Real Estate and Mortgage Overview in Bakersfield
| Characteristic | Without Mortgage | With Mortgage |
| Housing Units | 20,494 | 54,653 |
| Median Property Value | $294,200 | $328,200 |
| Median Household Income | $71,264 | $15,359 |
| Monthly Housing Costs | $645 | $6,036 |
| Real Estate Taxes | $2,866 | $1,043 |
Property Value by Mortgage Status in Bakersfield
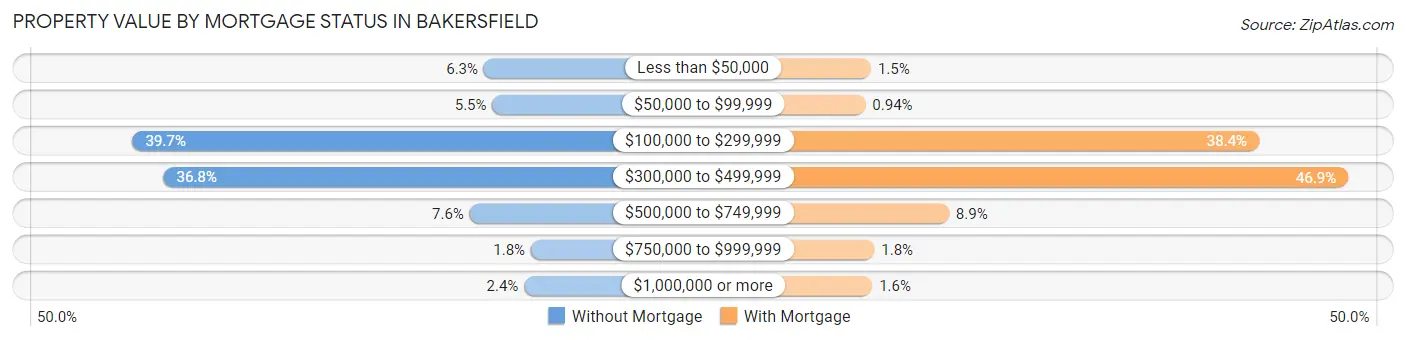
| Property Value | Without Mortgage | With Mortgage |
| Less than $50,000 | 1,283 (6.3%) | 806 (1.5%) |
| $50,000 to $99,999 | 1,117 (5.4%) | 516 (0.9%) |
| $100,000 to $299,999 | 8,141 (39.7%) | 20,990 (38.4%) |
| $300,000 to $499,999 | 7,533 (36.8%) | 25,639 (46.9%) |
| $500,000 to $749,999 | 1,560 (7.6%) | 4,857 (8.9%) |
| $750,000 to $999,999 | 364 (1.8%) | 976 (1.8%) |
| $1,000,000 or more | 496 (2.4%) | 869 (1.6%) |
| Total | 20,494 (100.0%) | 54,653 (100.0%) |
Household Income by Mortgage Status in Bakersfield
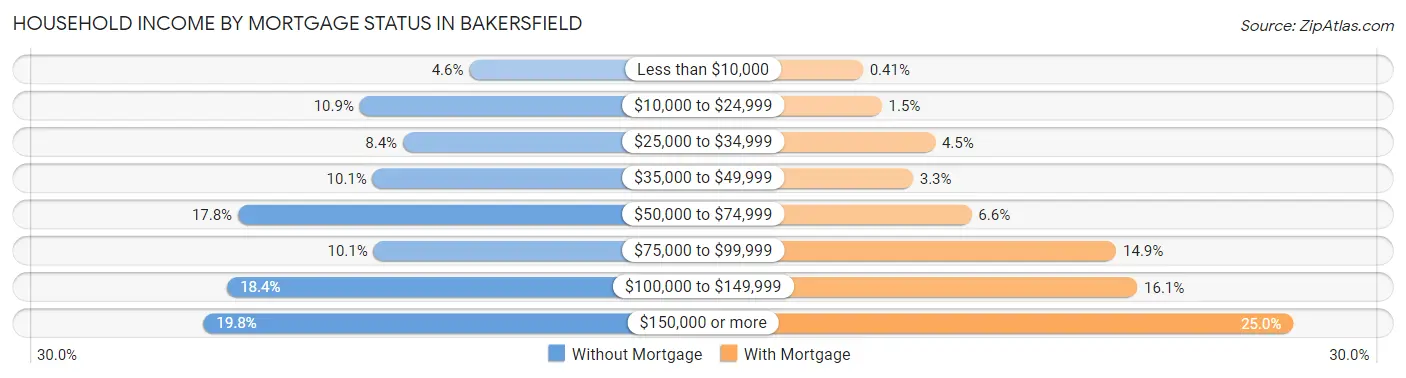
| Household Income | Without Mortgage | With Mortgage |
| Less than $10,000 | 941 (4.6%) | 224 (0.4%) |
| $10,000 to $24,999 | 2,223 (10.8%) | 813 (1.5%) |
| $25,000 to $34,999 | 1,717 (8.4%) | 2,482 (4.5%) |
| $35,000 to $49,999 | 2,072 (10.1%) | 1,786 (3.3%) |
| $50,000 to $74,999 | 3,649 (17.8%) | 3,616 (6.6%) |
| $75,000 to $99,999 | 2,062 (10.1%) | 8,137 (14.9%) |
| $100,000 to $149,999 | 3,776 (18.4%) | 8,794 (16.1%) |
| $150,000 or more | 4,054 (19.8%) | 13,666 (25.0%) |
| Total | 20,494 (100.0%) | 54,653 (100.0%) |
Property Value to Household Income Ratio in Bakersfield
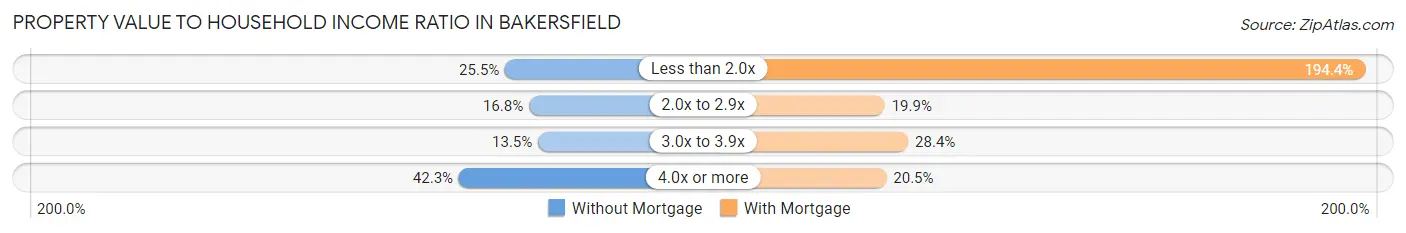
| Value-to-Income Ratio | Without Mortgage | With Mortgage |
| Less than 2.0x | 5,216 (25.5%) | 106,246 (194.4%) |
| 2.0x to 2.9x | 3,441 (16.8%) | 10,883 (19.9%) |
| 3.0x to 3.9x | 2,763 (13.5%) | 15,531 (28.4%) |
| 4.0x or more | 8,658 (42.2%) | 11,205 (20.5%) |
| Total | 20,494 (100.0%) | 54,653 (100.0%) |
Real Estate Taxes by Mortgage Status in Bakersfield
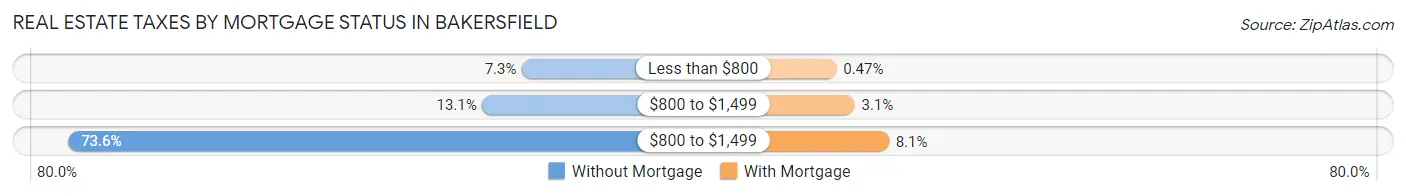
| Property Taxes | Without Mortgage | With Mortgage |
| Less than $800 | 1,491 (7.3%) | 257 (0.5%) |
| $800 to $1,499 | 2,683 (13.1%) | 1,715 (3.1%) |
| $800 to $1,499 | 15,087 (73.6%) | 4,441 (8.1%) |
| Total | 20,494 (100.0%) | 54,653 (100.0%) |
Health & Disability in Bakersfield
Health Insurance Coverage by Age in Bakersfield
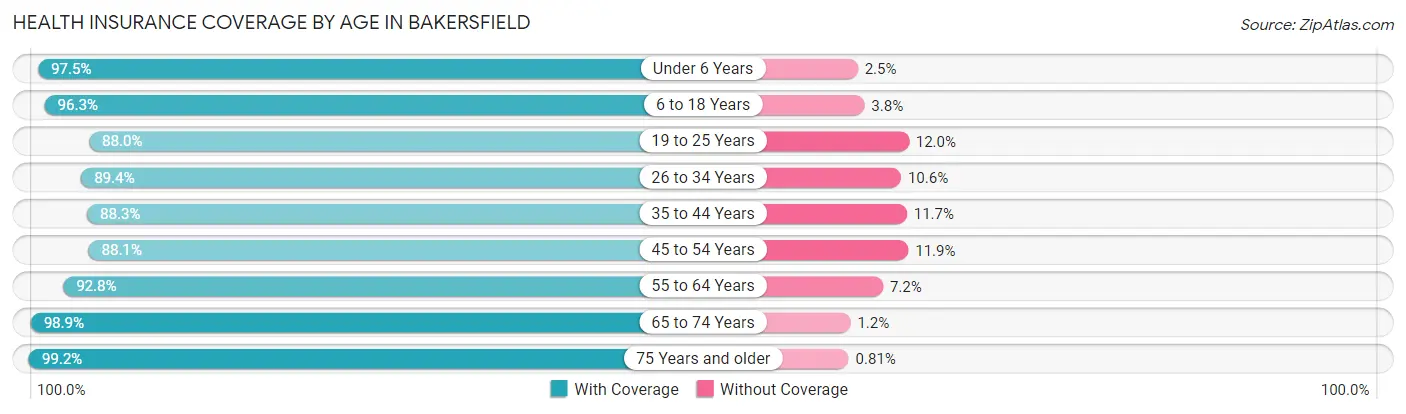
| Age Bracket | With Coverage | Without Coverage |
| Under 6 Years | 37,024 (97.5%) | 948 (2.5%) |
| 6 to 18 Years | 84,630 (96.3%) | 3,294 (3.7%) |
| 19 to 25 Years | 36,184 (88.0%) | 4,949 (12.0%) |
| 26 to 34 Years | 51,224 (89.4%) | 6,057 (10.6%) |
| 35 to 44 Years | 45,938 (88.3%) | 6,062 (11.7%) |
| 45 to 54 Years | 39,888 (88.1%) | 5,407 (11.9%) |
| 55 to 64 Years | 36,738 (92.8%) | 2,854 (7.2%) |
| 65 to 74 Years | 25,346 (98.9%) | 294 (1.1%) |
| 75 Years and older | 15,447 (99.2%) | 126 (0.8%) |
| Total | 372,419 (92.5%) | 29,991 (7.4%) |
Health Insurance Coverage by Citizenship Status in Bakersfield
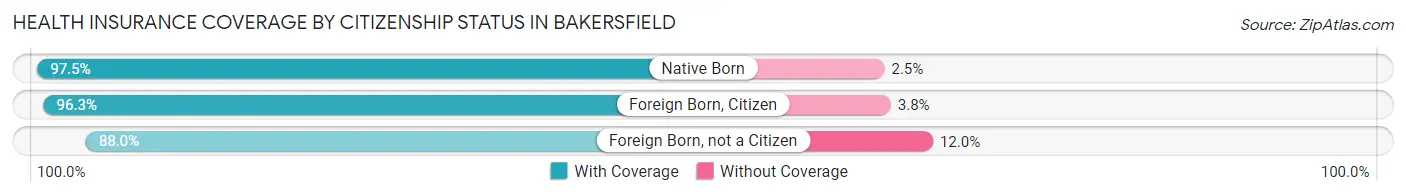
| Citizenship Status | With Coverage | Without Coverage |
| Native Born | 37,024 (97.5%) | 948 (2.5%) |
| Foreign Born, Citizen | 84,630 (96.3%) | 3,294 (3.7%) |
| Foreign Born, not a Citizen | 36,184 (88.0%) | 4,949 (12.0%) |
Health Insurance Coverage by Household Income in Bakersfield
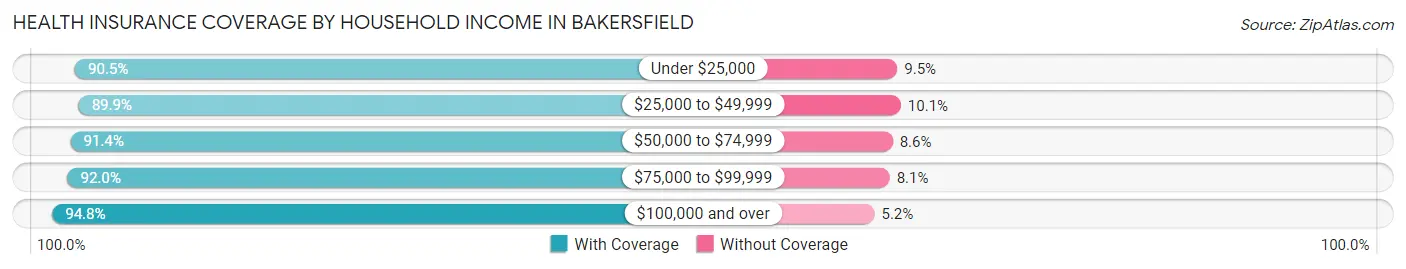
| Household Income | With Coverage | Without Coverage |
| Under $25,000 | 39,502 (90.5%) | 4,134 (9.5%) |
| $25,000 to $49,999 | 59,081 (89.9%) | 6,666 (10.1%) |
| $50,000 to $74,999 | 62,251 (91.4%) | 5,854 (8.6%) |
| $75,000 to $99,999 | 50,646 (91.9%) | 4,431 (8.1%) |
| $100,000 and over | 157,678 (94.8%) | 8,650 (5.2%) |
Public vs Private Health Insurance Coverage by Age in Bakersfield
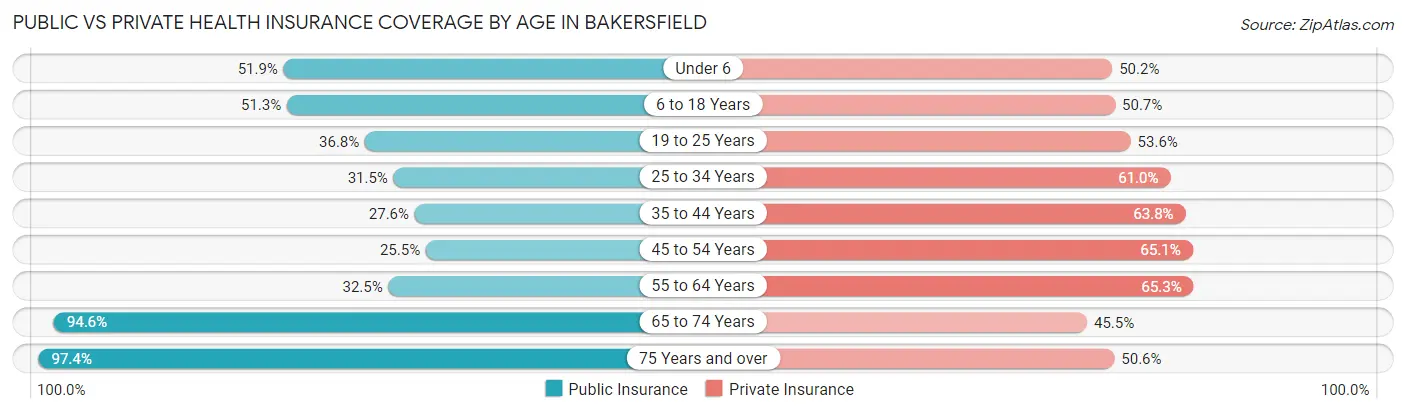
| Age Bracket | Public Insurance | Private Insurance |
| Under 6 | 19,710 (51.9%) | 19,062 (50.2%) |
| 6 to 18 Years | 45,090 (51.3%) | 44,600 (50.7%) |
| 19 to 25 Years | 15,135 (36.8%) | 22,054 (53.6%) |
| 25 to 34 Years | 18,037 (31.5%) | 34,917 (61.0%) |
| 35 to 44 Years | 14,332 (27.6%) | 33,165 (63.8%) |
| 45 to 54 Years | 11,550 (25.5%) | 29,492 (65.1%) |
| 55 to 64 Years | 12,849 (32.5%) | 25,849 (65.3%) |
| 65 to 74 Years | 24,246 (94.6%) | 11,672 (45.5%) |
| 75 Years and over | 15,169 (97.4%) | 7,878 (50.6%) |
| Total | 176,118 (43.8%) | 228,689 (56.8%) |
Disability Status by Sex by Age in Bakersfield
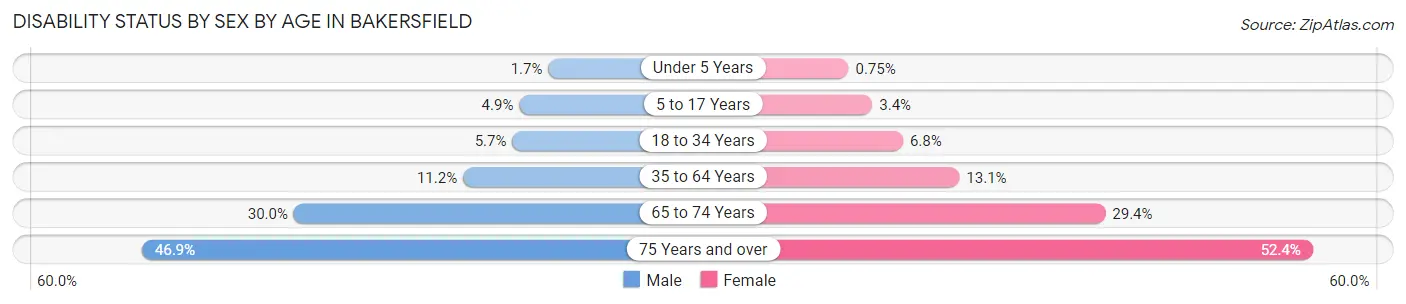
| Age Bracket | Male | Female |
| Under 5 Years | 279 (1.7%) | 113 (0.7%) |
| 5 to 17 Years | 2,235 (4.9%) | 1,472 (3.4%) |
| 18 to 34 Years | 2,970 (5.7%) | 3,511 (6.8%) |
| 35 to 64 Years | 7,601 (11.2%) | 9,022 (13.1%) |
| 65 to 74 Years | 3,487 (30.0%) | 4,116 (29.3%) |
| 75 Years and over | 3,074 (46.9%) | 4,732 (52.4%) |
Disability Class by Sex by Age in Bakersfield
Disability Class: Hearing Difficulty
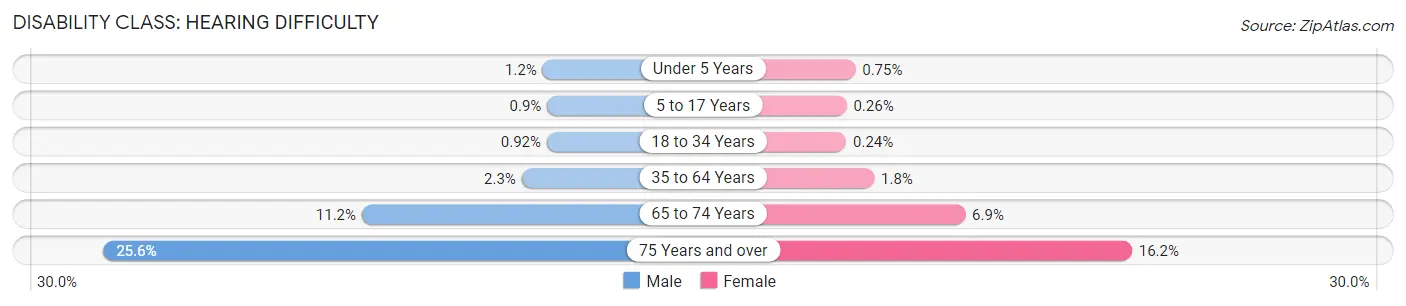
| Age Bracket | Male | Female |
| Under 5 Years | 192 (1.1%) | 113 (0.7%) |
| 5 to 17 Years | 408 (0.9%) | 114 (0.3%) |
| 18 to 34 Years | 480 (0.9%) | 124 (0.2%) |
| 35 to 64 Years | 1,575 (2.3%) | 1,239 (1.8%) |
| 65 to 74 Years | 1,303 (11.2%) | 963 (6.9%) |
| 75 Years and over | 1,678 (25.6%) | 1,457 (16.2%) |
Disability Class: Vision Difficulty
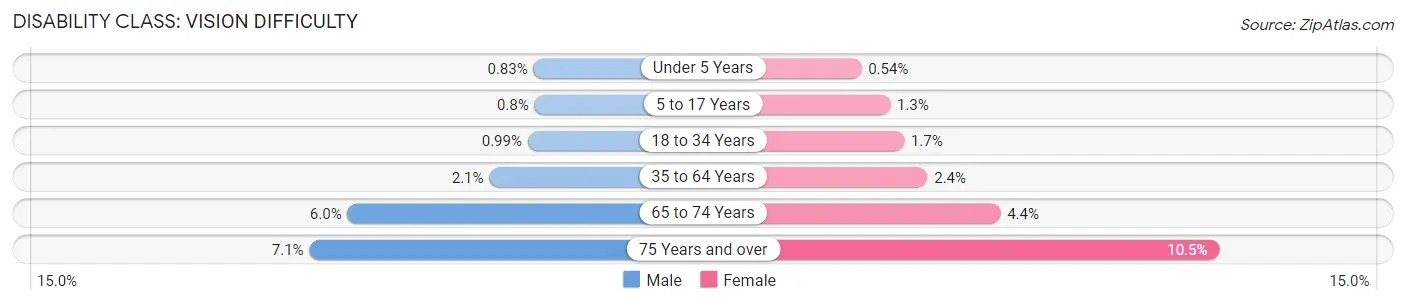
| Age Bracket | Male | Female |
| Under 5 Years | 138 (0.8%) | 82 (0.5%) |
| 5 to 17 Years | 364 (0.8%) | 579 (1.3%) |
| 18 to 34 Years | 517 (1.0%) | 890 (1.7%) |
| 35 to 64 Years | 1,399 (2.1%) | 1,641 (2.4%) |
| 65 to 74 Years | 698 (6.0%) | 619 (4.4%) |
| 75 Years and over | 463 (7.1%) | 948 (10.5%) |
Disability Class: Cognitive Difficulty
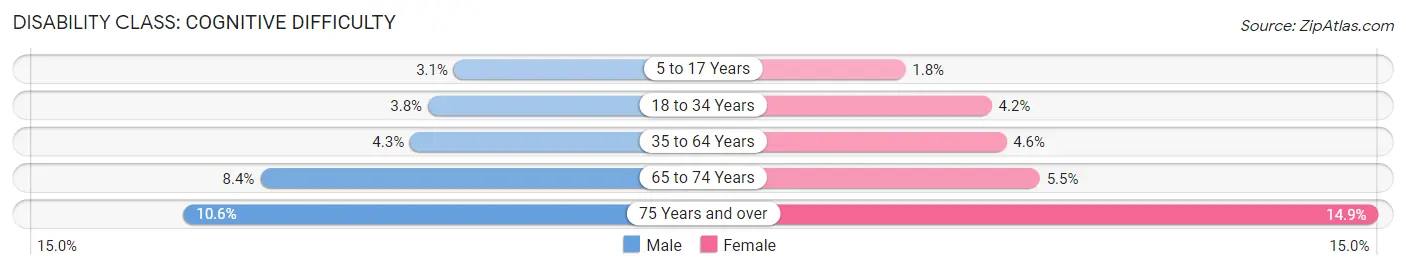
| Age Bracket | Male | Female |
| 5 to 17 Years | 1,388 (3.0%) | 767 (1.8%) |
| 18 to 34 Years | 1,971 (3.8%) | 2,150 (4.2%) |
| 35 to 64 Years | 2,903 (4.3%) | 3,154 (4.6%) |
| 65 to 74 Years | 981 (8.4%) | 773 (5.5%) |
| 75 Years and over | 693 (10.6%) | 1,348 (14.9%) |
Disability Class: Ambulatory Difficulty
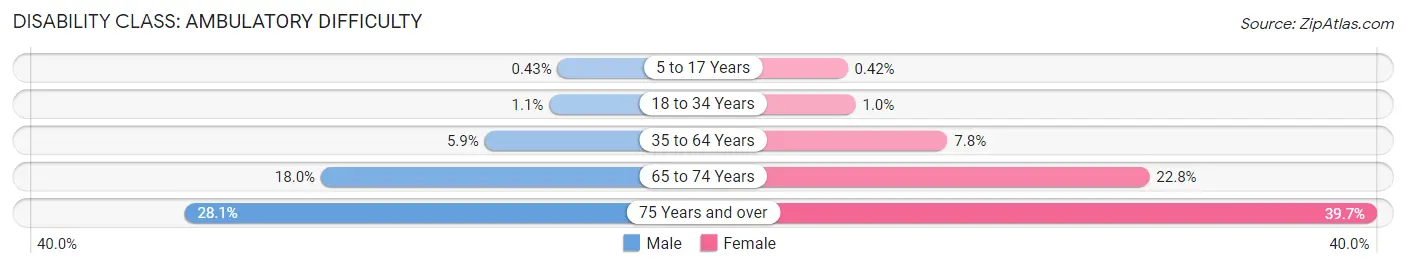
| Age Bracket | Male | Female |
| 5 to 17 Years | 194 (0.4%) | 180 (0.4%) |
| 18 to 34 Years | 547 (1.1%) | 528 (1.0%) |
| 35 to 64 Years | 3,981 (5.9%) | 5,401 (7.8%) |
| 65 to 74 Years | 2,091 (18.0%) | 3,203 (22.8%) |
| 75 Years and over | 1,842 (28.1%) | 3,585 (39.7%) |
Disability Class: Self-Care Difficulty
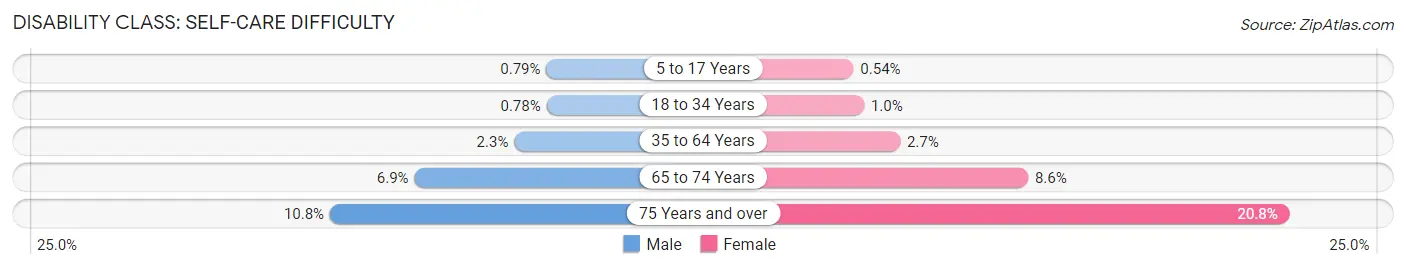
| Age Bracket | Male | Female |
| 5 to 17 Years | 361 (0.8%) | 234 (0.5%) |
| 18 to 34 Years | 405 (0.8%) | 532 (1.0%) |
| 35 to 64 Years | 1,550 (2.3%) | 1,863 (2.7%) |
| 65 to 74 Years | 803 (6.9%) | 1,211 (8.6%) |
| 75 Years and over | 709 (10.8%) | 1,875 (20.8%) |
Technology Access in Bakersfield
Computing Device Access in Bakersfield
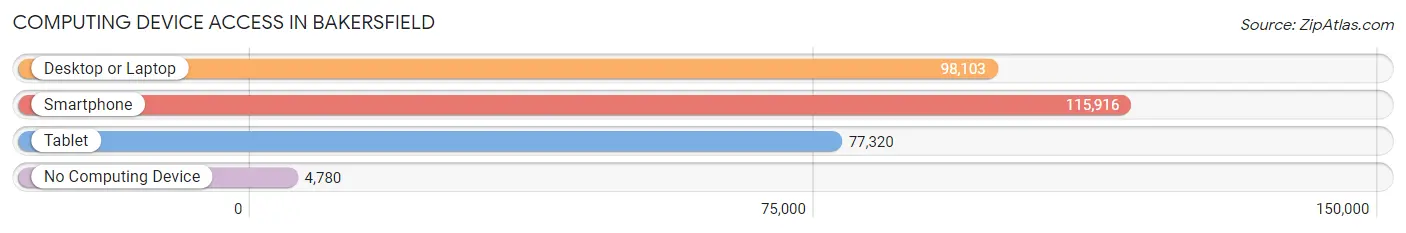
| Device Type | # Households | % Households |
| Desktop or Laptop | 98,103 | 78.6% |
| Smartphone | 115,916 | 92.9% |
| Tablet | 77,320 | 62.0% |
| No Computing Device | 4,780 | 3.8% |
| Total | 124,744 | 100.0% |
Internet Access in Bakersfield
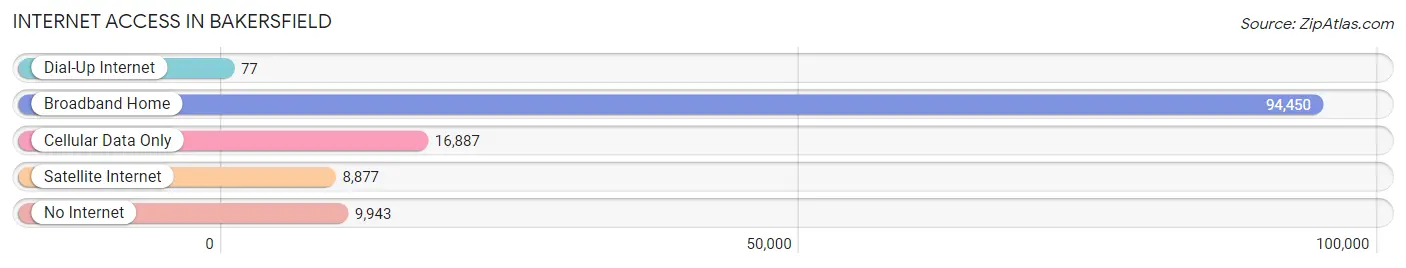
| Internet Type | # Households | % Households |
| Dial-Up Internet | 77 | 0.1% |
| Broadband Home | 94,450 | 75.7% |
| Cellular Data Only | 16,887 | 13.5% |
| Satellite Internet | 8,877 | 7.1% |
| No Internet | 9,943 | 8.0% |
| Total | 124,744 | 100.0% |
Bakersfield Summary
Bakersfield is a city located in Kern County, California, United States. It is the county seat and largest city in Kern County. As of 2019, the population of Bakersfield was estimated to be 382,841, making it the ninth-most populous city in California and the 52nd-most populous city in the United States. Bakersfield is a charter city.
History
The area that is now Bakersfield was first inhabited by Native American tribes, including the Yokuts and the Chumash. The first European to explore the area was Spanish explorer Francisco Garcés, who arrived in 1776. The area was later explored by American trappers and traders, and in 1851, the first permanent settlement was established by Thomas Baker. The settlement was named after Baker, and the area became known as Bakersfield.
In 1866, Bakersfield was incorporated as a city. During the late 19th century, the city experienced rapid growth due to the discovery of oil in the area. By the early 20th century, Bakersfield had become a major center for oil production and agriculture.
Geography
Bakersfield is located in the southern end of the San Joaquin Valley, approximately 110 miles north of Los Angeles. The city covers an area of approximately 143 square miles and is situated at an elevation of approximately 486 feet above sea level. The city is bordered by the Kern River to the south and the Sierra Nevada Mountains to the east.
Climate
Bakersfield has a semi-arid climate, with hot, dry summers and mild, wet winters. The average annual temperature is 64°F, with an average high of 95°F in July and an average low of 33°F in January. The average annual precipitation is 8.5 inches.
Economy
Bakersfield’s economy is largely based on agriculture, oil, and manufacturing. The city is home to several large oil companies, including Chevron, Aera Energy, and Occidental Petroleum. Agriculture is also a major industry in the area, with crops such as cotton, grapes, and citrus fruits being grown in the region. Manufacturing is also an important part of the local economy, with companies such as Boeing, Lockheed Martin, and General Electric having a presence in the city.
Demographics
As of 2019, the population of Bakersfield was estimated to be 382,841. The racial makeup of the city was 57.2% White, 8.2% African American, 1.3% Native American, 5.2% Asian, 0.3% Pacific Islander, 25.2% from other races, and 2.7% from two or more races. The median household income was $50,817, and the median family income was $58,945. The per capita income was $23,845.
Bakersfield is home to a diverse population, with a large Hispanic population (41.2%) and a significant Asian population (5.2%). The city is also home to a large number of military veterans (7.3%).
Conclusion
Bakersfield is a city located in Kern County, California, United States. It is the county seat and largest city in Kern County. As of 2019, the population of Bakersfield was estimated to be 382,841, making it the ninth-most populous city in California and the 52nd-most populous city in the United States. Bakersfield is a charter city with a semi-arid climate, and its economy is largely based on agriculture, oil, and manufacturing. The city is home to a diverse population, with a large Hispanic population (41.2%) and a significant Asian population (5.2%). Bakersfield is a vibrant city with a rich history and a bright future.
Common Questions
What is Per Capita Income in Bakersfield?
Per Capita income in Bakersfield is $31,892.
What is the Median Family Income in Bakersfield?
Median Family Income in Bakersfield is $81,672.
What is the Median Household income in Bakersfield?
Median Household Income in Bakersfield is $73,827.
What is Income or Wage Gap in Bakersfield?
Income or Wage Gap in Bakersfield is 31.5%.
Women in Bakersfield earn 68.5 cents for every dollar earned by a man.
What is Family Income Deficit in Bakersfield?
Family Income Deficit in Bakersfield is $11,336.
Families that are below poverty line in Bakersfield earn $11,336 less on average than the poverty threshold level.
What is Inequality or Gini Index in Bakersfield?
Inequality or Gini Index in Bakersfield is 0.46.
What is the Total Population of Bakersfield?
Total Population of Bakersfield is 404,321.
What is the Total Male Population of Bakersfield?
Total Male Population of Bakersfield is 201,457.
What is the Total Female Population of Bakersfield?
Total Female Population of Bakersfield is 202,864.
What is the Ratio of Males per 100 Females in Bakersfield?
There are 99.31 Males per 100 Females in Bakersfield.
What is the Ratio of Females per 100 Males in Bakersfield?
There are 100.70 Females per 100 Males in Bakersfield.
What is the Median Population Age in Bakersfield?
Median Population Age in Bakersfield is 31.5 Years.
What is the Average Family Size in Bakersfield
Average Family Size in Bakersfield is 3.7 People.
What is the Average Household Size in Bakersfield
Average Household Size in Bakersfield is 3.2 People.
How Large is the Labor Force in Bakersfield?
There are 187,382 People in the Labor Forcein in Bakersfield.
What is the Percentage of People in the Labor Force in Bakersfield?
63.1% of People are in the Labor Force in Bakersfield.
What is the Unemployment Rate in Bakersfield?
Unemployment Rate in Bakersfield is 7.1%.